
Most retail investors check the bond market the wrong way. They glance at the 10-year yield, decide whether it went up or down, and move on. That approach misses the signal entirely, because the bond market communicates through cross-asset sequencing, supply dynamics, and technical structure. By the time the yield move is obvious in the headlines, institutional money has already positioned.
Right now, a specific configuration is transmitting a coherent rate signal. Gold is breaking higher. The dollar is softening. Treasury buyback operations are scaling up at the long end. And TLT, the most widely held long-bond ETF, is showing a technical breakout above former support. Each of those inputs matters individually; together, they form a readable signal on where long yields are likely heading and why.
Here is a concrete, repeatable framework for reading the long-bond market: what to look for in cross-asset signals before bonds move, how Treasury Department buybacks shape price floors, how to chart TLT as a cleaner instrument than futures, how to anchor the technical read in macro data, and how to size a defined-risk options structure when the setup aligns. After this, interpreting bond market behaviour becomes a process you can run yourself, not a skill reserved for fixed-income desks.
Why the bond market rarely leads its own story
Long-maturity US Treasuries anchor the global risk-free curve. Changes in their yields ripple through mortgages, corporates, equities, and currency markets. But here is what surprises most investors: the bond market itself often lags in signalling rate transitions. It is usually the last major asset class to confirm a directional shift, not the first.
Grasping bond yield mechanics, specifically how fixed coupon payments create an inverse relationship between price and yield, is the foundational step before cross-asset sequencing makes intuitive sense rather than feeling like abstract pattern-matching.
The reason is structural. Gold and currencies move first because they trade globally, respond to real-rate expectations instantly, and face fewer domestic supply constraints than Treasuries. When gold breaks higher and the dollar softens simultaneously, the implied message is lower real yields, either nominal yields falling, inflation staying firm, or both. Bond-specific flows, including official sector selling, heavy issuance, or crowded short positioning, can delay the Treasury confirmation.
Gold ETF inflows are one of the cleanest ways to confirm that the metal’s price move reflects genuine institutional allocation rather than short-term speculative repositioning, because physically backed fund purchases require real bullion acquisition and encode multi-month allocation decisions that futures positioning does not.
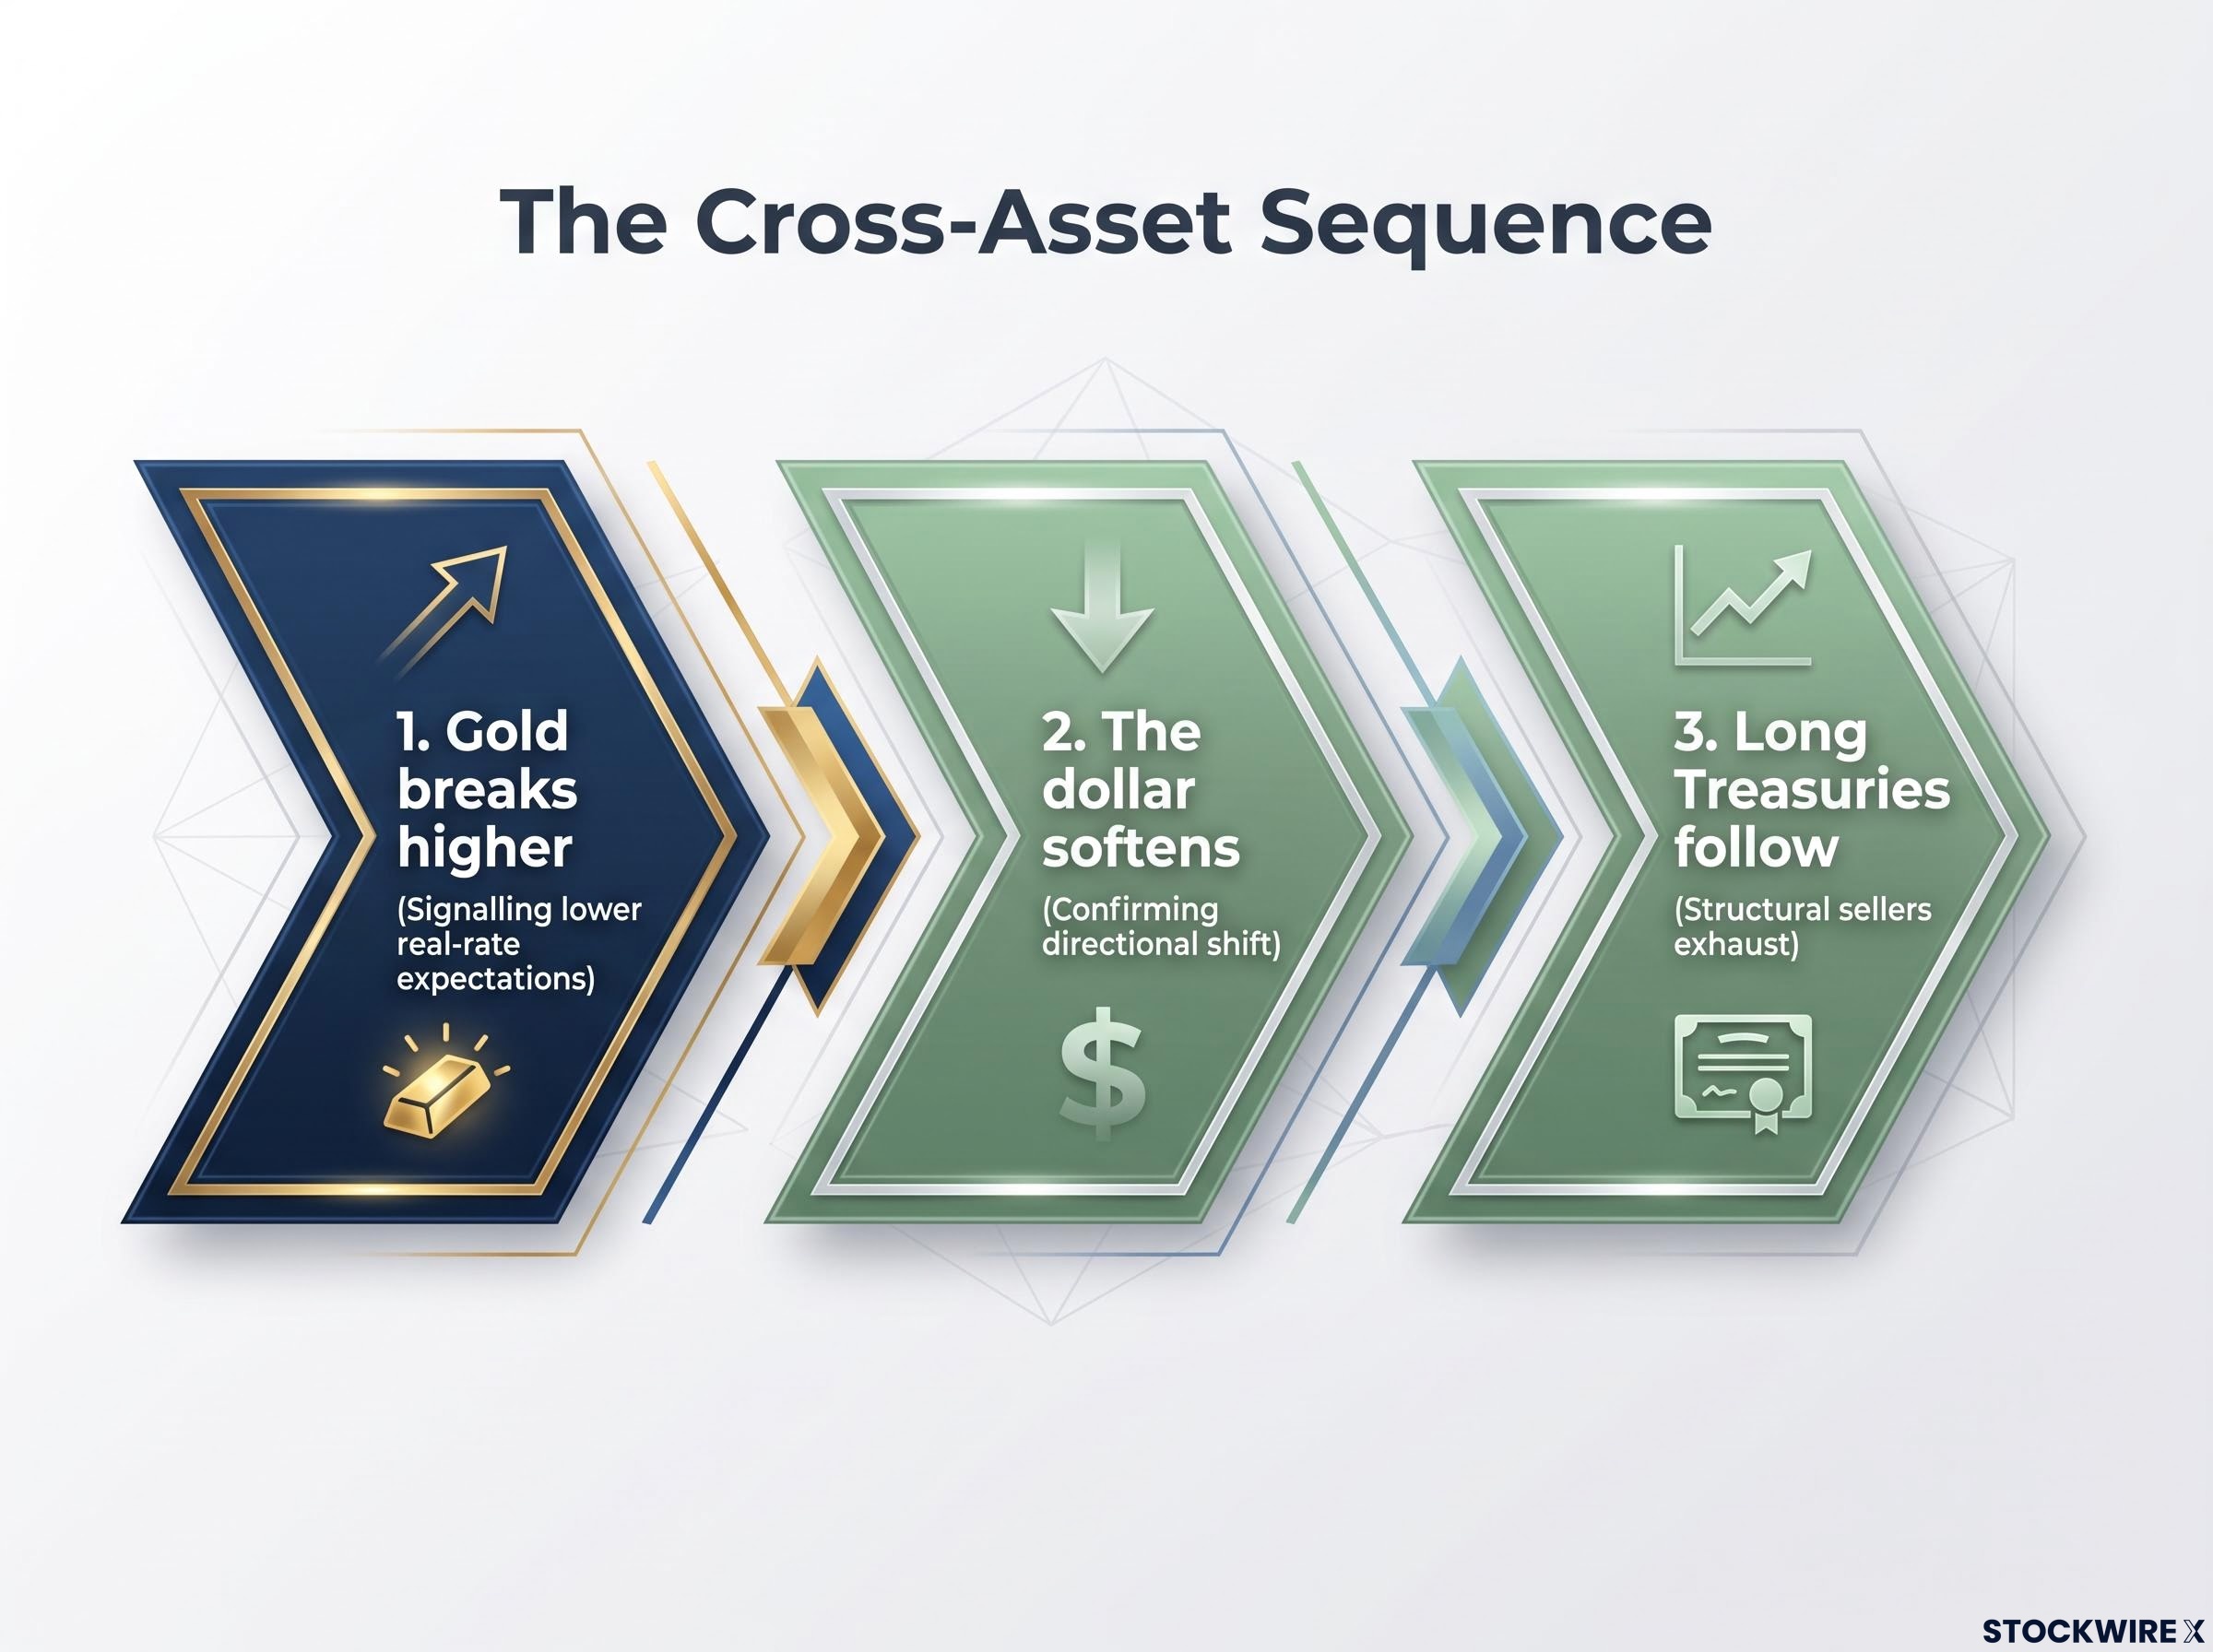
The classic cross-asset sequence runs in a specific order:
- Gold breaks higher, signalling lower real-rate expectations.
- The dollar softens, confirming the directional shift in rate expectations across currency markets.
- Long Treasuries follow, as bond-specific flows and structural sellers exhaust.
Right now, that sequencing is playing out. Gold has already moved higher, and the dollar has already softened, both ahead of TLT’s own technical breakout. That is the classic pattern described above, not a contradiction.
Investors who treat gold and FX as leading indicators and bond price action as validation can position earlier for duration exposure. Those who wait for all three assets to move together receive confirmation, but not early entry.
If gold and the dollar have already moved in a bond-bullish direction while Treasuries are still consolidating, that lag is not a reason to dismiss the setup. It is the sequencing working exactly as institutional participants expect, and it tells you where to look next: Treasury supply dynamics.
When big ASX news breaks, our subscribers know first
What Treasury buybacks actually do, and why they matter to you
If you have heard the term “Treasury buybacks” and assumed it means the same thing as Federal Reserve quantitative easing (QE), you are not alone. The confusion is widespread, and it produces a wrong read of who is intervening in the bond market and why. The distinction matters because it changes how you interpret the signal.
Fed operations target monetary policy: reserves, the fed funds rate, and broader QE programmes designed to influence financial conditions across the economy. Treasury buybacks are a different animal entirely. They target market functioning and the composition of outstanding government debt, particularly at the long end of the curve.
Treasury buyback mechanics differ from QE in one critical respect: the programme swaps long-duration supply for short-duration supply without creating new reserves, which is why the signal embedded in operation size changes carries more analytical weight than the raw dollar volume being deployed.
| Attribute | Fed Operations (QE) | Treasury Buybacks |
|---|---|---|
| Purpose | Monetary policy, influence financial conditions | Market functioning, debt profile management |
| Mechanism | Creates reserves to purchase Treasuries and MBS | Uses Treasury cash to retire specific outstanding issues |
| Target | Broad financial conditions, fed funds rate | Specific maturities (10-30 year sector), liquidity in stressed segments |
| Investor interpretation | Rate suppression, risk-asset support | Soft price floor, yield ceiling at long end |
How to find and interpret buyback announcements
Treasury publishes buyback operation details through TreasuryDirect and the Bureau of the Fiscal Service schedule pages. What matters is the sector covered (10-20 year versus 20-30 year), the operation size, and the effective date range.
In August 2026, the Treasury announced it would double the size of long-end liquidity support buyback operations to at least $4 billion per operation in the 10-20 year and 20-30 year sectors, effective 9 September through 4 November 2026. A doubling of operation size signals a deliberate escalation in support, not routine management. Prior to that formal announcement, the Treasury had acted in coordination with Japanese authorities on yen exchange rate stabilisation, a move that market participants read as an early signal of the broader support effort that the buyback programme would subsequently formalise.
When a long-bond consolidation coincides with a ramp-up in Treasury buybacks, the odds that the floor holds improve materially. The entity with the largest balance sheet in the market has just told you where it is willing to buy, and that changes the risk calculus for anyone positioned short in those maturities.
Reading the bond market through TLT, not the futures screen
If you have ever tried to analyse bond futures and found the charts confusing, the contract rolls disorienting, and the margin requirements off-putting, you are in good company. Bond futures are designed for institutional desks with dedicated infrastructure. For most self-directed investors, there is a cleaner way in.
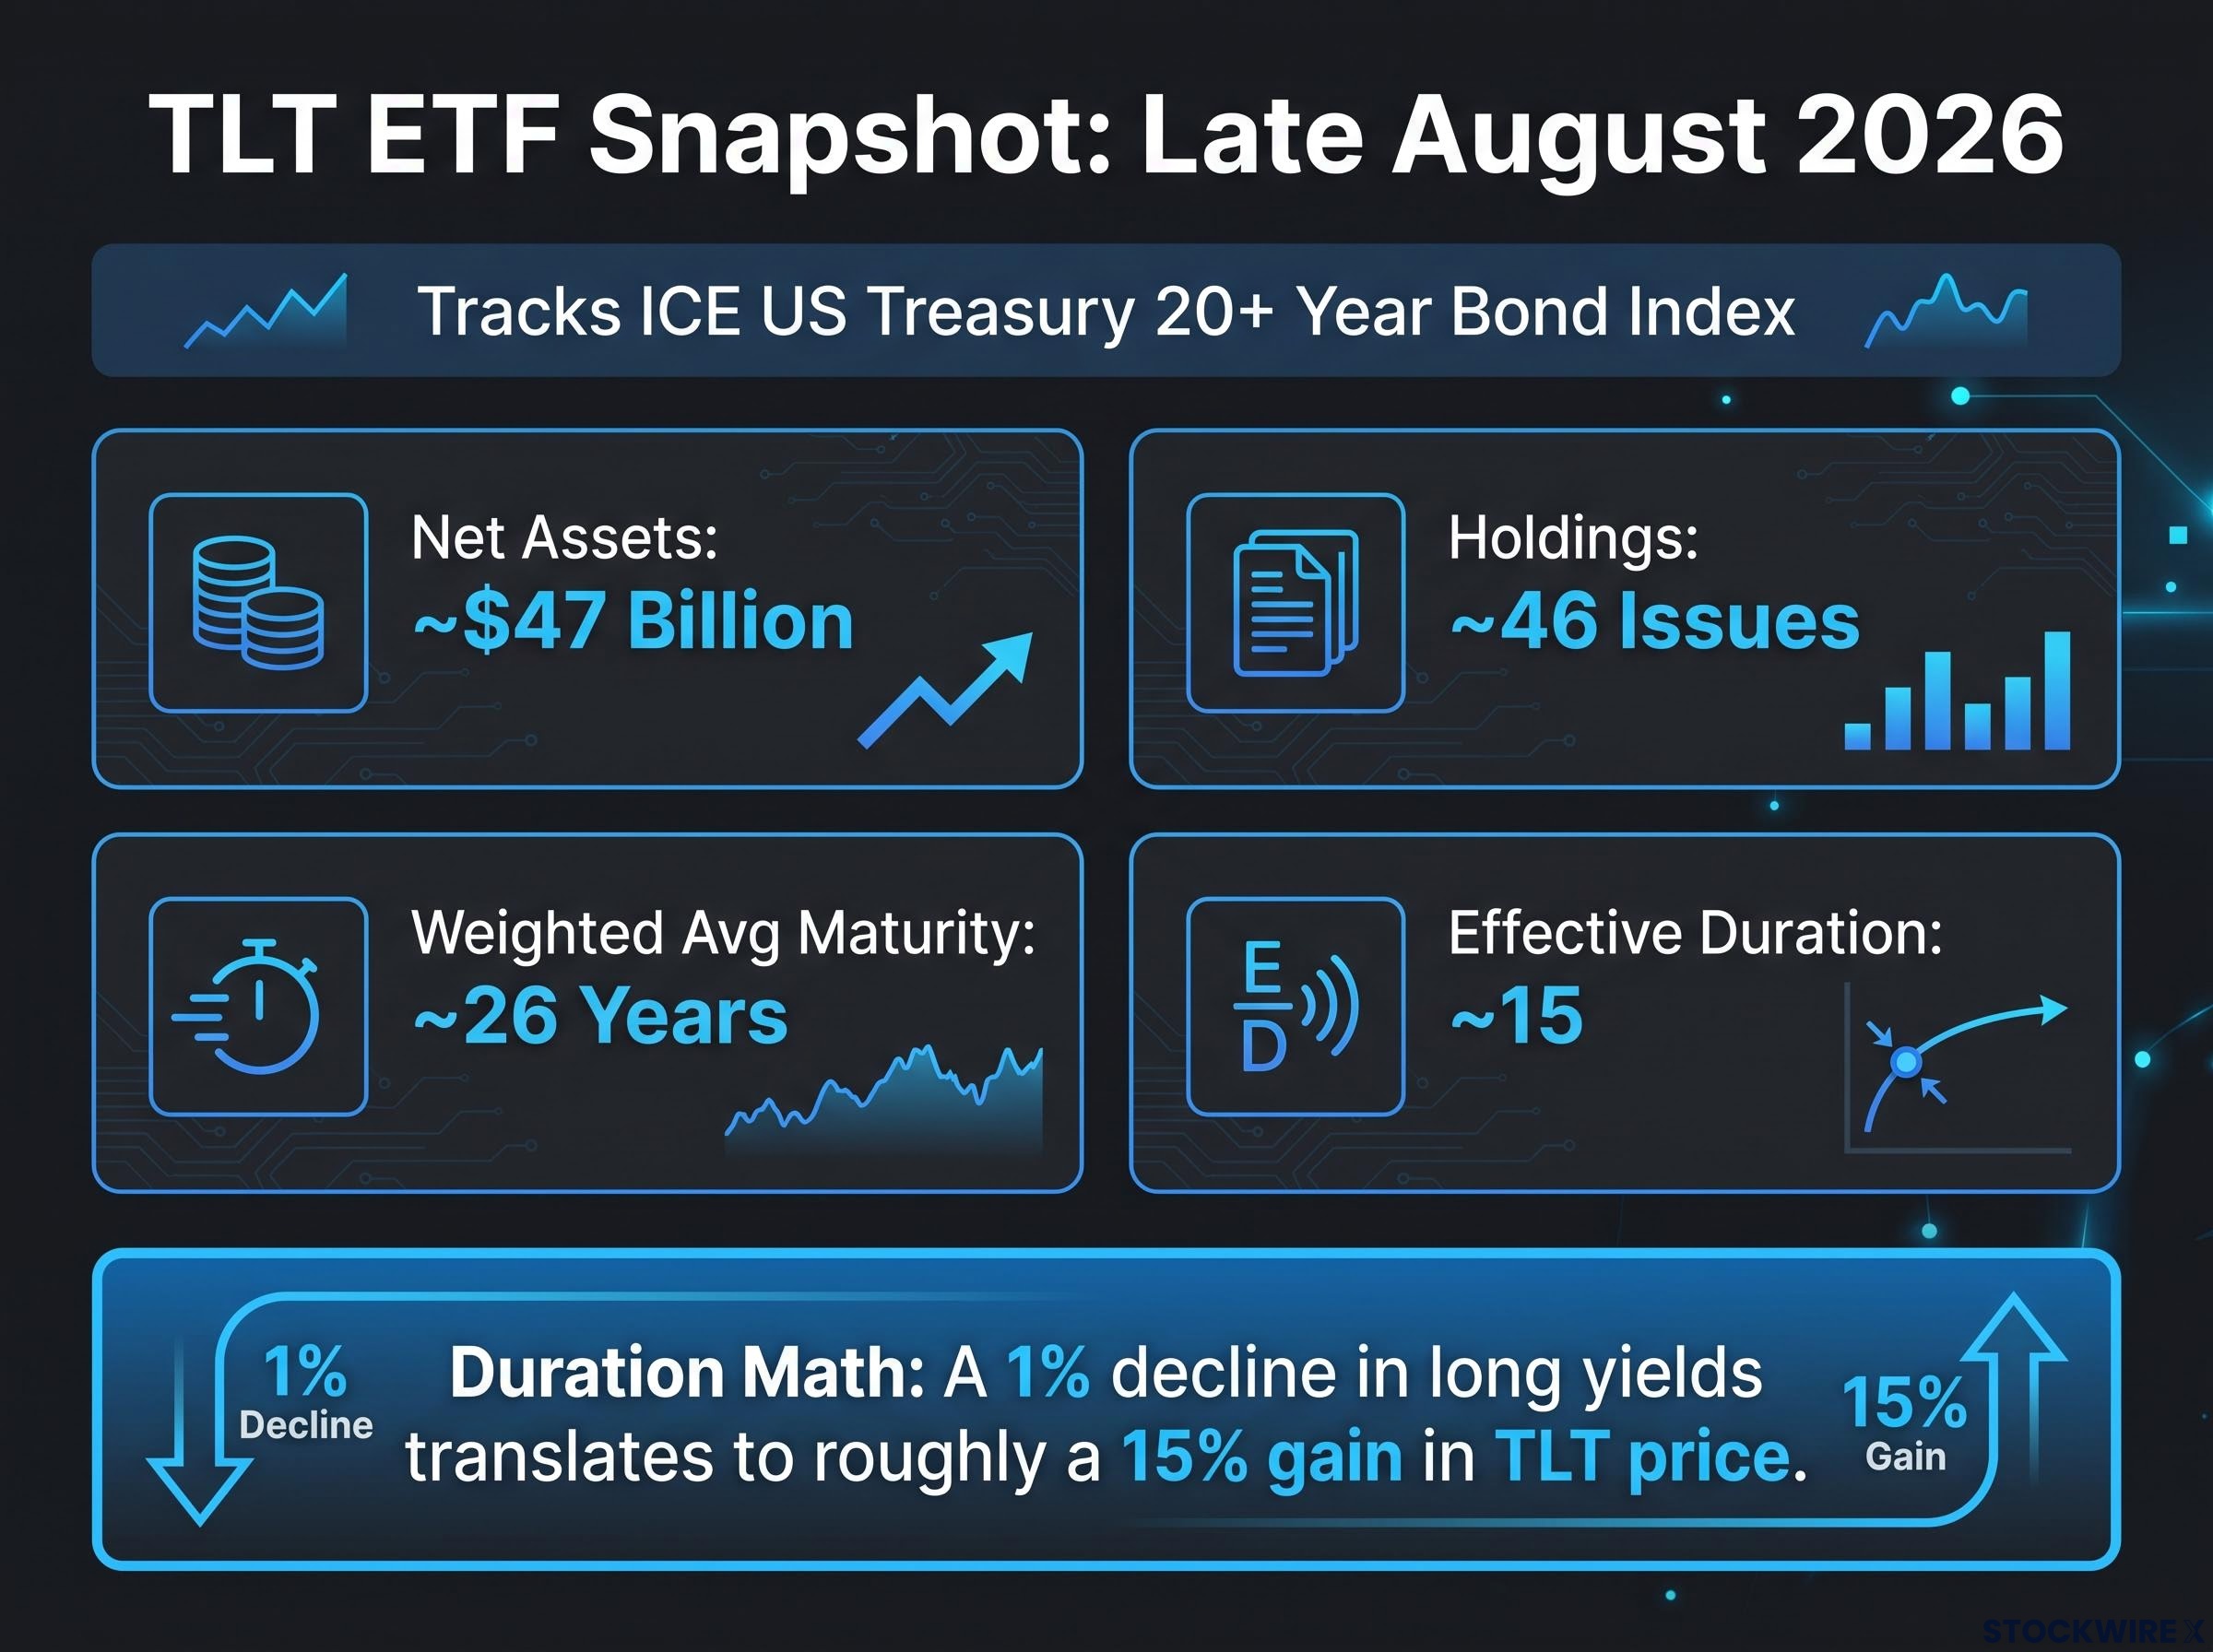
The iShares 20+ Year Treasury Bond ETF, known as TLT, tracks the ICE US Treasury 20+ Year Bond Index. It invests at least 80% of its assets in index components, all of which are public obligations of the US Treasury with remaining maturities greater than 20 years. As of late August 2026, TLT holds approximately $47 billion in net assets across roughly 46 issues, with a weighted average maturity near 26 years and an effective duration near 15.
Effective duration measures how sensitive a bond’s price is to changes in interest rates; a duration of 15 means that for every 1% decline in long yields, TLT’s price rises by roughly 15%. That relationship is what makes understanding TLT’s technical patterns worth your time.
TLT has several practical advantages over futures for technical analysis:
- No contract-roll cost or chart distortion from switching between expiries
- Chartable like an equity, with daily volume, gaps, trendlines, and support-resistance levels
- Tradeable through a standard brokerage account with no futures approval required
- Options-eligible, allowing defined-risk structures
“With an effective duration near 15, a 1% decline in long yields translates to roughly a 15% gain in TLT’s price.”
What a genuine breakout looks like versus a false reclaim
The most useful technical patterns on TLT involve prior floor levels. You identify a zone that repeatedly acted as support during a downtrend, note when price broke below that floor, then watch for a later reclaim and a decisive move through the reclaimed level on strong volume.
Institutional conviction shows up in volume. A thin-volume reclaim of a prior floor is more likely a short squeeze than a regime change. A high-volume breakout above that same level, particularly when it coincides with structural support (Treasury buybacks) and cross-asset confirmation (gold and FX already signalling lower real yields), is a meaningfully different signal.
Price in TLT recently pushed above a former support zone that had been tested repeatedly on the way back up, completing a breakout that is more legible on the ETF chart than the equivalent move in the futures market over the same period. The fact that this breakout coincides with the Treasury’s expanded buyback programme and bullish signals in gold and currency markets distinguishes it from an isolated technical event.
Anchoring the technical read in macro data that actually matters
A TLT breakout is a hypothesis until the inflation and growth data either confirm or undermine it. The chart tells you what price is doing. The macro data tells you whether the fundamental conditions support continued movement in that direction. Your job is knowing which data series carry signal and which generate noise.
Start with inflation, and specifically with rolling core Personal Consumption Expenditures (PCE) measures, the Federal Reserve’s preferred inflation gauge that tracks changes in prices paid by consumers. Single headline prints are noisy. A slightly hot month does not reverse a trend, and a slightly cool month does not confirm one. What matters is the direction across multiple periods.
The rolling inflation trend across 3-month and 6-month annualised PCE windows carries more signal than any single headline print because it strips out the energy-driven distortions that dominated the May 2026 CPI release and exposes the underlying disinflation trajectory the Fed is actually responding to.
Here is where the data sits:
- Headline PCE came in at 3.7%, slightly above the 3.6% consensus
- Core PCE held steady at 3.3%, in line with expectations
- The 3-month annualised PCE has been declining since March
- The 6-month annualised PCE appears to have peaked in May, with three consecutive months of decline through July
The overall picture is broadly disinflationary despite the slightly elevated headline print, and more consistent with rate holds than additional hikes.
One complication in the data is the divergence between two forward-looking signals. The Cleveland Fed nowcast, refreshed after the latest PCE release, pointed toward rising inflation in the months ahead, while CPI-based signals ran in the opposite direction, implying a softer trajectory. Most analysts placed greater weight on the direction of the rolling PCE trend than on either single-source projection for assessing the medium-term rate path. When forecasting models produce conflicting signals, the multi-month trend in the Fed’s preferred measure is the more reliable guide.
| Macro indicator | Bond-friendly direction | Current reading |
|---|---|---|
| Rolling core PCE (3-month and 6-month) | Declining trend | Declining since March (3-month); peaked May, three months of decline (6-month) |
| Citigroup Economic Surprise Index | Negative (data underperforming consensus) | Negative since early August |
| Atlanta Fed GDPNow | Revising lower | Successive August updates pointing toward weaker growth |
On the growth side, incoming economic data has been broadly disappointing relative to expectations since early August. The Citigroup Economic Surprise Index turned negative as releases repeatedly missed consensus, and the Atlanta Fed’s GDPNow model has tracked that weakness through successive downward revisions over the same period. A notably strong S&P Global reading stood apart from the broader run of data, but the overall direction of economic news flow has continued to tilt softer.
Your hierarchy of data importance should run in this order:
- Rolling core PCE trends (3-month and 6-month annualised) first
- Economic surprise indices second
- GDP nowcast models third
- Single headline data prints last
When rolling core PCE is in a persistent declining trend and economic surprise indices are negative, the fundamental case for lower terminal rates is building alongside the technical case in TLT. That alignment is what converts a chart signal into a conviction position, and it is what separates a disciplined macro read from reactive trading off individual data releases.
Turning the bond read into a structured trade with defined risk
Everything above gives you a directional thesis. Now you need an instrument and a structure. There are three common ways to express a constructive long-bond view, each with a different trade-off:
Cash duration (buying TLT or individual long-maturity Treasuries) is the simplest approach. You own the position outright. The downside is unlimited mark-to-market volatility if your timing is wrong.
Futures or swaps are the institutional route. They are capital-efficient but require derivatives infrastructure, margin management, and familiarity with contract specifications that most retail investors do not have.
Options on TLT allow a defined-risk structure with asymmetric upside, and they are accessible through any brokerage account with standard options approval.
A bull call spread, specifically, works like this:
- Buy a call option near the money (close to TLT’s current price)
- Sell a higher-strike call option at the same expiry
- Your maximum loss equals the net premium paid
- Your maximum gain equals the spread width (difference between strikes) minus the net premium
The risk-reward profile from the original analysis by WSPA, Head of Global Macro at Tasty Live, described a bull call spread on TLT that risked approximately 1 unit to potentially gain 5-6 units, with approximately 51 days until expiration.
“The structure risks 1 unit to potentially gain 5-6 units. That asymmetry is only useful if position size makes a full loss manageable.”
Before entering, run through this four-condition checklist:
- Cross-asset signals aligned: gold higher, dollar softer, sequencing intact
- Macro data confirms: rolling core PCE declining, surprise indices negative
- TLT breakout confirmed on volume, not a thin reclaim
- Implied volatility not elevated enough to destroy spread pricing
A 1-to-5 or 1-to-6 risk-reward on a defined-loss structure does not mean you should size it aggressively. It means the asymmetry rewards patience and a small position, because if the setup is right, the return per dollar risked is substantial even on a modest allocation. Position sizing is a risk-budget decision, not a confidence decision: the structure only makes sense if a full loss of the premium is tolerable within your portfolio, regardless of how compelling the setup appears.
This article is for informational purposes only and should not be considered financial advice. Investors should conduct their own research and consult with financial professionals before making investment decisions. Options strategies involve risk, including the potential loss of the entire premium paid. Past performance does not guarantee future results.
A framework you can run before the next rate signal appears
You now have a six-step process that turns bond market noise into a structured read. It is not a set of conditions that must all flash green simultaneously. It is an analytical sequence, and different steps will activate at different stages of a developing setup.
- Check gold and the dollar. Rising gold plus a weakening dollar signals lower real-rate expectations, often bond-supportive.
- Scan Treasury buyback policy. Look for changes in operation size, sector coverage, and effective dates. These define supply dynamics at the long end.
- Read inflation in trends, not headlines. Favour rolling core PCE measures (3-month and 6-month annualised) over single prints.
- Assess growth surprise indices. A Citigroup Economic Surprise Index slipping negative, combined with downward GDP nowcast revisions, lowers rate-hike odds and compresses term premia.
- Chart TLT. Identify whether price is basing near prior floors, breaking above former support, or failing at resistance, and note volume to assess institutional conviction.
- Choose expression and structure. Decide between cash duration, futures, or defined-risk options like bull call spreads. Ensure the risk-reward profile fits your thesis, time horizon, and risk budget.
“Each step cross-checks the others. A breakout without macro confirmation is a lower-conviction signal. Macro alignment without a technical entry is a thesis waiting for an instrument.”
The August 2026 setup is the worked example. All six steps aligned: gold and the dollar moved first, Treasury buybacks doubled in size, rolling PCE continued declining, economic surprise indices turned negative, and TLT broke above former support on volume. That configuration, where technical, macro, and structural signals were mutually reinforcing, produced the kind of setup where a small, defined-risk position carried outsized potential return per dollar risked.
Having this process does not eliminate uncertainty. It ensures that when you take a position, you have checked every layer of the signal rather than reacting to one compelling chart or one headline data print. That discipline is what converts the bond market from a source of anxiety into a source of analytical information you can read, cross-check, and act on.