
Investors who watched the S&P 500 fall more than 50% during the 2008 financial crisis waited about five and a half years to see their money back at its starting point. But the investors who lived through the dot-com bust had to wait roughly the same amount of time after a decline that was three percentage points shallower.
Two crashes, nearly identical price-only recovery timelines, completely different causes. That asymmetry is the central puzzle worth untangling.
When markets fall hard, the question investors ask is not “how bad is it?” but “how long until it’s over?” The historical record on bear market recovery time spans nearly a century and includes the Great Depression, stagflation, a valuation bubble, and a global banking collapse. Each episode ran on a different clock. Understanding why tells you something more useful than a single average number.
Here is the concrete timeline for each major U.S. bear market, the mechanical reason dividends have consistently shortened the path back to breakeven, and a framework for reading that history against your own time horizon. After this, the question “how long does recovery take?” will have a real answer, not a shrug.
What “recovery” actually means, and why the maths works against you
A bear market is a drop of 20% or more from a recent peak in a broad index such as the S&P 500, usually lasting at least several months. That part most investors know. What fewer people think carefully about is what “recovery” actually means.
Recovery does not mean the market has bounced off the bottom. It means the index has returned to its prior all-time high. The distinction matters enormously, because the full cycle has two separate phases:
- Phase one: Peak to trough (the decline itself, the part that makes headlines).
- Phase two: Trough back to the prior peak (the recovery, the part that tests patience).
Phase two is almost always longer than phase one, and the reason is arithmetic.
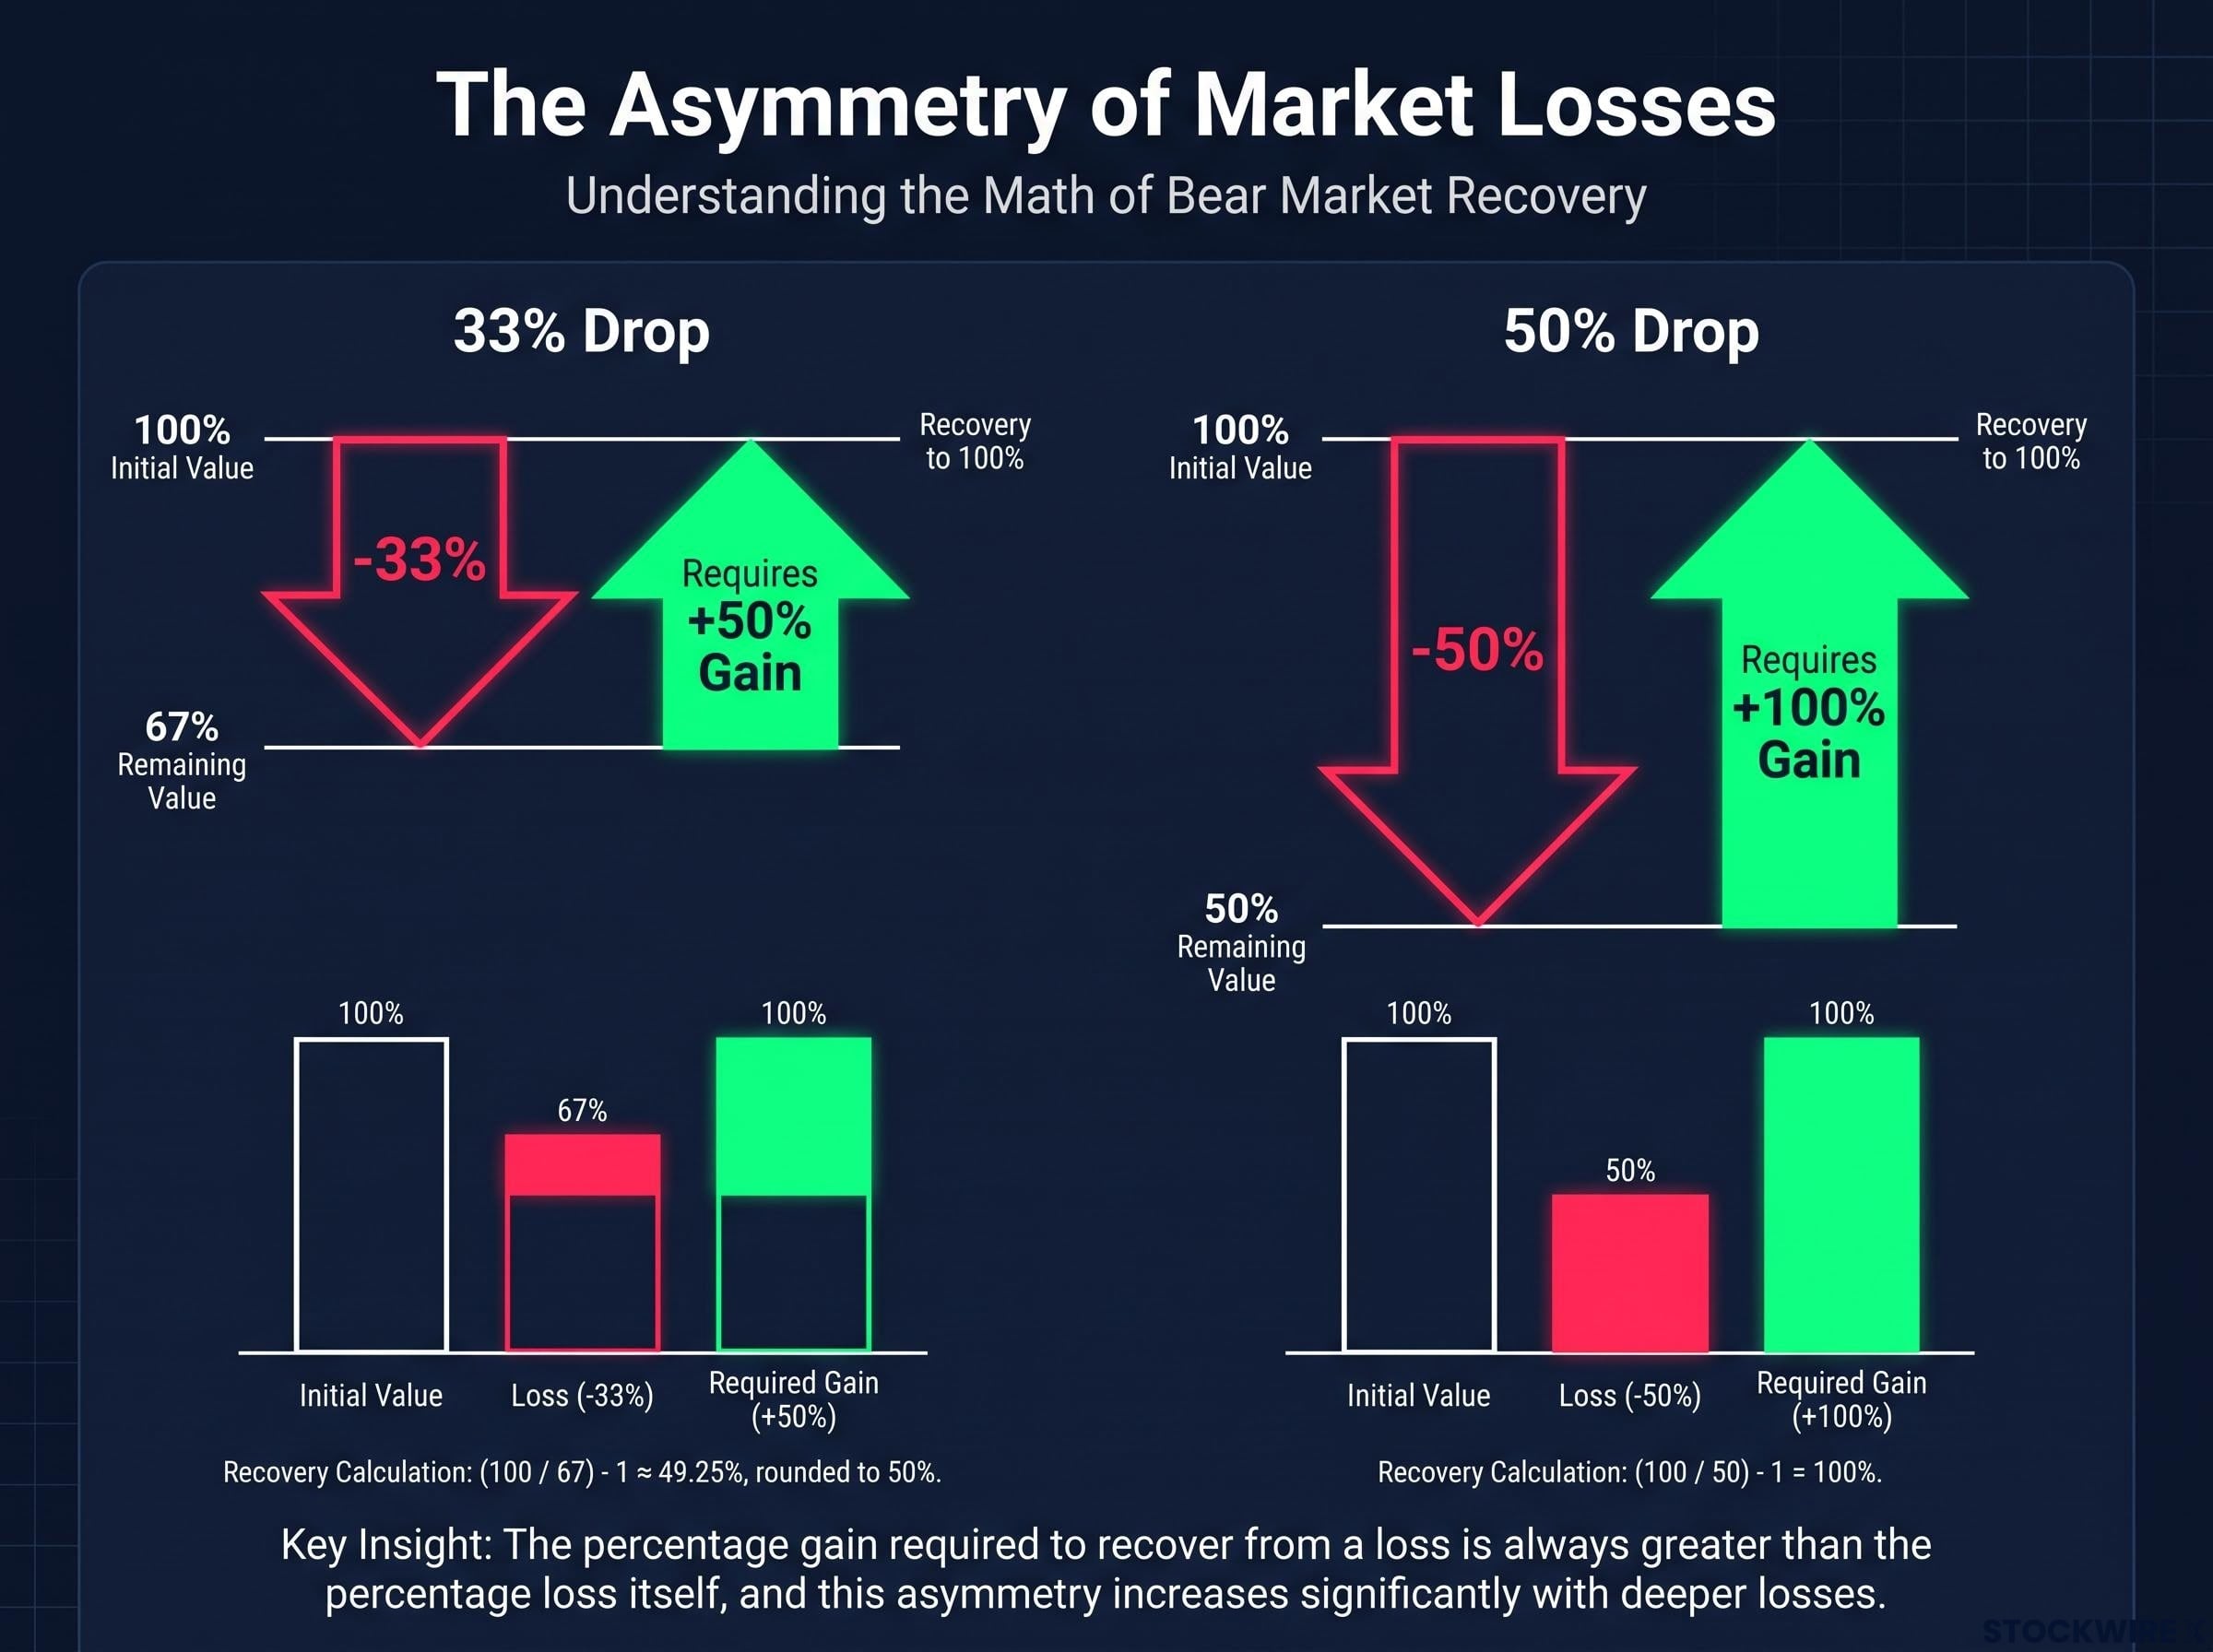
A 50% loss requires a 100% gain just to get back to where you started. A 33% loss requires a 50% gain. The deeper the hole, the steeper the climb out.
On average, bear markets have declined roughly 35% and lasted about 9-16 months from peak to trough, depending on the dataset. But the recovery phase, trough back to a new high, has averaged roughly 2-4 years, with a median closer to 14 months when extreme outliers are excluded.
Your personal recovery clock starts from the peak, not the bottom. That distinction materially changes how you should think about your own timeline, because the market may have rallied 30% from its low and still be well below the price you actually paid.
When big ASX news breaks, our subscribers know first
The full historical range, from four months to 25 years
The headline averages mask a remarkable range. According to Hartford Funds and Ned Davis Research, the combined peak-to-trough and trough-to-recovery journey has averaged around 2.5 years across their S&P 500 data going back to 1928-1929, reflecting a decline phase of roughly nine to ten months and a subsequent recovery of around a further year and a half. Broader long-run datasets that include all secular bear markets push that average closer to 4 years trough-to-new-high.
The Hartford Funds bear market data, drawing on Ned Davis Research figures going back to 1928, records 27 distinct S&P 500 bear markets, giving the combined peak-to-trough and recovery average of around 2.5 years a statistically meaningful foundation across nearly a century of market history.
Looking specifically at the postwar era, the 11 bear markets since 1945 took on average about 37 months (roughly three years) to recover from trough to a new high, with a median closer to 23 months, or about two years.
That two-year median is the number that should anchor a modern investor’s expectations, because the condition that produced the extreme outlier on the other end of the range, the 25-year price-only recovery from 1929, has not recurred and was the product of specific, historically abnormal policy failures.
| Bear Market | Approximate Decline | Price-Only Recovery | Total-Return Recovery |
|---|---|---|---|
| 1929-32 (Great Depression) | -82% to -89% | ~25 years | ~15 years |
| 1968-70 | -35% to -36% | ~3.5-4 years | ~2.5 years |
| 1973-74 | -48% | ~7-8 years | ~4-5 years |
| 2000-02 (Dot-Com) | -49% | ~7 years | ~6 years |
| 2007-09 (GFC) | -56% to -57% | ~5.5 years | ~4.5 years |
The spread is enormous. Under 6 months at the short end, approximately 25 years at the long end on a price-only basis. No single average captures that range, which is exactly why you need to understand what drove each episode individually.
Why 1929 is the wrong mental model for modern bear markets
The Depression’s 25-year price-only recovery was not the product of ordinary market forces. It was driven by a cascade of specific policy failures: widespread bank collapses, monetary contraction by the Federal Reserve, protectionist tariffs that choked international trade, and a deflationary spiral that destroyed corporate earnings for years.
Most modern analysis treats 1929 as a worst-case boundary, not a central scenario. The institutional safeguards, deposit insurance, central bank intervention frameworks, and fiscal policy tools that exist today did not exist then. Using the Depression as your default expectation for how long recovery takes is like planning your commute around the assumption of a bridge collapse.
The five major crashes, decoded by cause and clock
The table above tells you how long each recovery took. What it does not tell you is why the clocks ran at such different speeds. The cause of the bear market, not just its depth, is what set the pace.
1973-74: when inflation outlasted the price recovery
- The 1973-74 stagflation bear dropped roughly -48% from peak to trough. Oil-price shocks, high and volatile inflation, and weak real growth created a macro environment where corporate earnings could not grow fast enough to pull prices back up quickly. Getting back above the early-1973 high on a price-only basis required close to seven and a half years. Once dividends are factored in and reinvested, that timeline compresses to somewhere in the range of 4-5 years, as the comparatively high yields available in the mid-1970s made each reinvested payment particularly powerful.
What the price-only number does not capture is that nominal prices eventually recovering did not mean investors were actually made whole. Real inflation-adjusted wealth remained impaired significantly longer. In a high-inflation era, a simple price-based breakeven can overstate how well off you actually are.
The dot-com bust: why valuations set a slow clock
- The dot-com bust peaked in March 2000, bottomed in October 2002, and fell about -49% over 929 calendar days. The price-only recovery took roughly 7 years from peak, not regaining the March 2000 high until mid-2007. Total-return recovery was approximately 6 years, reflecting the smallest dividend benefit of any major episode, because many high-flying tech stocks paid little or no dividends.
When extreme price-to-earnings multiples are the primary driver of a bear market, recovery requires both earnings growth and an investor sentiment reset, not just a policy response or credit market thaw. The valuations had to be absorbed by years of real earnings growth catching up to where prices had been.
The GFC: deeper but faster, and what that tells you
- The 2007-09 Global Financial Crisis (GFC) produced the deepest decline of the modern era: approximately -56% to -57% from the October 2007 peak to the March 2009 trough. Yet on a price-only basis, the S&P 500 regained its prior high by approximately March 2013, about 5.5 years from peak. With dividends reinvested, the recovery shortened to approximately 4.5 years.
The GFC recovered faster than the dot-com bust despite being deeper. That counterintuitive outcome tells you something fundamental: the cause of a bear market matters more than its size when you are estimating how long your wait will be.
The GFC was a financial-system and housing crisis, not a broad equity overvaluation. Once credit markets stabilised and the Federal Reserve’s policy backstops (near-zero interest rates and large-scale asset purchases) took hold, equities could recover more rapidly because they had not been fundamentally mispriced the way tech stocks were in 2000.
How reinvesting dividends has consistently shortened the wait
The mechanism is straightforward: during the drawdown and early recovery, dividends buy more shares at lower prices. Those extra shares then fully participate in the eventual rebound, accelerating the path back to breakeven.
This is not a historical coincidence. It is arithmetic. The longer and deeper the bear market, and the higher the dividend yield during the downturn, the greater the benefit.
The price index only tells part of the story, because total return, which folds in dividends received and reinvested, is the only accurate measure of how quickly a portfolio actually recovered its prior value after a drawdown.
| Bear Market | Price-Only Recovery | With Dividends Reinvested | Time Saved |
|---|---|---|---|
| 1929-32 | ~25 years | ~15 years | ~10 years |
| 1968-70 | ~3.5-4 years | ~2.5 years | ~1 year |
| 1973-74 | ~7-8 years | ~4-5 years | ~3 years |
| 2000-02 | ~7 years | ~6 years | ~1 year |
| 2007-09 | ~5.5 years | ~4.5 years | ~1 year |
In the most extreme case, the 1929 crash, dividend reinvestment alone compressed recovery by approximately 10 years.
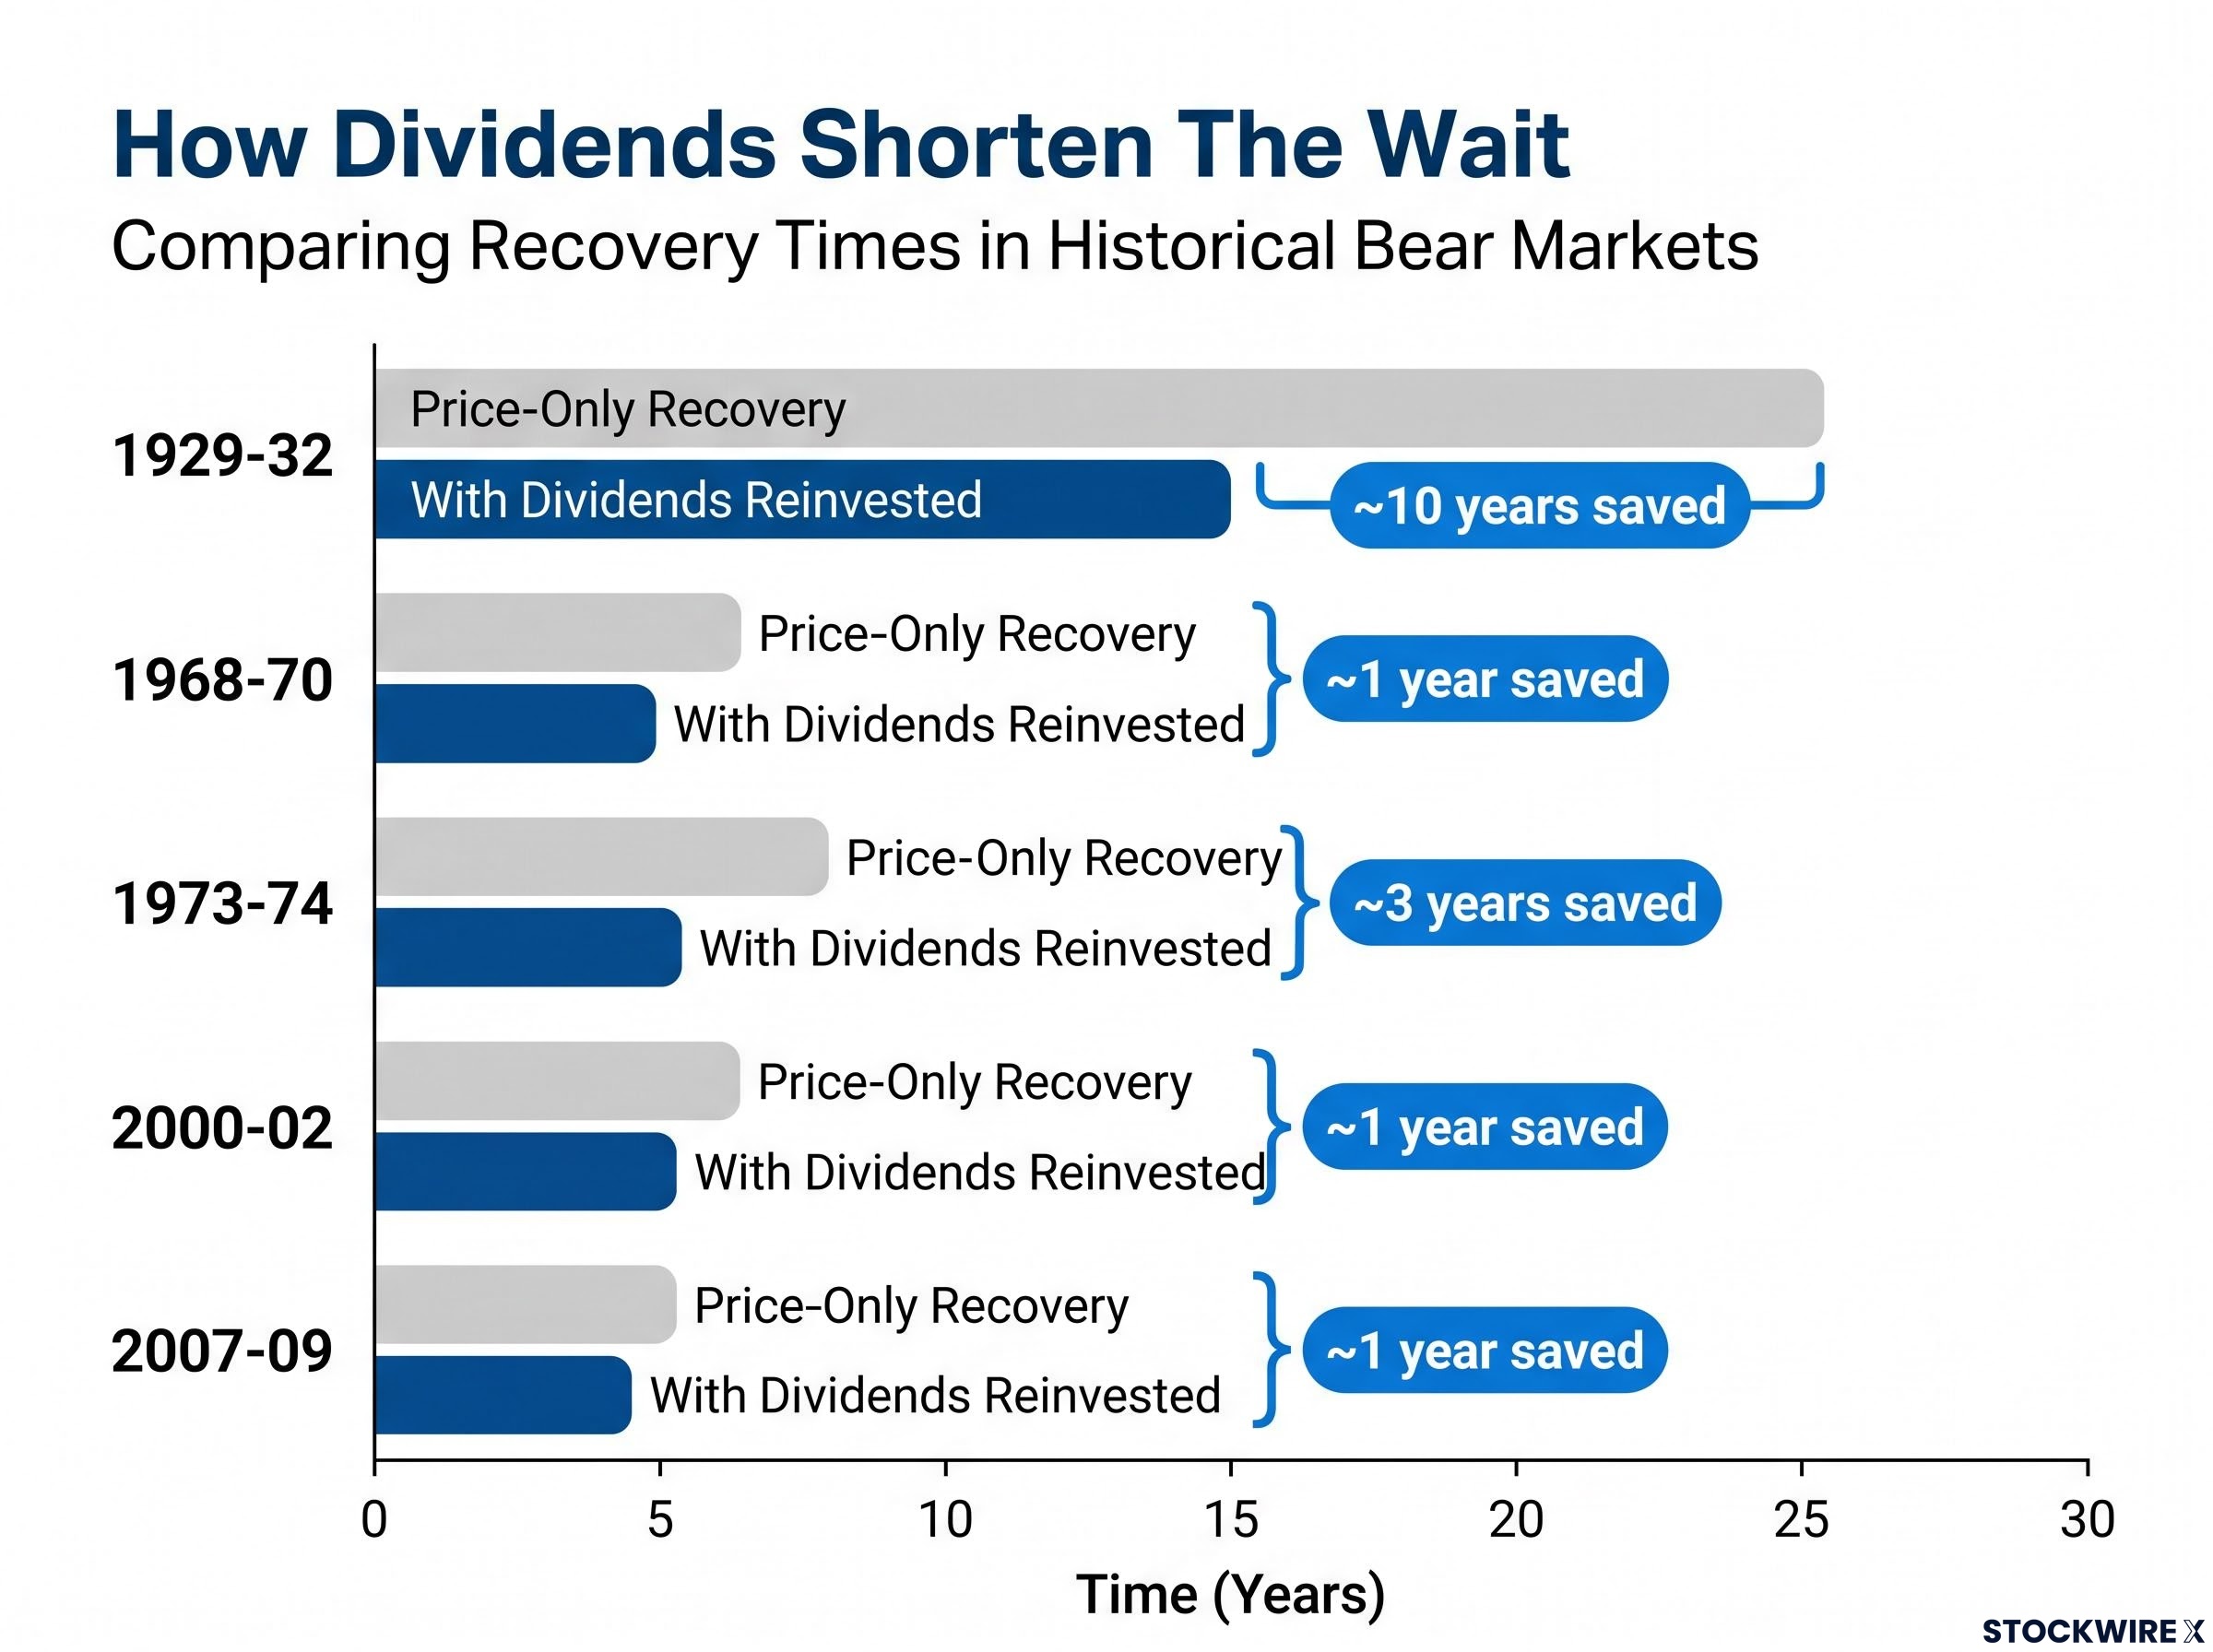
Among the episodes in the table, the dot-com period stands out as the one where reinvesting dividends made the least difference, cutting only around a year from the recovery timeline. The primary reason is that technology-heavy index constituents at the time tended to retain earnings rather than distribute them, which kept index-wide dividend yields unusually low and limited the share-accumulation benefit throughout the drawdown and rebound.
If your portfolio holds dividend-paying equities and you reinvest those dividends during a downturn, history suggests you are actively shortening your own recovery timeline in a way that simply watching the price index will not show you. The share count you accumulate at depressed prices is doing work that only becomes visible when the rebound arrives.
What the historical data actually tells you about your own timeline
Historical recovery timelines are necessary context, but they are not a personal forecast. Your recovery from any bear market depends on whether you sold during the drawdown, whether you reinvested dividends, and whether you had to take withdrawals while prices were depressed.
The gap between the index’s experience and an individual investor’s experience is determined almost entirely by behaviour and liquidity management during the downturn, not by market mechanics alone. Here is how the data applies depending on where you sit:
- Long-horizon investors (20+ years to retirement): Excluding the 1929 crash, every modern U.S. bear market has returned to prior highs within about 3-8 years on a price-only basis. If you are in your 20s, 30s, or early 40s, history suggests that staying invested and reinvesting dividends has been sufficient to ride out even severe post-Depression downturns.
- Pre-retirees (within 5-10 years of retirement): Severe bears have repeatedly required 5-8 years of price-only recovery. A major bear market at age 57 could still be working through recovery at 65. The historical record supports gradually reducing risk and building more stable asset allocations as retirement approaches, because the runway to recover shortens as the timeline compresses.
- Retirees drawing from portfolios: Shares sold at depressed prices cannot participate in the eventual rebound. This is sequence-of-returns risk, and it means the index-level recovery numbers do not translate directly to your personal experience if you are actively withdrawing. Maintaining a cash or bond buffer covering several years of spending is the standard mechanism for reducing forced equity sales during drawdowns.
The cost of selling at the bottom
The biggest behavioural risk identified in the historical data is selling at or near the bottom, or being forced to sell due to lack of liquidity. An investor who sold during the March 2009 low and waited for “confirmation” before re-entering missed a significant portion of the recovery rally, and that behavioural cost compounds across the full recovery period.
Selling at the bottom, or being forced into it by insufficient liquidity, is the single most consequential behavioural error in the historical record, because it converts a temporary paper loss into a permanent realised loss that the eventual index recovery cannot undo.
This risk is not hypothetical. Fund-flow data consistently shows net retail outflows at or near market bottoms, confirming that many investors realise the loss rather than the recovery. Your recovery timeline is the index’s recovery timeline only if you are still holding when the recovery arrives.
Reading the historical record with the right expectations
Bear market recovery time is not random. It is structured by three factors that, taken together, explain the full range of historical outcomes:
- The cause of the decline: Valuation-driven bears (dot-com) set a slower clock than financial-system shocks (GFC), because overvaluation requires years of earnings growth to absorb, while credit crises can be addressed by aggressive policy intervention.
Valuation-driven bears set a slower recovery clock because they require years of real earnings growth to absorb the excess, a dynamic visible in the dot-com bust where price-to-earnings multiples had reached levels that no policy intervention could compress quickly.
- The policy response: The speed and scale of central bank and fiscal intervention have materially influenced every modern recovery. The absence of such tools in 1929 is precisely what made that episode an outlier.
- Investor behaviour during the drawdown: Staying invested, reinvesting dividends, and maintaining enough liquidity to avoid forced selling are the three variables most consistently associated with experiencing the index-level recovery rather than a worse personal outcome.
For most modern bear markets, 2-5 years from peak to prior high has been the realistic planning range for investors who stayed invested and reinvested dividends. That range covers the majority of postwar U.S. bear markets.
The full historical range runs from under 6 months to approximately 25 years, with the practical planning range for post-Depression bears at 2-8 years price-only. Dividend reinvestment has compressed recoveries by 1-10 years depending on bear market depth and prevailing yields.
The single number that matters most is not the historical average but the range, because the range tells you which scenarios your portfolio and your behaviour need to be prepared to survive. The variables you cannot control, the cause of the next decline and the policy response, will set the clock. The variable you can control, whether you stay invested, maintain liquidity, and keep reinvesting income, determines whether you experience that clock or something worse.
This article is for informational purposes only and should not be considered financial advice. Investors should conduct their own research and consult with financial professionals before making investment decisions. Past performance does not guarantee future results. Financial projections are subject to market conditions and various risk factors.