The DXY recorded back-to-back daily advances heading into Tuesday, 25 August 2026, with defensive demand from intensifying geopolitical risk providing the fuel for each session’s gain.
That contradiction is the story this week. A packed event calendar, including Fed Governor Barkin remarks, ADP employment data, and Durable Goods orders, could tip the balance in either direction. The reader tracking the US Dollar forecast right now is walking into a market where the fundamental case and the chart case are telling opposite things, and the scheduled risk events ahead will stress-test both.
Here is what the conflicting signals actually mean for how you read the Dollar this week, which price levels matter, and a specific framework for deciding when the evidence favours action over patience.
What is driving the Dollar higher when the chart says it should not be
The catalyst is geopolitical, not economic. Washington moved to widen the reach of secondary sanctions, with new measures covering a broader set of entities found to be doing business with Iran, a development that introduced fresh uncertainty into international financial flows. Then Treasury Secretary Scott Bessent sharpened the threat.
The Iran sector sanctions unveiled on 24 August designated digital assets, technology, gold, aviation, and shipping as sanctionable, a scope that exposed global firms to compliance risk without requiring a US nexus and introduced the systemic uncertainty that drove the defensive Dollar positioning described above.
Bessent warned that a major financial institution could face enforcement action, and explicitly did not exclude Chinese entities from the scope of potential sanctions.
That combination raised perceived tail risk across global capital markets. The safe-haven mechanism is straightforward: when investors fear disruption to cross-border financial flows, they rotate into the most liquid reserve currency as a hedge. This is not a bet on US growth or a repricing of rate expectations. It is reactive, headline-driven demand for the world’s most accessible store of liquidity.
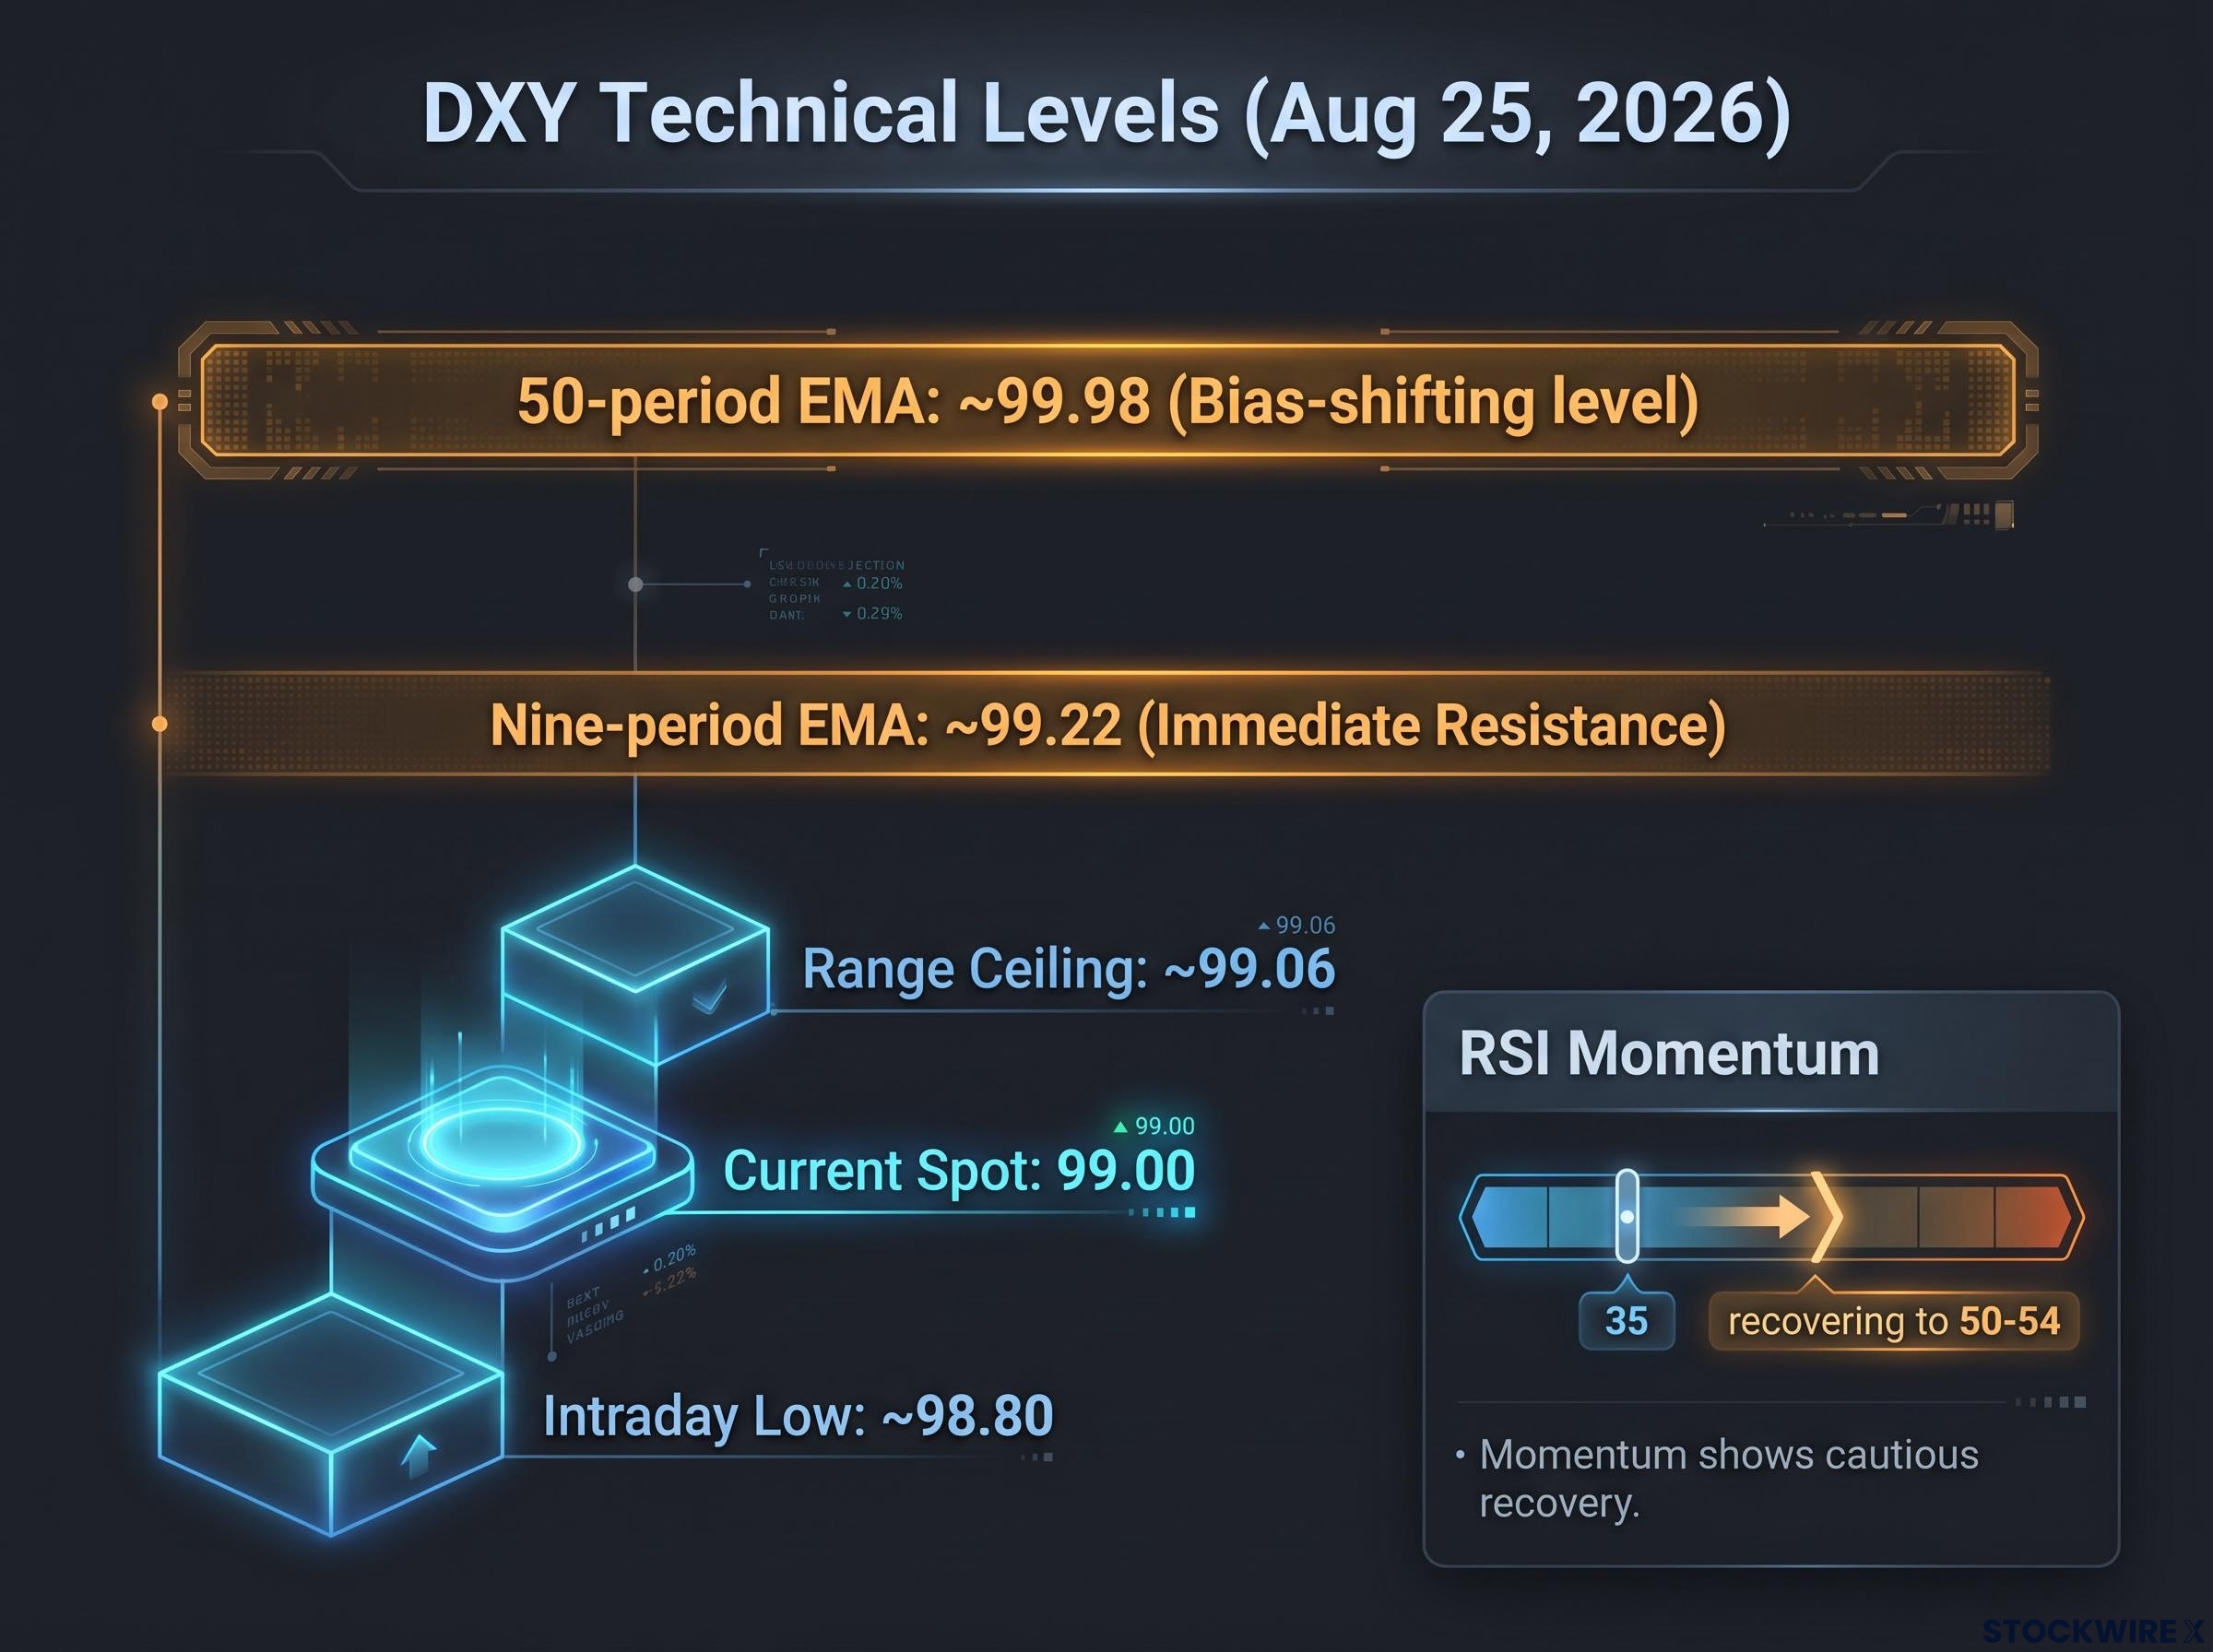
The DXY traded near 99.00 during the Asian session on Tuesday, with recent intraday ranges spanning approximately 98.80 to 99.06 across providers. Two consecutive up sessions sound like momentum. They are not. They are positioning against a specific fear.
Safe-haven flows driven by geopolitical headlines tend to persist or fade based on a narrow set of conditions:
- Persist when risk escalates further, generating fresh rounds of defensive buying
- Persist when macro fundamentals shift simultaneously in the Dollar’s favour (rate expectations, growth data)
- Fade when headlines are digested without follow-through, and the market reverts to its prevailing technical and macro trend
None of the persistence conditions are clearly in place. The Dollar’s two-session gain reflects fear-driven positioning, not conviction, which means the move is precisely as fragile as the headlines that produced it.
When big ASX news breaks, our subscribers know first
What the technicals are actually saying beneath the safe-haven noise
Strip the geopolitics away and the chart tells a different story. Price is trading below both key Exponential Moving Averages (EMAs), a type of moving average that gives more weight to recent price action than older data. Multiple platforms classify the daily setup as a sell.
The Dollar Index breakdown below 98.80 on 19 August completed a stair-step sequence where every prior support level rotated into overhead resistance, establishing the technical context from which the current safe-haven bounce is operating.
| Level | Approximate Value | Significance | Current Relationship to Spot |
|---|---|---|---|
| Recent intraday low | ~98.80 | Lower bound of recent range | Just below spot |
| Psychological round number | 99.00 | Current spot level | At spot |
| Recent range ceiling | ~99.06 | Upper bound across providers | Slightly above spot |
| Nine-period EMA | ~99.22 | Immediate dynamic resistance | Above spot; not yet tested |
| 50-period EMA | ~99.98 | Medium-term resistance; bias-shifting level | Well above spot |
The nine-period EMA at approximately 99.22 is the first real test for any rally. While price trades below it, this level functions as dynamic resistance, meaning every push higher runs into selling pressure at a mathematically defined ceiling. The 50-period EMA at approximately 99.98 is the medium-term level that must be reclaimed to shift the directional bias from bearish to neutral. Price has not come close.
Moving average signals across multiple platforms register as sell or net bearish. Oscillators are flagged as bearish or improving from oversold, depending on the provider. The pattern is consistent: the chart has not confirmed any fundamental shift upward.
The asymmetry matters. Resistance above spot is well-defined and specific. Support below spot is not. Without a clearly established structural floor beneath current levels, the index carries greater downside vulnerability than the defined resistance levels above might initially imply.
What the RSI reading tells you about momentum, not just price
At the time of analysis, the 14-day Relative Strength Index (RSI), a momentum indicator that measures the speed and magnitude of recent price changes on a scale from 0 to 100, was registering 35, a reading that sat just a short distance above the conventional oversold threshold of 30 and reflected meaningful selling pressure persisting in the market.
As of 25 August 2026, the RSI has subsequently recovered toward the 50-54 range. That recovery sounds constructive. It is not the same as a bullish signal. Moving from 35 to 50-54 means selling pressure has eased, not reversed. The index has not reclaimed the 50 level with conviction or held above it through multiple sessions.
A common misreading is that near-oversold conditions imply an imminent bounce. They do not. They mean the market is not yet at the point where sellers are exhausted and forced mean-reversion kicks in. An RSI that has not reclaimed neutral territory with force, combined with price still trading below both key EMAs, tells you the chart is not confirming the safe-haven story. Acting on the fundamental narrative alone carries real, chart-based risk.
Note: the original FXStreet technical analysis was partially generated with AI assistance, as disclosed by the source.
How to read a market when fundamentals and technicals disagree
When the headline story says buy and the chart says wait, the worst response is to pick a side and commit. The better response is to set conditions that tell you when one side has won.
Safe-haven rallies are tactical by nature. They can push price toward nearby resistance, in this case 99.22 and 99.98, but they stall unless risk keeps escalating or macro and monetary fundamentals shift simultaneously in the same direction. A geopolitical headline can move the Dollar for a session or two. It takes sustained fundamental change to move it for a month.
Safe-haven flows rerouting into gold and European currencies during the Hormuz escalation, rather than into the Dollar, established that the market has begun pricing the Dollar as a cyclical asset rather than a clean crisis hedge, a structural shift that makes the current Iran-driven bid easier to fade once headlines stabilise.
Technicals encode the weight of recent sessions, not today’s headline. Persistent closes below EMAs and an RSI that has not convincingly reclaimed 50 reflect the balance of multiple sessions of trading. A couple of risk-driven up days do not erase that pattern without sustained confirmation across price, momentum, and trend indicators.
The core principle: confirmation is more important than prediction in signal-conflicted markets.
The actionable framework is to define what would confirm each scenario, then watch for the evidence rather than guessing the winner in advance. Confirmation protects you against acting on a false signal.
Three conditions that confirm a genuine bullish shift, in order of importance:
- A sustained daily close above ~99.98 (the 50-period EMA)
- RSI moving toward and holding above 50 across multiple sessions
- Moving average signals beginning to shift from sell toward neutral or buy
Conditions that confirm the bearish posture remains intact:
- Repeated rejection below ~99.22 (the nine-period EMA)
- RSI failing to hold above 50 after recovery attempts
- Moving average signals remaining in sell territory despite headline-driven rallies
You should finish this section knowing exactly what price and indicator conditions would tell you the Dollar’s balance of risk has genuinely shifted. That means you are not reacting to noise. You are responding to evidence.
What the event calendar adds to an already uncertain week
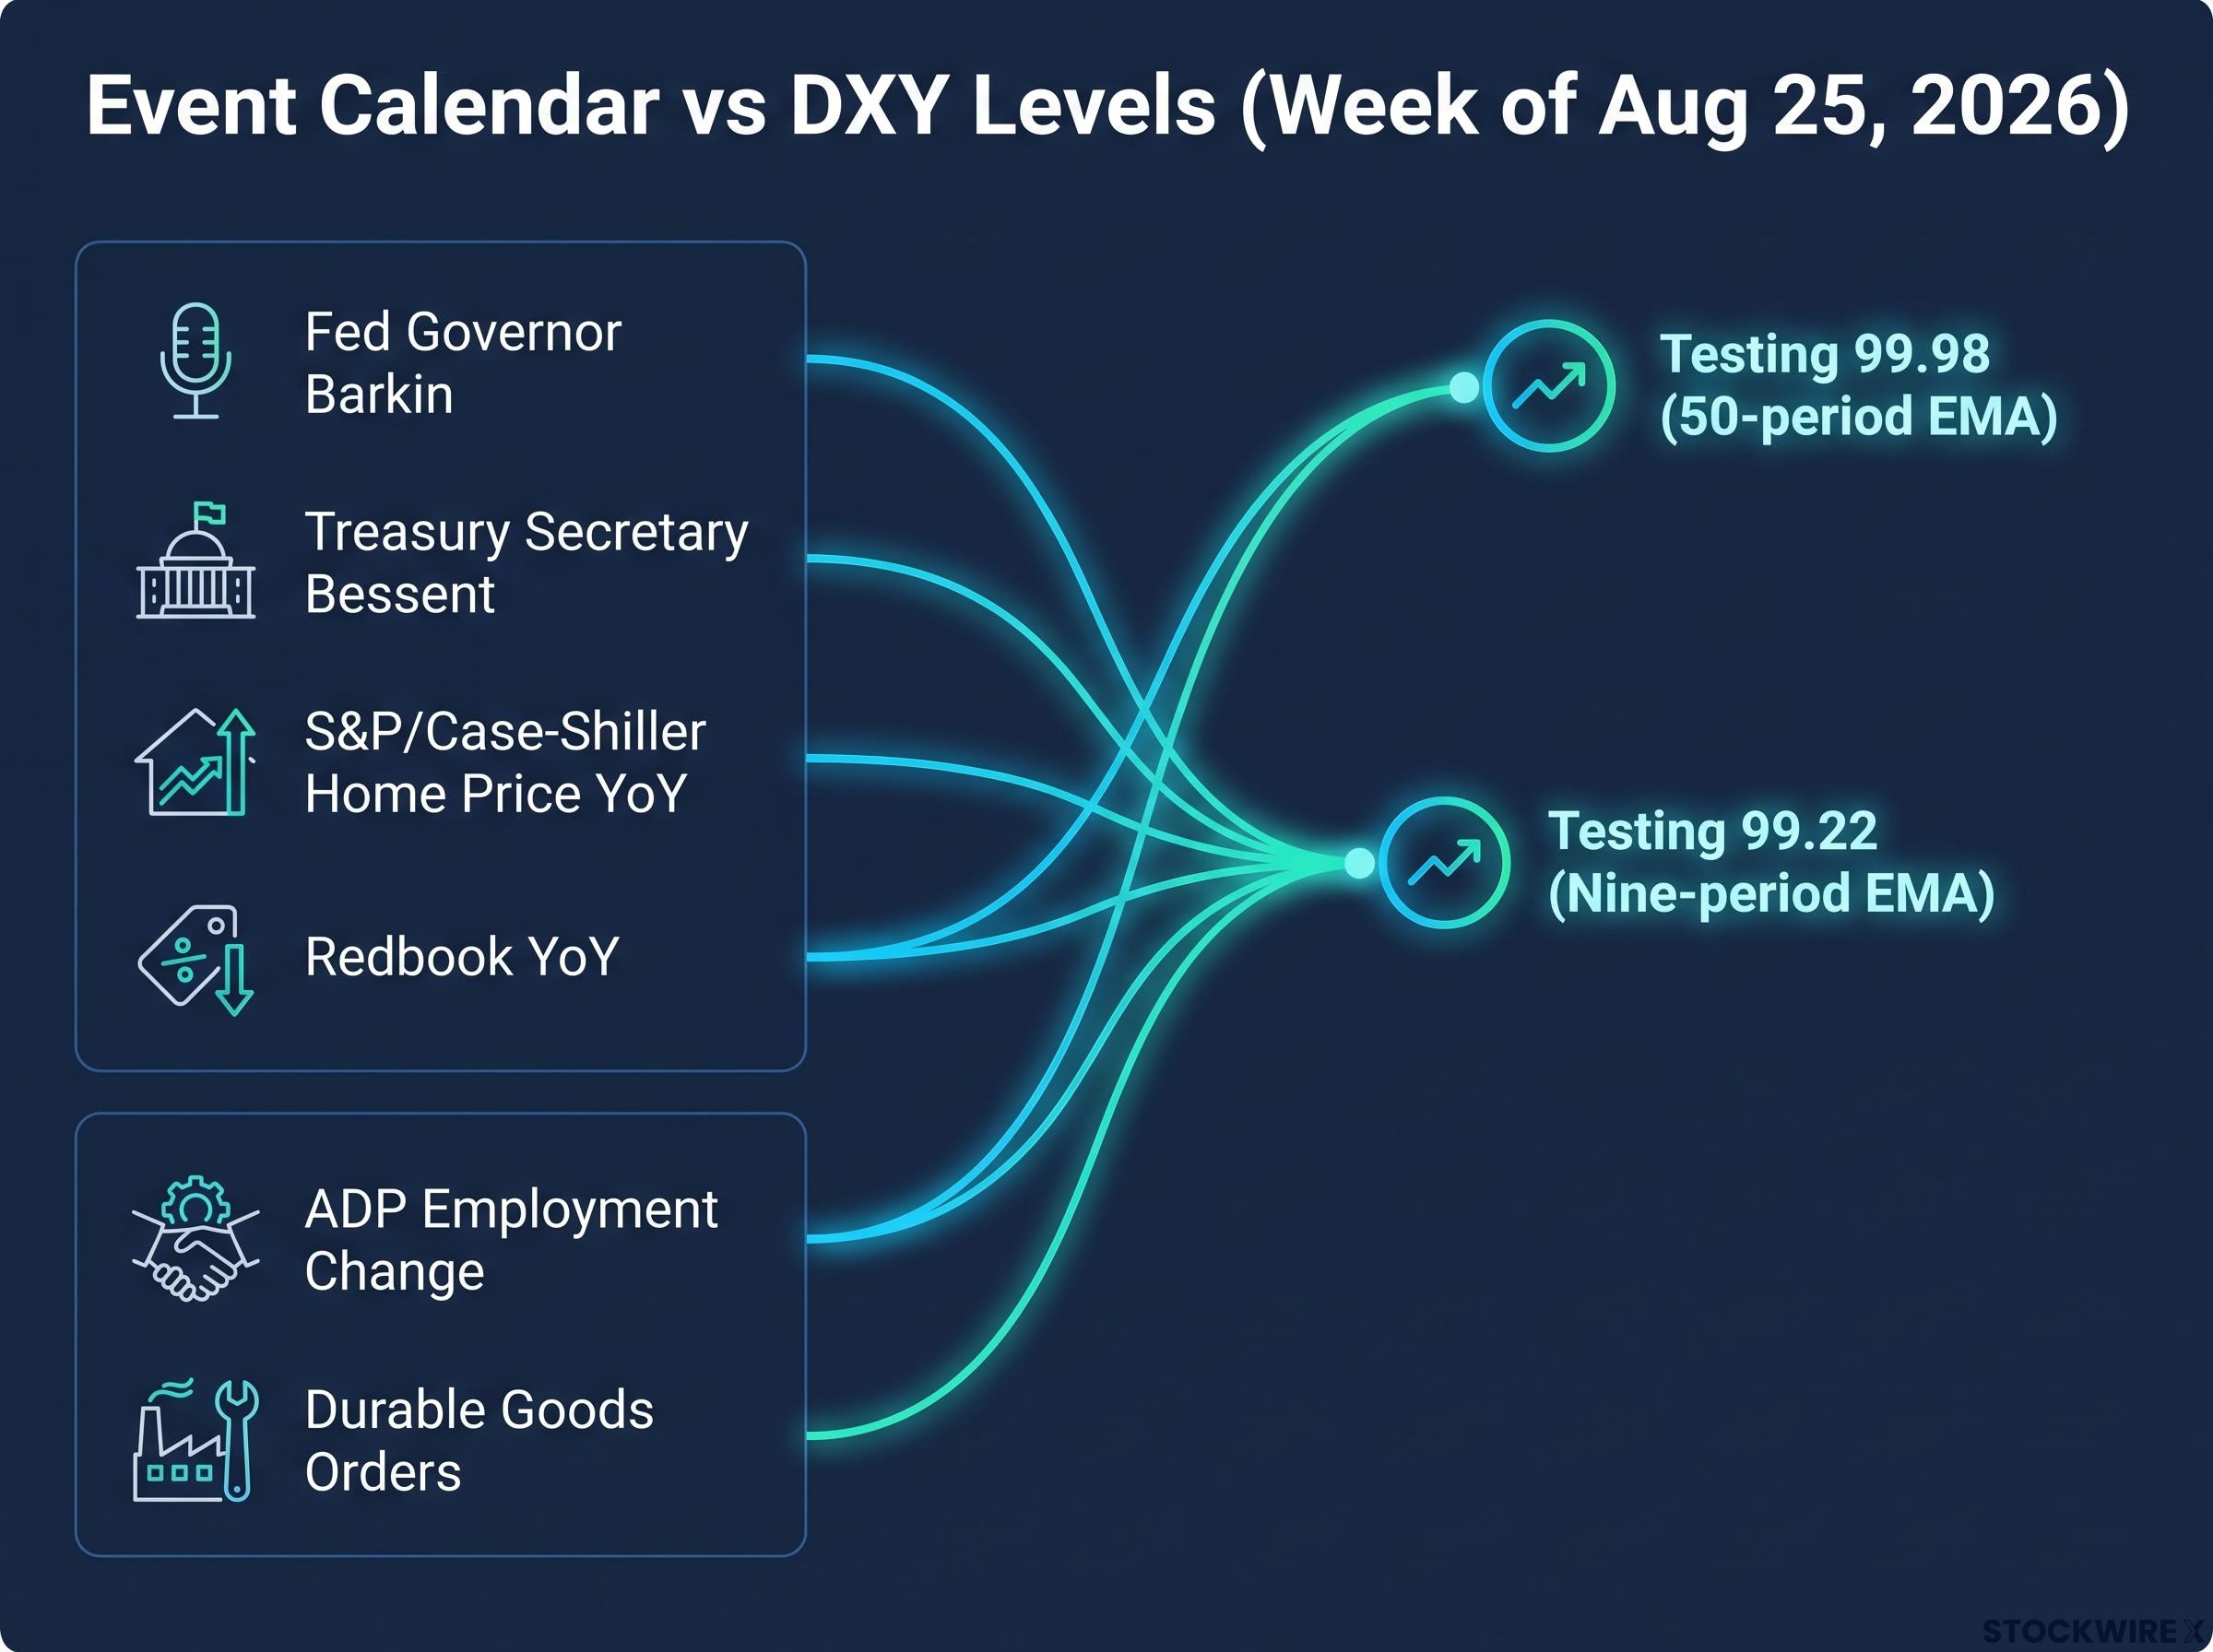
The week of 25 August 2026 is loaded with scheduled releases, each capable of interacting with the existing technical and fundamental setup in different ways.
| Event | Potential Dollar Impact Direction | Key Level Being Tested |
|---|---|---|
| Fed Governor Barkin speech | Rate guidance could support or weaken USD | 99.22 (nine-period EMA resistance) |
| Treasury Secretary Bessent remarks | Further enforcement rhetoric reinforces safe-haven bid | 99.22 (near-term resistance) |
| ADP Employment Change | Strong data supports USD; weak data pressures it | 99.98 (50-period EMA, bias-shifting level) |
| Durable Goods Orders | Beats expectations could test higher resistance | 99.98 (50-period EMA) |
| S&P/Case-Shiller Home Price YoY | Secondary macro signal; limited direct impact | 99.22 (nine-period EMA) |
| Redbook YoY | Consumer spending signal; moderate impact | 99.22 (nine-period EMA) |
The distinction that matters is between releases that could reinforce the safe-haven bid and those that could shift the macro narrative entirely. Further enforcement rhetoric from Bessent keeps the geopolitical risk premium alive and tests near-term resistance at 99.22. ADP employment and Durable Goods, by contrast, speak to the underlying US economy and could push the index toward or away from the bias-shifting 99.98 level depending on whether they beat or miss expectations.
This is a week where patience and level-watching outperform directional conviction:
- Bullish only on confirmed breaks above resistance with improving momentum
- Sceptical of unsustained, headline-driven rallies that fail to close above 99.22
- Prepared for further softness if event risk passes without fresh geopolitical escalation
Knowing which releases could challenge or reinforce each scenario means you can watch specific levels rather than reacting to every data point as it crosses the screen.
Where the Dollar goes from here depends on what breaks first
The Dollar’s near-term path comes down to one question: can geopolitical risk-off flows repeatedly overpower a still-fragile technical chart? The current evidence does not clearly favour either side.
The level-based framework is the practical takeaway:
Foreign Treasury demand erosion from sanctions-driven infrastructure building by China and other major holders adds a structural headwind beneath any cyclical Dollar recovery, complicating the read on whether a breakout above the 50-period EMA would represent genuine trend reversal or a temporary squeeze against deteriorating institutional appetite.
- Bearish default confirmed if the DXY repeatedly rejects below ~99.22, the nine-period EMA. In that scenario, the lack of any established support base beneath current spot pricing leaves the index open to a gradual move lower, and caution on bullish positioning is warranted.
- Bullish bias shift confirmed only on a sustained daily close above ~99.98, the 50-period EMA, accompanied by RSI holding above 50 and moving average signals improving from sell. Without that combination, a rally is noise, not trend.
- Between those levels, the appropriate posture is observation. Treat moves within the 99.00-99.22 range as inconclusive until a daily close resolves the question.
The default directional bias remains sideways-to-lower unless resistance is convincingly broken. In a conflicted market, the edge belongs to those who wait for confirmation over those who position ahead of it. The Dollar this week is precisely the kind of setup where patience has a quantifiable advantage over conviction.
Your surveillance instruction is specific: monitor the daily close relative to 99.22 and 99.98, and treat anything in between as noise rather than signal.
This article is for informational purposes only and should not be considered financial advice. Investors should conduct their own research and consult with financial professionals before making investment decisions. Forward-looking statements regarding price levels and directional bias are speculative and subject to change based on market developments.