Geopolitical tension in the Strait of Hormuz is escalating, and the Dollar is falling. That contradiction, a crisis environment producing Dollar weakness rather than strength, is the kind of signal that forces a reassessment of assumptions most investors have held for years.
The paradox resolves once three structural forces come into focus together. Fed rate hike expectations have collapsed from a near-certainty to roughly one-in-three odds. The first coordinated US-Japan currency intervention since 1998 has imposed an official ceiling on Dollar strength. And safe-haven flows, the capital that historically floods into the greenback during geopolitical stress, are re-routing into gold and European currencies instead. A long-standing assumption, that geopolitical risk reliably drives Dollar demand, is being tested in real time.
Here is the framework for reading Dollar price action through these three forces, and the specific catalysts to watch before the next structural move.
The Dollar at 99.50: what the chart is telling you before anything else
On 17 August, the Dollar Index (DXY) began the session right on its 200-day EMA and was turned back immediately, establishing a bearish tone before a single macro headline had crossed the wire. The index held a range of roughly 99.3-99.5 through the session, with the low printing just above 99.25 and confirming a break of the August range well below the psychologically significant 100.00 handle.
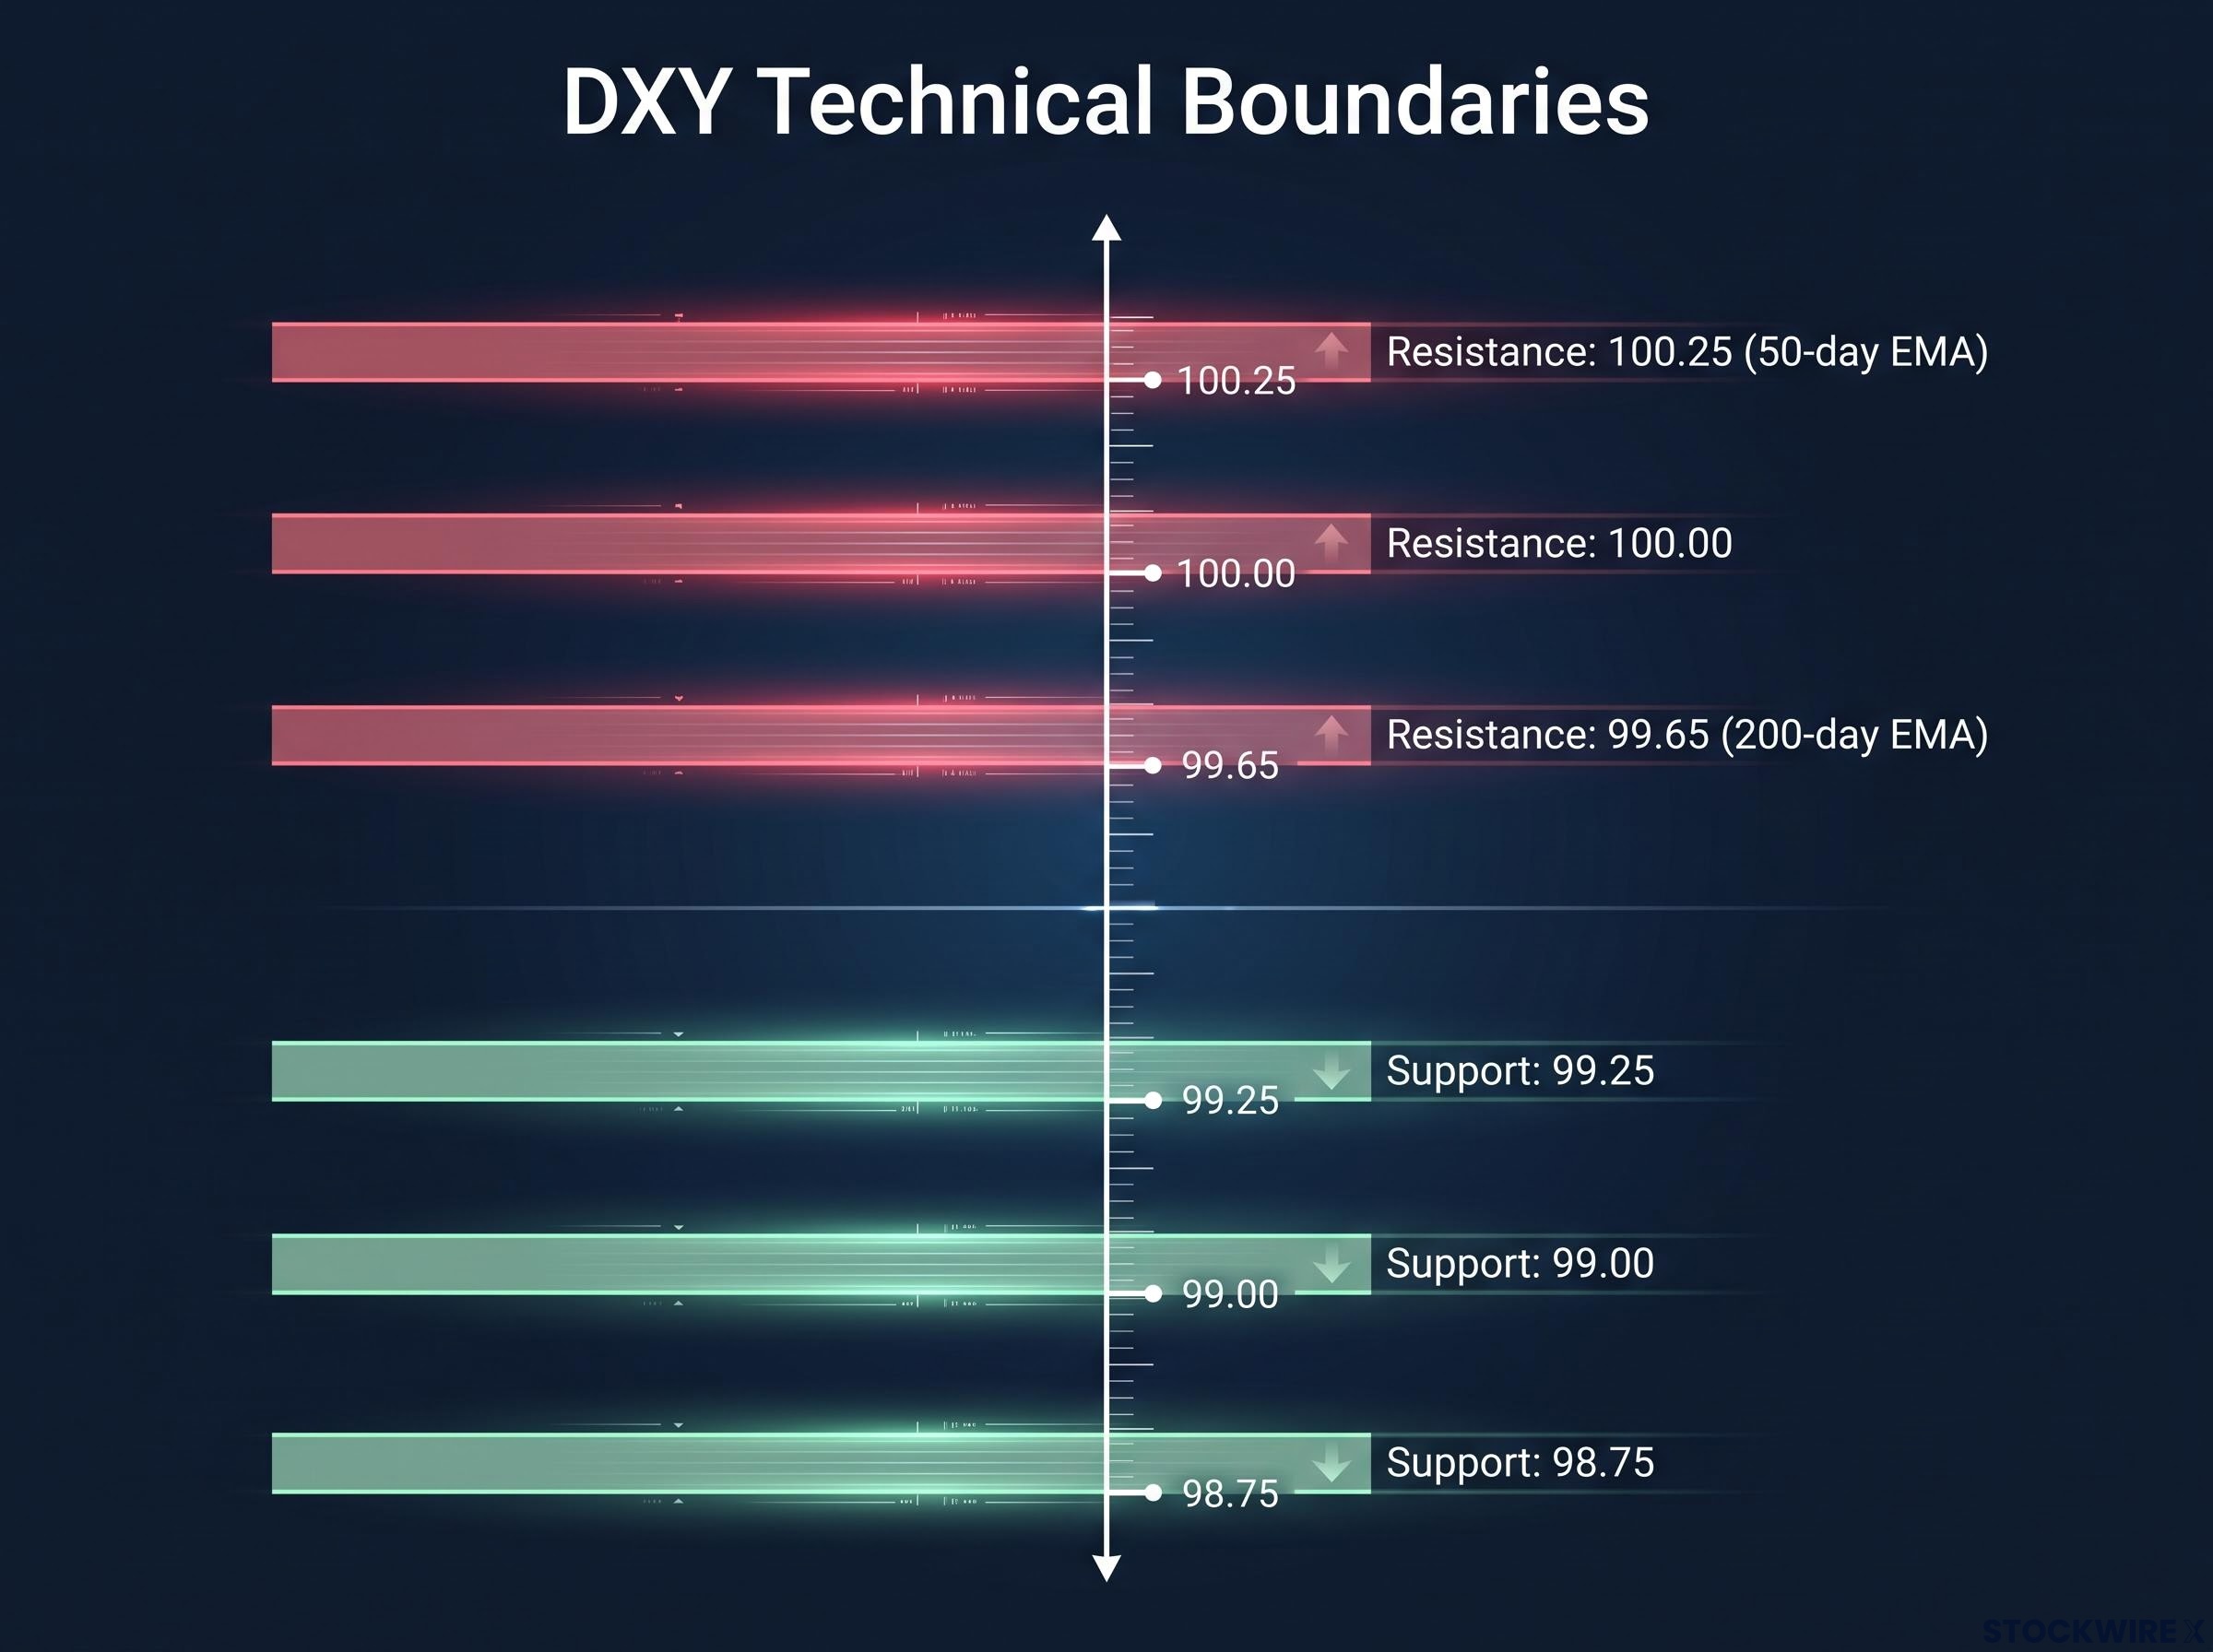
The key technical levels frame the boundaries:
- Immediate resistance: 200-day EMA near 99.65
- Secondary resistance: The 100.00 round number, the line separating a bearish primary trend from any credible stabilisation argument
- Further resistance: Declining 50-day EMA near 100.25
- Key support: 99.25 marks the session floor, with 99.00 the next level below and the 98.75 area providing the final nearby reference point
The daily Stochastic RSI sits at approximately 13, deeply oversold. With the 50-day EMA declining overhead and the 200-day EMA having already rejected price, that reading points to trend continuation rather than an imminent reversal. An oversold indicator carries different implications when the broader structure is already pointing lower.
The DXY technical structure heading into mid-August showed RSI in the high-30s to low-40s and MACD below zero on the daily chart, a configuration where oversold readings amplify rather than reverse the directional bias when the broader trend is already pointing lower.
The structural read: Sustained daily closes below 100.00 keep the primary trend down. Only repeated closes above that level can begin to argue for a durable floor. Until then, the chart’s bias is actively bearish.
Any rally toward 99.70-100.00 is more likely to be used by macro funds to re-establish short positions than to attract new Dollar buyers. The chart itself is setting the ceiling before the Fed or Treasury says a word.
When big ASX news breaks, our subscribers know first
How three soft data prints collapsed the case for a September rate hike
As recently as late July, futures markets assigned a roughly 70-80% probability to at least one 25bp hike by September. A hike was the base case, and that expectation created a clear rate premium supporting the Dollar.
At the 29 July Fed meeting, three policymakers cast dissenting votes in favour of a 25bp increase, which left the impression the full committee was not far from acting. What followed was a sequence of data releases that systematically stripped away that premium.
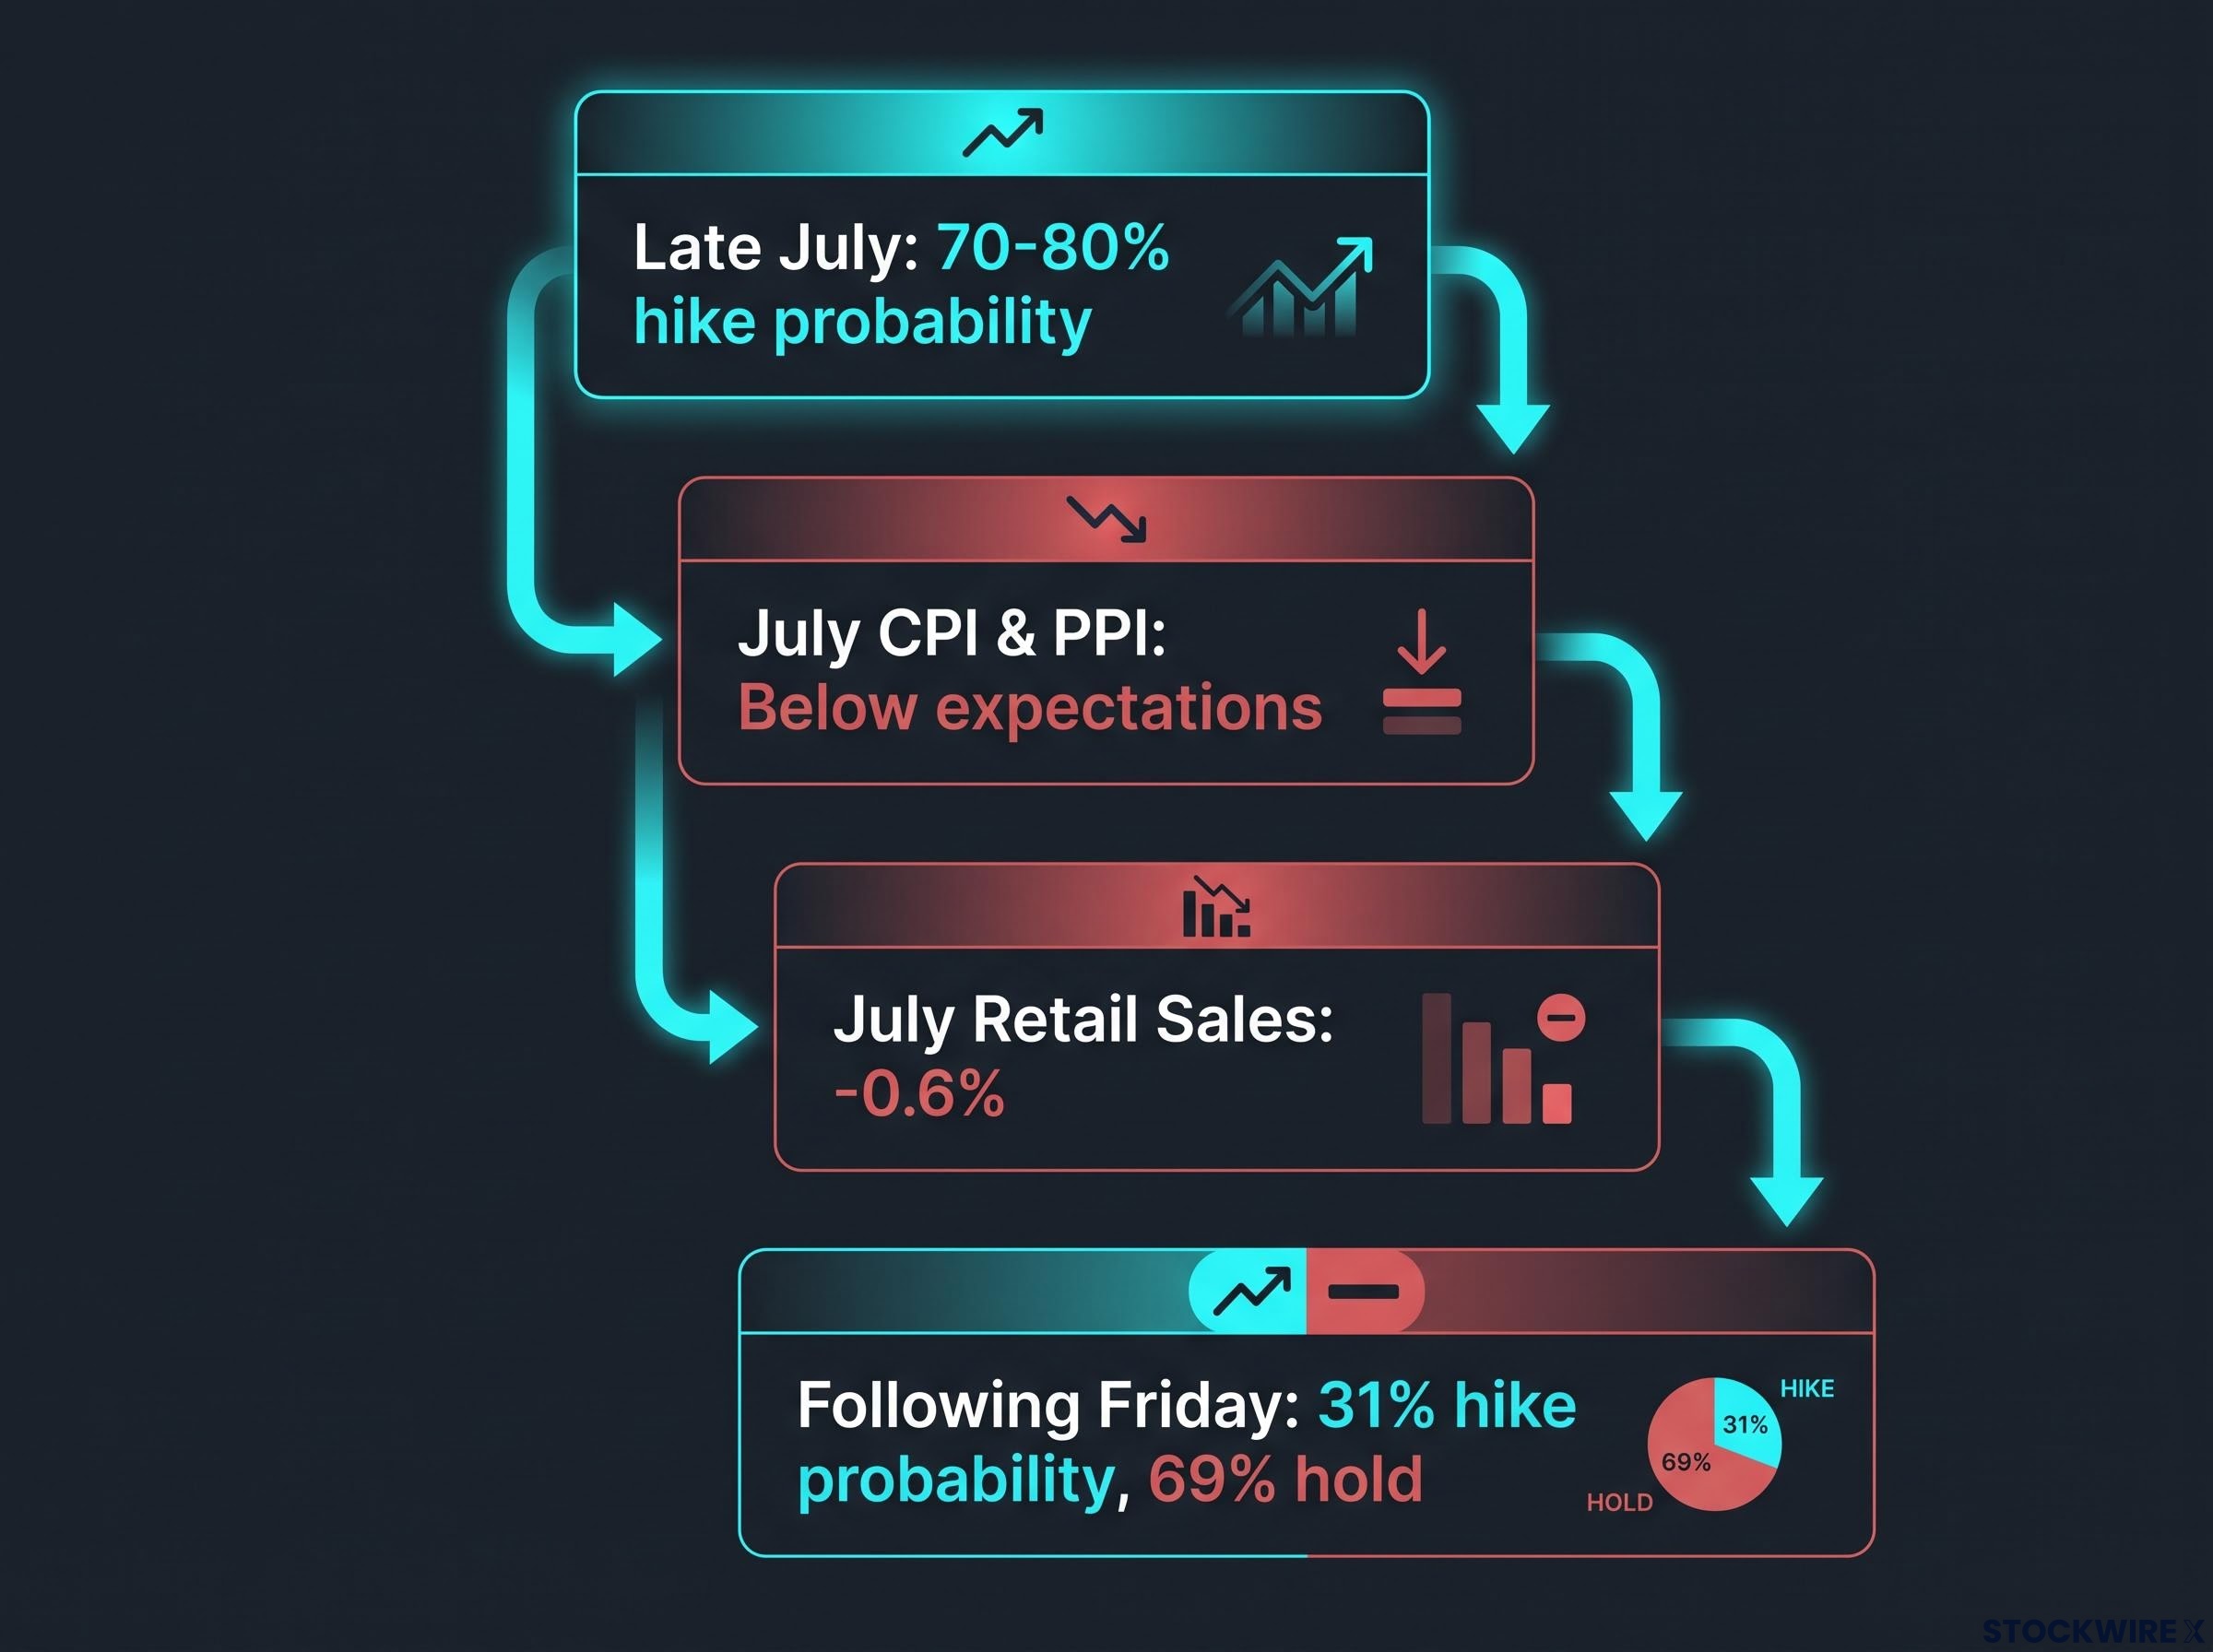
- Soft CPI started the erosion, pulling hike confidence from near-certainty toward a coin flip by 10 August
- Soft PPI compounded the signal, confirming that the inflation undershoot was broad-based rather than noise
- July retail sales contracted by 0.6%, the demand-side confirmation that dismantled what remained of the hike premium
| Data Release | Result | Consensus | Hike Probability Impact |
|---|---|---|---|
| July CPI | Below expectations | Higher | First significant decline from ~70-80% |
| July PPI | Below expectations | Higher | Further compression toward ~50% |
| July Retail Sales | -0.6% | Positive | Collapsed probability to ~31% |
| Empire State Mfg | 20.6 | 11.0 | Largely dismissed by markets |
The Empire State manufacturing index printed at 20.6 versus consensus of 11 and a prior reading of 15.6, the strongest result in over four years. Markets shrugged it off. A single regional survey does not override three national releases.
By the following Friday, September hike probability sat at approximately 31%, with hold probability near 69%.
September hike odds have collapsed to approximately 30% as of mid-August, a complete reversal from the near-certainty that priced the Dollar’s rate premium just weeks earlier, with year-end probability remaining near 90% and confirming that markets have repriced the timing of tightening, not the direction.
The transmission mechanism from soft data to weak Dollar
The sequence works in three steps. Softer inflation and demand data reduce the perceived need for further hikes. Markets then compress the expected US-rest-of-world rate differential, the yield gap that had made the Dollar attractive to international capital. Once that premium looks capped rather than growing, the Dollar shifts from “future high-yield currency” to “hold currency,” becoming vulnerable to any risk-off selling or position unwinding. Rebuilding that premium requires not one strong data print but a consistent series of them, and the data is currently moving in the opposite direction.
What the 1998-style US-Japan intervention actually did to the Dollar’s risk profile
Japan’s authorities moved first on a unilateral basis, purchasing Yen against the Dollar before the operation was subsequently brought into coordination with the US Treasury. The New York Federal Reserve was reportedly involved, selling Euros to finance the joint action, making it the first US-Japan coordinated intervention of this kind since 1998.
The coordinated yen intervention of August 2026 was structurally distinct from prior unilateral Japanese operations: by selling euros rather than Treasuries to fund the yen purchases, the US avoided flooding the bond market with supply at a moment when Washington could least afford an upward yield shock.
The distinction between unilateral and coordinated matters enormously. When US authorities labelled the Yen as substantially undervalued and signalled willingness to intervene again, they effectively declared a ceiling on Dollar strength. That is not a market opinion. It is a policy position backed by a counterparty with near-unlimited firepower.
Following the operation, DXY fell from above 101.50 to sub-100.00 levels, and over the roughly two weeks that have passed since, the index has failed to claw back any meaningful portion of those losses.
The structural consequence: Long-Dollar positions now carry official-seller risk on top of data risk. That is a qualitatively different risk environment from what existed before August.
Any trader considering a Dollar long now faces three embedded conditions:
- Data risk: the standard possibility that incoming economic releases disappoint
- Official-seller risk: the possibility that a government counterparty appears at the upper end of any rally
- The declared ceiling: US authorities have publicly stated the Yen is undervalued and indicated willingness to act again
Once the US itself has signalled willingness to lean against Dollar strength in coordination with a major ally, the rational response for risk-managed institutions is to express geopolitical hedges through gold or European currencies rather than through DXY.
Why gold and European currencies are absorbing the crisis premium that used to go to the Dollar
In a risk-off episode, investors want what might be called a clean safe-haven: an asset that can rally freely without a policymaker standing above the chart constraining it. Gold fits that description. The Dollar, as of August 2025, does not.
During the Strait of Hormuz escalation, the Euro pushed to its highest level in two months while Sterling held near peaks not seen in three months. Gold attracted safe-haven capital alongside select European currencies, all while DXY remained pinned below 100 in spite of the heightened geopolitical backdrop.
The gains in the Euro and Sterling tell you this is not a passive rotation into familiar assets. Markets are actively pricing the Dollar as a constrained asset and seeking alternatives that are not subject to the same official-sector ceiling.
Three forces operating together explain the re-routing:
- The yield story has weakened: hike probability fell from above 70-80% to 31%, removing the rate premium that made the Dollar attractive to international capital
- Official-seller risk has been established: coordinated intervention placed a policy ceiling on Dollar strength, meaning rallies carry the risk of encountering a government seller
- The chart confirms both forces: DXY is below 100, rejected at the 200-day EMA, with rallies being sold rather than extended
Cyclical asset, not pure safe-haven: the repricing in plain terms
When the Dollar behaves as a safe-haven, it rises during global stress because capital flows into US assets for protection, regardless of what US economic data looks like. When it behaves as a cyclical asset, its direction is driven primarily by US data and domestic policy expectations.
The difference shows up in moments like this. Strait of Hormuz tensions escalate, and a safe-haven Dollar would rise. A cyclical Dollar, priced on a weakening rate outlook and constrained by intervention risk, falls instead. That is exactly what is happening, and for anyone with currency-sensitive positions, it changes how you interpret Dollar moves during future risk-off episodes.
The scheduled catalysts that could shift the Dollar’s trajectory before September
The analysis so far explains the structural forces. The calendar ahead determines whether those forces intensify or begin to reverse.
| Date | Event | Expectation vs Prior | Dollar Relevance |
|---|---|---|---|
| Tuesday 18 Aug | Housing starts | 1.35M vs prior 1.427M | Further demand softness weighs on hike case |
| Tuesday 18 Aug | Industrial production | 0.3% vs prior 0.1% | Modest beat possible but insufficient alone |
| Wednesday 19 Aug | FOMC minutes | Drafted before soft CPI/retail data | Key detail: how close non-dissenters were to hiking |
| Thursday 21 Aug | Initial jobless claims | 212K vs prior 209K | Labour market softness would compound rate repricing |
| Thursday 21 Aug | Philadelphia Fed survey | 25 vs prior 41.4 | Sharp expected decline; regional signal |
| Friday 22 Aug | Preliminary PMIs | Mfg 53.8 vs 53.9; Services 54.0 vs 54.6 | Real-time gauge of August activity; first post-intervention read |
| 27-29 Aug | Jackson Hole symposium | Fed chair keynote | Last opportunity to reset September expectations |
Wednesday’s release of the FOMC minutes will give markets a sense of how near the non-dissenting members were to joining those who voted for a hike. The practical limitation is that the document was finalised before the weak inflation data and the retail sales miss landed, which substantially reduces its power to shift current rate pricing.
The 22 August preliminary PMI readings are the next most significant scheduled data for resetting rate expectations in real time. Manufacturing is expected at 53.8 (prior 53.9) and services at 54.0 (prior 54.6), both pointing to marginal softening.
The highest-stakes event: The Jackson Hole symposium (27-29 August) places the Fed chair’s keynote approximately 19 days before the September policy decision. It is the last scheduled opportunity to either endorse a hike or signal patience, making it the single event with the potential to resolve the current Dollar ambiguity in either direction more decisively than any data print.
Three conditions that would have to align for a genuine Dollar recovery
The question is not whether the Dollar can bounce. Oversold conditions make short-term rallies possible at any time. The question is what would need to happen for a genuine structural recovery, and whether any of those conditions are close to confirming.
Three conditions need to align simultaneously, not individually:
- Technical confirmation: Repeated daily closes above 100.00, followed by a break and hold above both the 200-day and 50-day EMAs. A single close above 100 is insufficient; the move needs to hold through selling pressure at those levels.
- Rate-premium restoration: CME-tracked September or subsequent hike odds moving decisively back above 60-70%. The current reading of 31% means the gap between where markets are and where they need to be is substantial. Closing that gap requires not one strong data print but a consistent series of them.
- Intervention risk repricing: Clear official communication that coordinated Dollar-capping actions are off the table, or sustained Yen strength that removes the original justification for the ceiling. Without this, any rally approaching prior intervention levels will face institutional resistance.
Option strikes and stop clusters concentrated at the 100 level create a self-amplifying dynamic at that threshold: whichever directional catalyst arrives while price sits there, whether a soft PMI or a hawkish Powell statement, triggers a larger-than-normal move because algorithmic and options-related flow is stacked on both sides of that number.
The asymmetric risk: Any additional weak data pushes hike odds lower from an already suppressed 31% baseline. Strong data, by contrast, must overcome three weeks of repricing before it becomes Dollar-positive. The risk skew tilts toward further Dollar weakness on incoming data.
Right now, none of the three conditions are close to confirming. The rate-premium gap alone requires a significant and sustained data improvement just to return to where markets were treating a hike as the base case.
What changes the Dollar calculus, and what does not
The Dollar is not falling because markets are irrational. It is falling because three structural forces are operating together, and those forces do not resolve on their own.
What matters is distinguishing between events that would genuinely change the calculus and events that would create noise without shifting the structure:
- Signal events: A hawkish Jackson Hole keynote that explicitly reopens the September hike door; official communication rolling back the coordinated intervention stance; a sustained run of strong national data (not single regional beats) that pushes hike probability back above 60%
- Noise events: Short-covering rallies back to 99.70-100.00; single regional manufacturing beats; headline-driven risk-off spikes that produce a brief Dollar bid before selling resumes
The path of least resistance remains sideways-to-lower for DXY, with sub-100 trading and repeated failures at resistance. Until all three conditions align, Dollar rallies are opportunities to reassess exposure rather than signals that the structural headwinds have been resolved.
The September FOMC meeting, informed by Jackson Hole, PMI data, and claims trends, is the next event with the potential to reset all three conditions simultaneously. That is where the structural picture can change. Everything between now and then is positioning.
This article is for informational purposes only and should not be considered financial advice. Investors should conduct their own research and consult with financial professionals before making investment decisions. Past performance does not guarantee future results. Financial projections are subject to market conditions and various risk factors.