NATO members have pledged to lift spending to 5% of GDP by 2035, the strongest defence commitment in a generation. Yet the two main ASX-listed global defence ETFs, VanEck Global Defence ETF (ASX: DFND) and Betashares Global Defence ETF (ASX: ARMR), are both in the red for 2026. If a spending pledge translated straight into fund returns, that would not be happening.
The gap matters now. Northrop Grumman reported its quarterly results yesterday, and US midterm elections fall on 3 November. Year-to-date figures vary by source and calculation date, so this piece uses ranges: DFND sits roughly -8.5% to -14.7%, and ARMR roughly -5.9% to -9.1%.
Here is how to separate the long-term demand case from the short-term pressures on pricing, and how each fund’s geographic mix changes what you are actually exposed to.
Why a pledge is not the same as a profit: the NATO spending gap
The headline numbers look reassuring. NATO data shows European Allies and Canada are spending more, and faster, than at any point in the past decade:
- 2025: spending rose by more than US$90 billion, nearly 20% above 2024
- 2025: collective spending reached about 2.3% of combined GDP, up from 1.4% in 2014
- 2026: NATO projects Europe and Canada at 2.53% of GDP, up from 2.31% in 2025
- 2026: the European Defence Agency projects EU member-state spending at €454 billion, or 2.4% of GDP, a 9% real increase
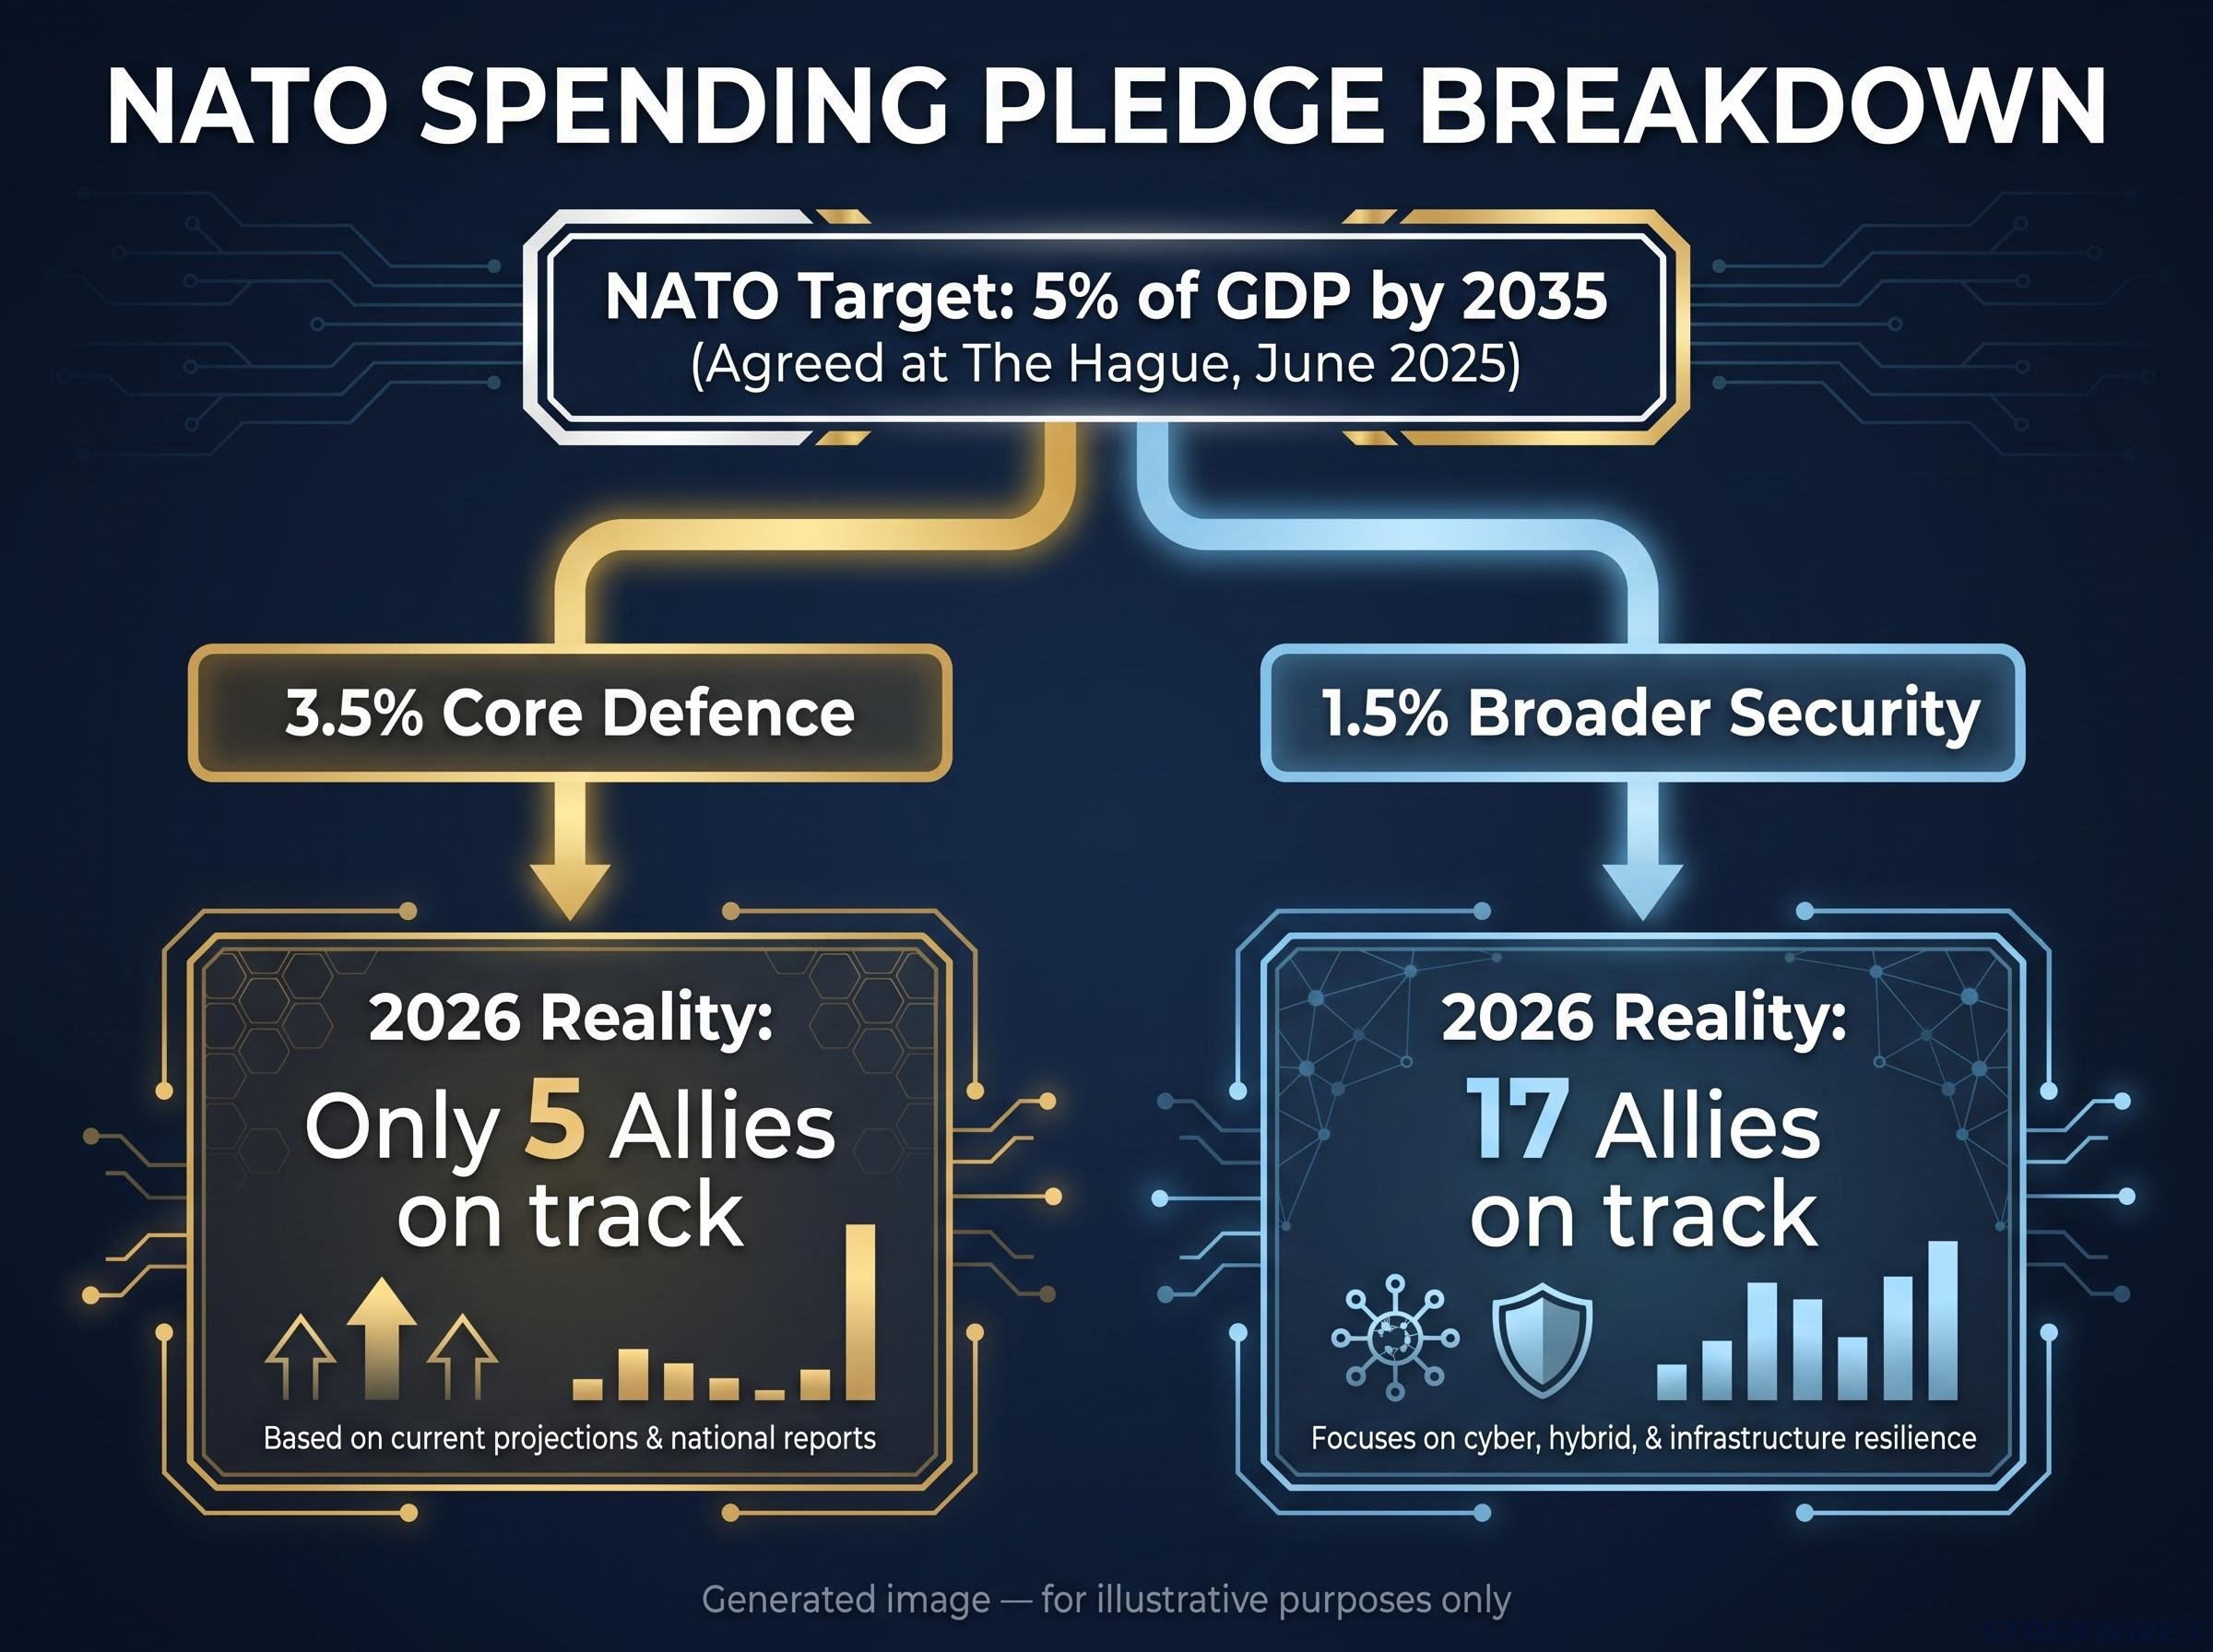
Then the timeline comes into focus. The commitment agreed at The Hague in June 2025 runs to 2035, and each country delivers it through annual national plans. It splits into at least 3.5% for core defence and up to 1.5% for broader security spending.
NATO defence expenditure data shows the Hague commitment divides into 3.5% for core defence and up to 1.5% for broader security, so only part of the headline 5% flows towards the weapons and platforms that fund returns depend on.
The near-term pace is far slower than the headline suggests.
Who is on track in 2026? According to NATO, only five Allies are expected to meet the 3.5% core defence guideline this year, while 17 are expected to meet the 1.5% broader security guideline.
What the 1.5% category actually covers
That 1.5% includes infrastructure, cyber resilience, civil preparedness, innovation and the defence industrial base. A bridge upgrade or a cyber programme counts, but it does not necessarily land in a weapons maker’s order book. Targets can also be reclassified or met late, because parliaments still have to approve the money.
The pledge strengthens only the first link in a long chain: pledge, budget, contract, production, revenue, earnings. If you bought in expecting a faster step-change, the gradual path means the shares may have priced in a pace that budgets are not yet delivering.
When big ASX news breaks, our subscribers know first
Record backlogs, slow conversion: what Northrop Grumman’s results really show
If the NATO numbers describe intent, Northrop’s results describe orders already signed. They were strong. The US contractor reported a record backlog of US$109.6 billion at 30 September 2026, with a book-to-bill ratio of 1.5x. Book-to-bill compares new orders won with revenue billed in the same period, so a reading above 1 means the order book is growing.
Management kept 2026 sales guidance steady and lifted its earnings outlook. Shares rose about 5-6% on the day.
| Metric | Previous | Latest or Timing | Implication |
|---|---|---|---|
| 2026 sales guidance | US$43.75-44.25B | Maintained | Revenue pace unchanged this year |
| 2026 adjusted EPS | US$28.60-29.10 | US$29.35-29.75 | Profitability improving |
| 2027 sales growth | Not stated | 5-7% | Steady, not explosive, growth |
| 2027 free cash flow | Not stated | US$3.3-3.7B | Cash generation supported |
| Backlog conversion | Not stated | 35% in 12 months, 55% over next 24 | Revenue arrives over years |
The conversion schedule is where the story turns.
The timing problem Northrop expects about 35% of its backlog to convert to revenue over the next 12 months, and a further 55% over the following 24 months.
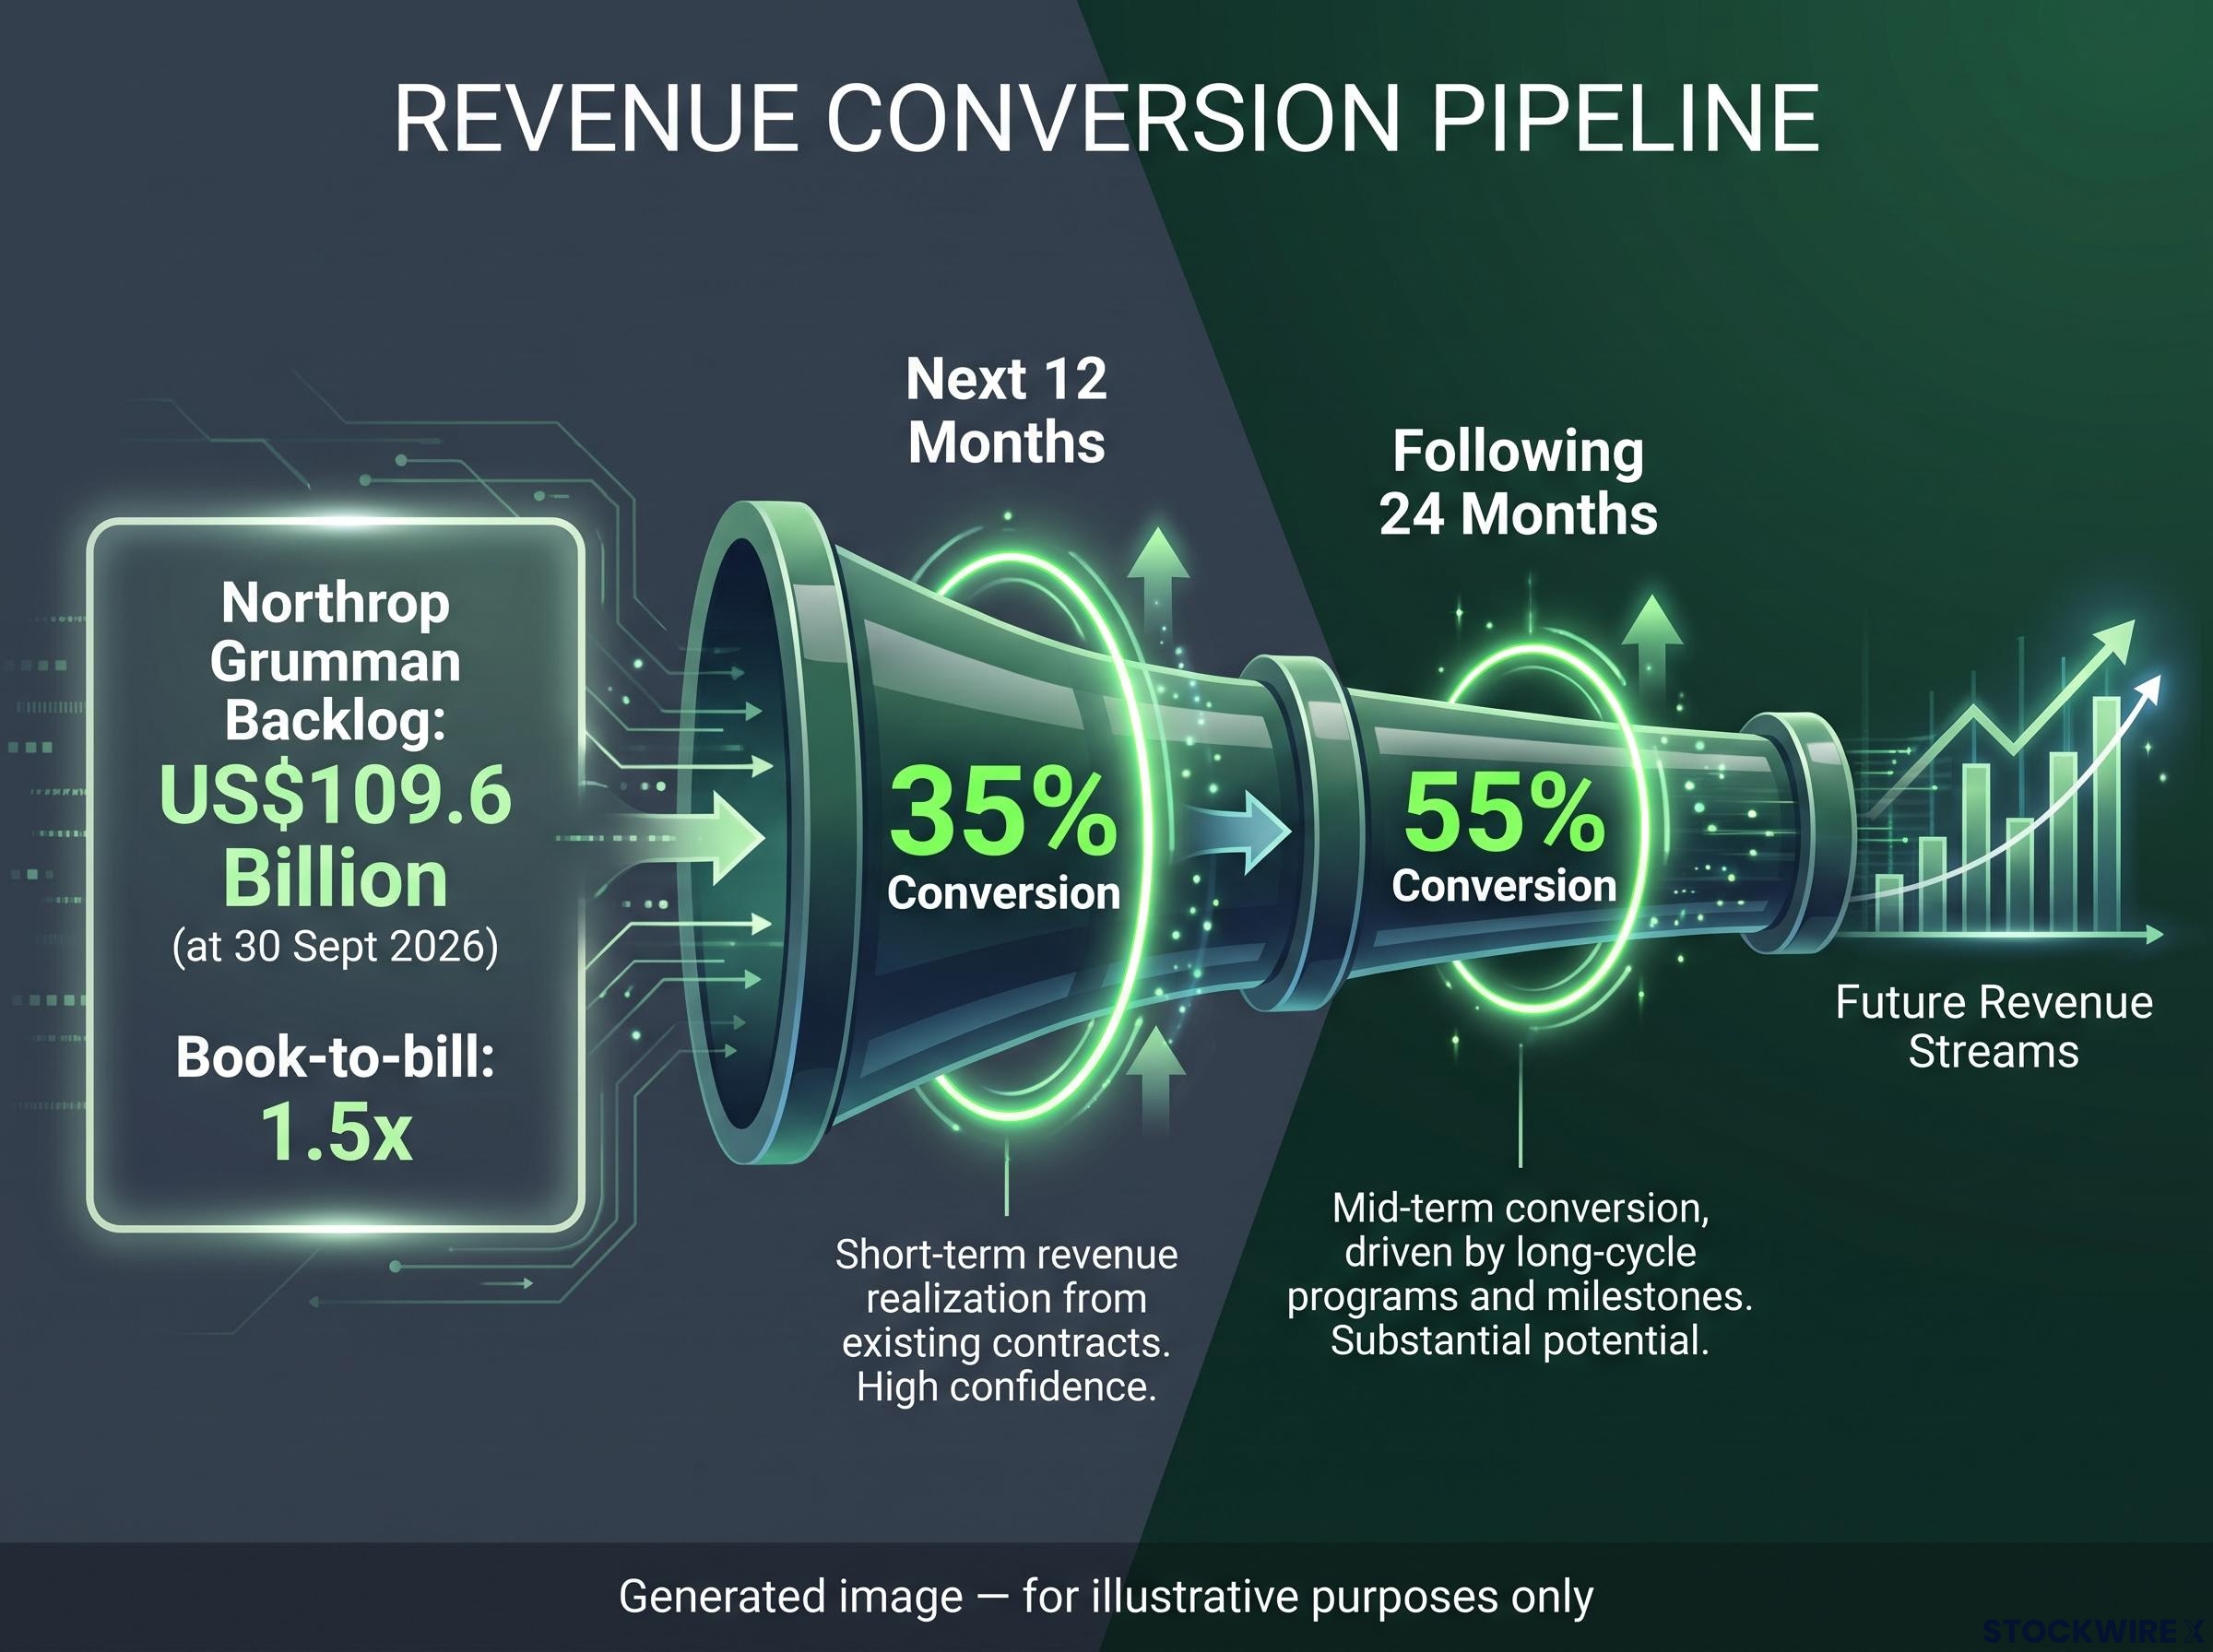
A backlog is a staged pipeline, gated by factory capacity, government appropriations and contract execution. Saxo described the market’s mood in October: investors accept that order books are strong but question when they become profit, and valuations had already priced in much of the future spending. Bernstein noted defence stocks slid from a premium to the S&P 500 earlier in the year to a discount.
A record backlog tells you demand is secure. It does not tell you when earnings arrive, which is why a fund can be fundamentally well supported and still fall while the market waits. Company guidance is subject to change, and past performance does not guarantee future results.
Strong order intake does not guarantee strong profits, and Northrop’s operating margin compression, driven by cost overruns on named programmes, shows how a record backlog can still convert into weaker earnings quality.
Midterms, continuing resolutions and the US budget risk
Conversion depends on Washington releasing the money, and the US calendar is closing in. Bernstein analyst Douglas Harned reported that neither the House nor the Senate has passed an appropriations bill, with the House in recess until after the election.
The sequence from here:
- 3 November 2026: midterm elections. Reuters reports Democrats are widely expected to win the House, with the Senate too close to call.
- Post-election: a lame-duck session, where Congress sits before newly elected members take office, inherits the unfinished budget.
- 11 December 2026: the end date for a possible continuing resolution, a stopgap law that keeps government funded at existing levels.
Harned warned a continuing resolution could hold spending near 2026 levels and delay growth areas such as tactical missiles and interceptors. A Democratic House is a risk to the Administration’s proposed defence expansion, rather than to defence spending in general.
There is a further policy wrinkle. Saxo flagged a January 2026 US executive order that could restrict dividends or buybacks for contractors judged to be underperforming or not prioritising production.
What a lame-duck session could change
The counterpoint is real. With Democrats likely to control appropriations next year, a Republican push to pass funding during the lame-duck window could act as a catalyst.
For you as an Australian holder, US budget timing matters most for the fund with the heaviest US weighting. These dates are the near-term events to watch, not background noise.
Does “buy European” change which ETF you hold? Comparing DFND and ARMR
While Washington stalls, Europe is pushing to keep its defence money closer to home. Three forces drive that shift:
- Strategic autonomy: cutting reliance on US suppliers for weapons, software, ammunition and maintenance in a crisis
- Industrial capacity: the 1.5% NATO category explicitly funds the defence industrial base
- Political conditionality: spending tied to local jobs, technology transfer and supply-chain control
Transatlantic political friction has sharpened these calls. That raises a practical question: what sits inside each fund?
An ETF’s geographic mix is simply the share of its money invested in companies from each country. It decides which governments’ budgets, currencies and politics move your returns.
| Feature | ARMR | DFND |
|---|---|---|
| US weighting | About 62% | About 46.7% |
| Other key exposure | France 10.92%, Germany 8.38% | Europe, Israel, South Korea |
| Top holdings | Palantir 9.07%, Lockheed Martin 8.00%, Safran 7.88% | Palantir 9.34%, RTX 7.93%, Thales 7.24%, Hanwha 6.65%, Saab 6.12% |
| Concentration | Top ten about 66.7% of assets | Broader spread, incl. Elbit 6.04%, Leonardo 5.70% |
| Annual fee | About 0.55% | About 0.65% |
| Year to date (varies by source) | Roughly -5.9% to -9.1% | Roughly -8.5% to -14.7% |
Both funds hold about $217-244 million. One Yahoo Finance reading showed ARMR positive year to date, but it conflicts with issuer and aggregator data and appears inconsistent.
ARMR’s concentration and US tilt tie it closely to American appropriations. DFND’s breadth spreads that risk, yet European sourcing carries its own costs: fragmented markets, duplicated programmes and higher costs with lower initial margins.
The case for US contractors
US firms still win European orders through interoperability, established NATO supply chains and capabilities such as missile defence and command systems. “Buy European” is a tilt, not an exclusion.
If you expect spending to favour European producers, DFND gives more direct exposure. With about half still in US names, though, it is a partial tilt rather than a European play, so check the holdings against your own view. Neither fund removes defence-sector, valuation, currency or geopolitical risk.
For readers wanting to examine the fund’s index rules and sector split, our dedicated guide to ARMR’s holdings shows how the 88% industrials and 12% technology allocation is built.
What the lag changes, and what it does not, for Australian investors
The pledge is real and backlogs are strong. Timing, valuation, US budget risk and slow conversion explain the 2026 lag, which reads more like consolidation after a rally than a broken thesis. Ceasefires or de-escalation could still test the sector, and defence stocks have historically cooled when budgets arrived slower than hoped.
The markers ahead are dated: the 3 November midterms, the 11 December continuing resolution deadline, then the next round of contractor results and European procurement announcements.
Matching a fund to your view comes down to three questions. Do you want concentrated US-prime exposure or a broader geographic spread? How much single-stock concentration can you tolerate? Does a 0.10 percentage point fee gap matter to you?
Investors who see defence as a satellite position rather than a core holding may weigh it against broader international ETFs such as VGS, which charges 0.18% and covers a much wider slice of global markets.
This article is for informational purposes only and should not be considered financial advice. Investors should conduct their own research and consult with financial professionals before making investment decisions. These statements are speculative and subject to change based on market developments and company performance.