
Most retail investors watching EUR/USD are looking at price. The candle moved up, the candle moved down, the trend line held or broke. But the professionals moving that price are building their views from something else entirely: positioning data that shows who is long and who is short before the move happens, macro releases that signal economic momentum weeks ahead, and technical levels that function as conditional risk thresholds rather than fixed lines on a chart.
EUR/USD is the world’s most traded currency pair, representing approximately 21.2% of global FX turnover on a net-net basis, according to the Bank for International Settlements (BIS) April 2025 Triennial Central Bank Survey. With that much capital flowing through a single pair, price does not move by accident. It moves because institutional desks are reading three analytical pillars simultaneously, and those pillars are telling them something the chart alone does not.
Here is the analytical method those desks actually use, applied to the world’s most watched currency pair. You will learn how to read Commitments of Traders (COT) positioning data, interpret Eurozone macro releases in EUR/USD terms, and use technical levels the way professionals do: not as predictions, but as probability statements with explicit conditions attached.
Why EUR/USD is the benchmark for global currency analysis
The BIS survey numbers frame the scale. The US dollar is involved in 89.2% of all FX trades globally. The euro accounts for 28.9% of global turnover. Their pairing, EUR/USD, captures 21.2% of all foreign exchange activity on a net-net basis.
The BIS Triennial Central Bank Survey confirms the scale of dollar dominance directly: the US dollar appears on one side of 89.2% of all trades globally, with the euro accounting for 28.9% of turnover, making their pairing the single largest slice of global FX activity.
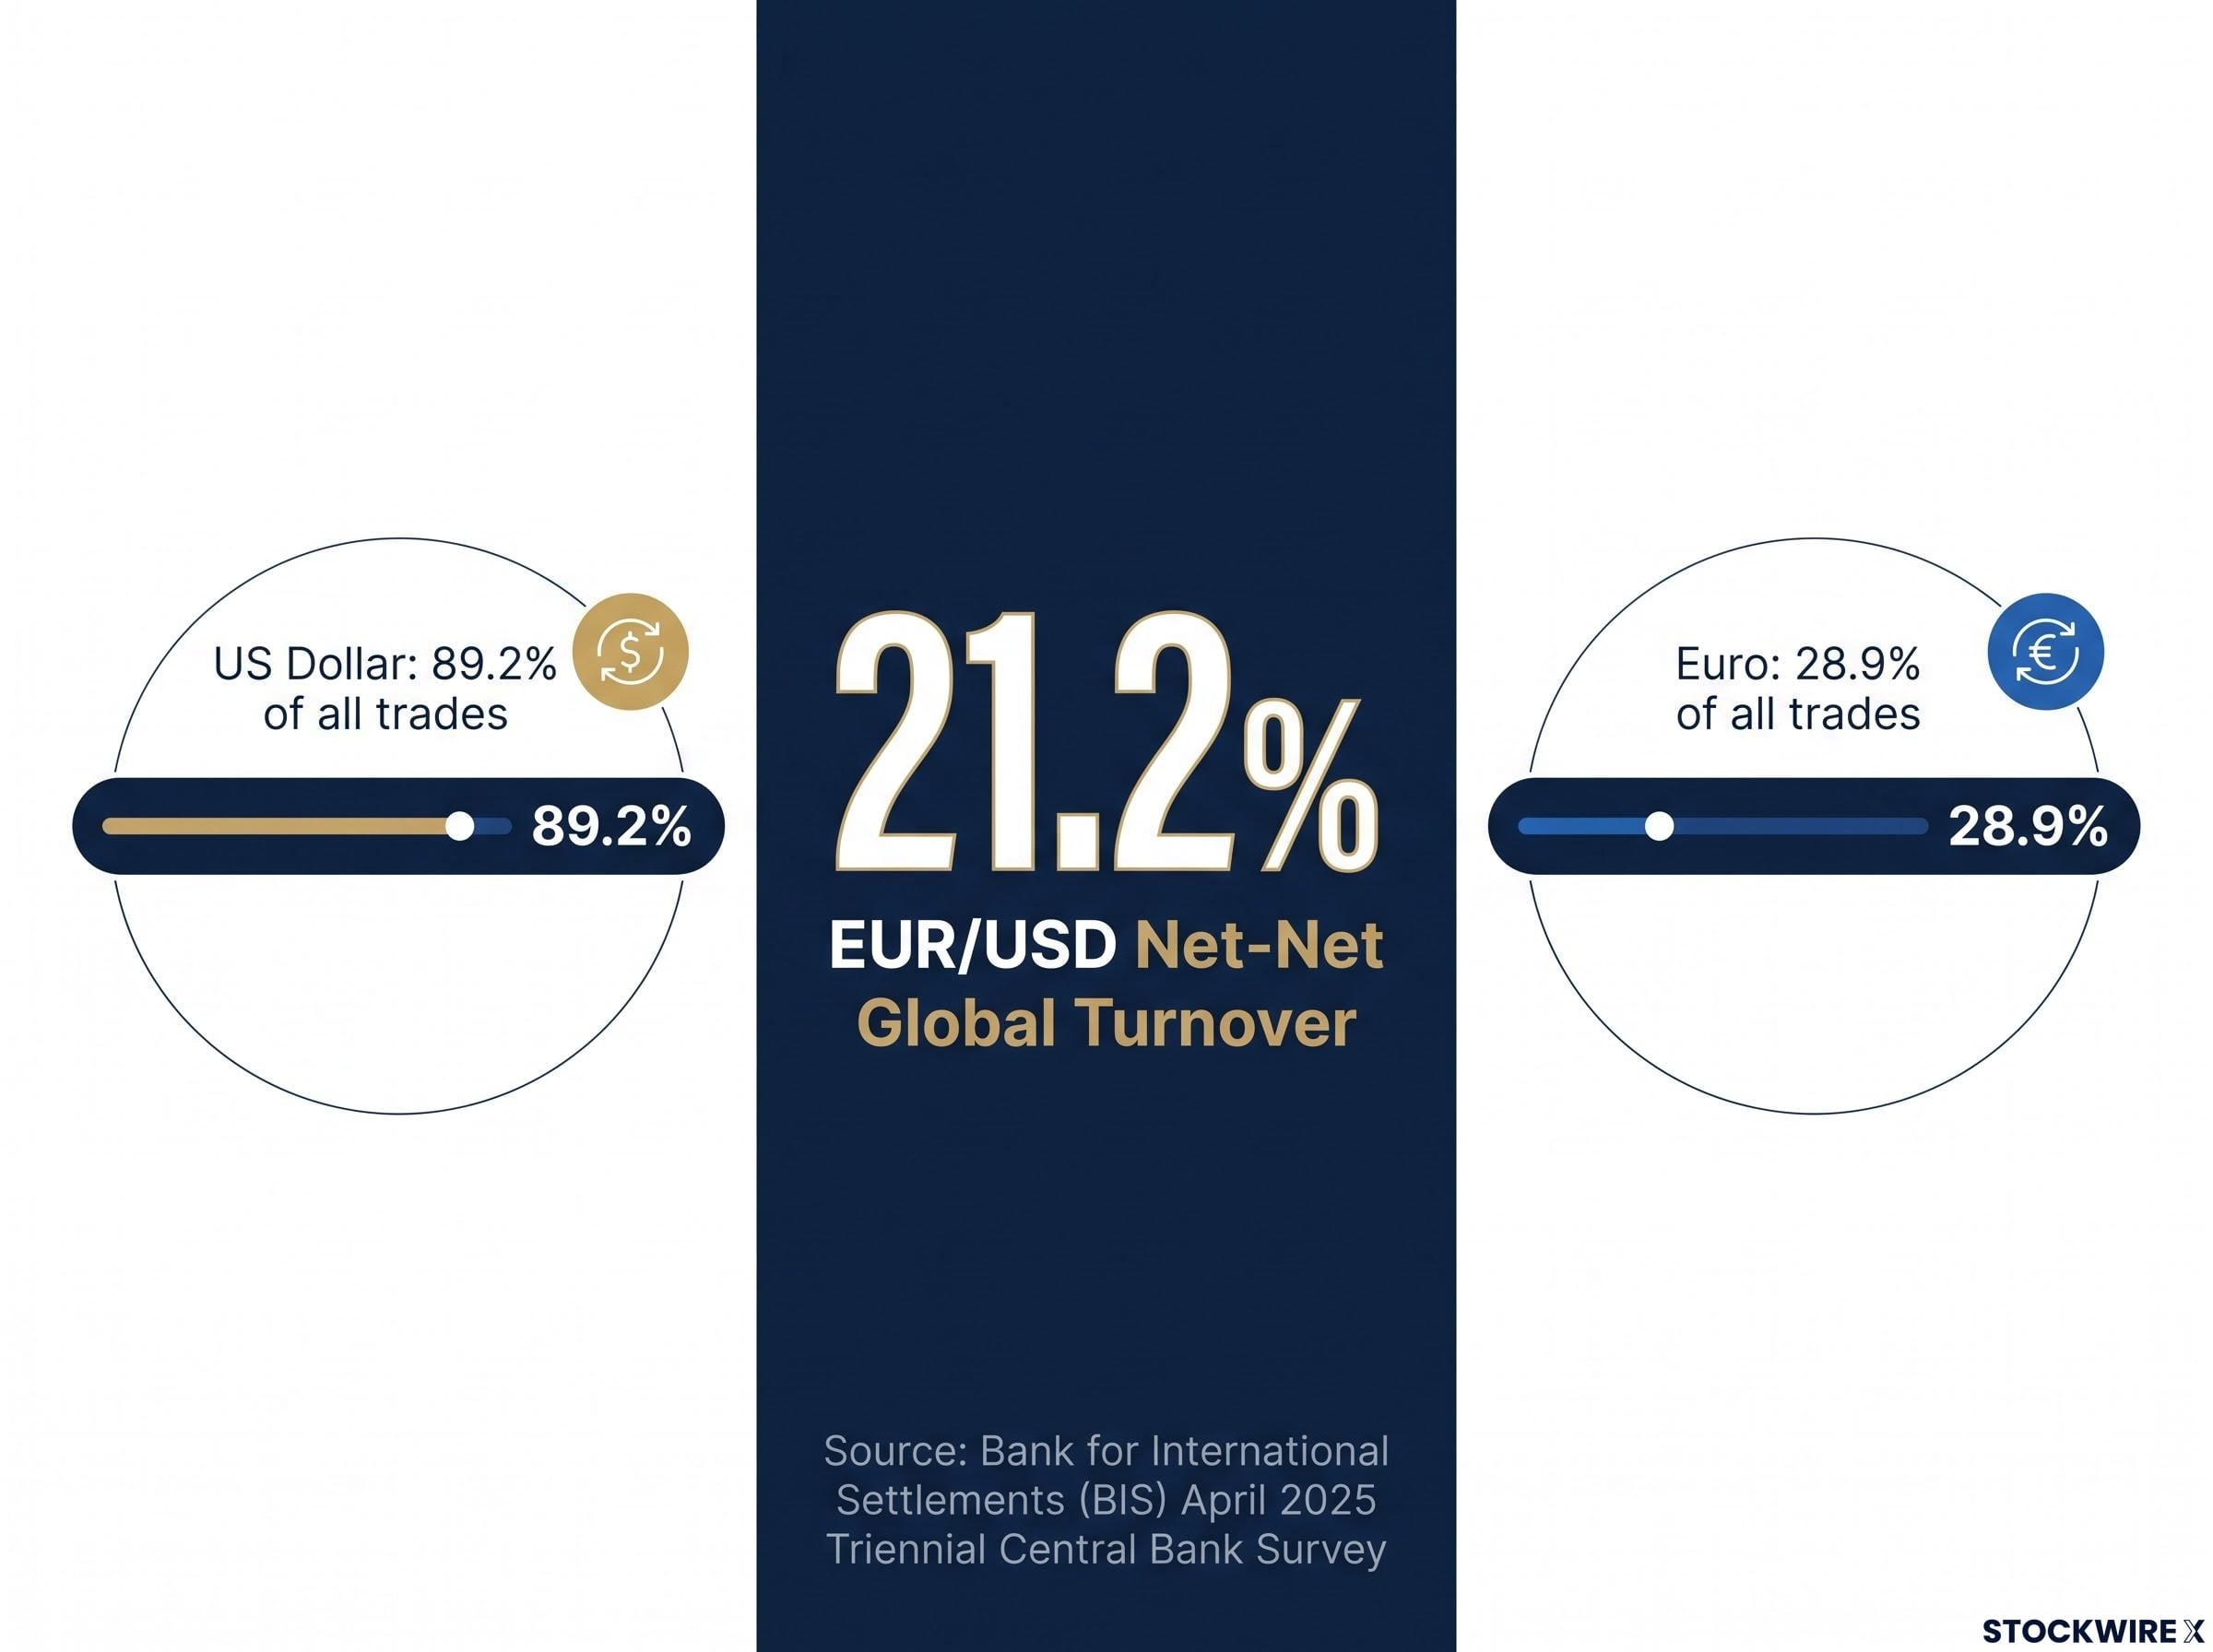
21.2% of all global FX turnover flows through a single currency pair. When you understand how professionals analyse EUR/USD, you are reading the methodology applied to the largest and most liquid market in global finance.
That concentration of volume means EUR/USD is not just a pair; it is a barometer. It reflects three forces simultaneously:
- Relative economic momentum between the Eurozone and the United States
- Central bank policy expectations, specifically whether the European Central Bank (ECB) or the Federal Reserve is expected to move rates more aggressively
- Global risk appetite, because the US dollar functions as the primary safe-haven currency, meaning broad market stress pushes the dollar higher and EUR/USD lower regardless of Eurozone fundamentals
No single indicator captures all three forces at once. This is why professional analysts rarely rely on one signal. Instead, they build their views on a three-pillar framework: futures positioning, macroeconomic indicators, and technical levels. Each pillar reads a different upstream force, and convergence across all three is how institutional desks calibrate conviction.
Euro valuation fundamentals extend well beyond any single release cycle: the ECB’s symmetric inflation mandate, the composition of the Governing Council, and the BTP-Bund spread all shape the structural backdrop against which PMI and Ifo surprises are interpreted.
Understanding how those pillars work, and more importantly how they interact, is not optional knowledge if you are tracking currency markets seriously.
When big ASX news breaks, our subscribers know first
Reading the futures market: what institutional positioning tells you before price moves
The US Commodity Futures Trading Commission (CFTC) publishes a weekly COT report for currency futures. For Euro FX futures on the Chicago Mercantile Exchange (CME), each contract represents EUR 125,000. The report breaks down who holds what by trader category, and two categories matter most for your EUR/USD analysis.
Asset managers are the slow-moving, fundamentals-driven participants. Their positions reflect medium-to-long-term views on Eurozone versus US economic trajectories. Leveraged funds, primarily hedge funds and speculative accounts, move faster. They react to near-term data, narrative shifts, and momentum. When both categories are moving in the same direction, even modestly, analysts treat it as a constructive signal because it shows broad institutional participation across different holding periods.
COT data is collected each Tuesday and released the following Friday. That lag matters, and understanding how to adjust for it is where retail investors gain an edge.
Speculative underweighting and the covering rally mechanism
Speculative underweighting occurs when leveraged funds hold less Euro exposure than the prevailing macro backdrop would suggest. They are not necessarily short; they simply have not positioned for the improving fundamentals that macro data is beginning to confirm.
When conditions then improve further, or EUR/USD starts rising, these underweight speculators must buy Euros to catch up. This is not new bullish conviction. It is position normalisation. The buying pressure from that normalisation amplifies the move independently of any fresh directional view, producing what analysts call a covering rally.
The source analysis illustrates this dynamic with a concrete example. Euro contract purchases were being made by both asset managers and leveraged funds via Chicago futures markets, yet the volumes involved were not especially large. A review of EUR/USD hedging data independently arrived at the same conclusion: speculative participants were carrying a notably light Euro allocation. Compounding this, a sharp EUR/USD rally had taken place after the COT snapshot was taken, which means the reported underweight condition at publication date was almost certainly understating what positioning actually looked like in real time.
That lag-adjusted reading is the insight that matters: when price moves sharply after a COT snapshot, the published positioning data understates the current condition, and the direction of that adjustment becomes part of the signal itself.
You can access COT data for free through the CFTC website. Here is how to apply it practically:
- Track net speculative positioning trends over several weeks, not single data points
- Check whether asset managers and leveraged funds are aligned or moving in opposite directions
- Note when positioning is near historical extremes
- Treat extreme underweight or overweight conditions as risk signals, not automatic trade triggers: extreme shorts plus improving data equals upside risk, while extreme longs plus deteriorating sentiment equals downside risk
How PMI and Ifo data move the Euro: reading macro signals the way analysts do
The second pillar is macroeconomic data, and two releases carry outsized weight for EUR/USD: Purchasing Managers’ Index (PMI) surveys and the German Ifo Business Climate Index.
PMI surveys ask firms whether business conditions improved, worsened, or stayed the same versus the prior month. Responses are compiled into a diffusion index, a single number that summarises the balance of positive versus negative answers.
The PMI neutral level is 50. Readings above 50 indicate expansion; readings below 50 indicate contraction. But analysts rarely focus on any single monthly print. The trend over several months and the surprise versus consensus are what drive EUR/USD moves.
A sustained recovery in Eurozone PMIs after a weak spell is Euro-positive because it signals improving growth and potentially less accommodative ECB expectations. A sharp negative surprise, especially if US data remains solid, tends to weigh on the pair. The source analysis noted that Eurozone PMI readings had suffered a pronounced decline across March and April, with subsequent prints tracing a tentative upward path, a trend that analysts viewed as lending modest support to the Euro at the time.
The German Ifo Business Climate Index adds a second, independent macro signal. Published monthly by the Ifo Institute, it surveys approximately 9,000 German firms on their current business situation and their expectations for the next six months. Responses are converted into balance values ranging from negative 100 to positive 100, normalised to the 2015 average. Analysts pay particular attention to the expectations component, because it is the most forward-looking element and carries the strongest directional signal for the Euro.
| Indicator | Publisher | Release Frequency | Key Component | EUR/USD Signal Logic |
|---|---|---|---|---|
| Eurozone Composite PMI | S&P Global | Monthly (flash and final) | Trend over several months; surprise vs consensus | Sustained recovery = Euro-positive; sharp miss = Euro-negative |
| German Ifo Business Climate Index | Ifo Institute | Monthly | Expectations component (six-month outlook) | Rising expectations from a low base = Euro-positive; falling expectations = Euro-negative |
The highest-value reading comes when both indicators are moving in the same direction. A multi-month PMI recovery trend, confirmed by a rising Ifo expectations index, tells you that the macro case for Euro strength is accumulating on two independent data tracks. That convergence raises the quality of any positioning or technical signal pointing in the same direction. Divergence between the two, PMI recovering but Ifo stalling, or the reverse, reduces conviction and signals that the macro picture is less clear-cut than either indicator alone would suggest.
Eurozone PMI divergence from US readings reached a 4.5-point gap in services sector activity in May 2026, a concrete example of how a multi-month PMI trend that contradicts improving Ifo expectations reduces conviction in any EUR/USD bullish setup built on macro convergence.
Understanding what these releases measure and how they interact means you can assess incoming data with the same contextual lens as a professional, rather than reacting to headline numbers without knowing whether they confirm or contradict the prevailing trend.
Technical levels and risk sentiment: the third pillar that conditions everything else
Technical levels matter even in fundamentally driven FX markets for a straightforward reason: many participants, including algorithmic systems, anchor their decisions around specific prices. That anchoring makes certain zones self-reinforcing in the short run. Three participant types illustrate the mechanism:
- Trend followers decide whether to add to or cut positions when price reaches a key zone
- Mean-reversion traders decide whether to fade the move at the same levels
- Options desks and corporate hedgers adjust hedges around these prices, creating concentrated order flow at specific points
When all three groups are acting at the same price, the level becomes a genuine decision point, not an arbitrary line.
A prior breakout zone carries particular weight. When EUR/USD consolidates in a range and then breaks higher, the upper boundary of that consolidation becomes a reference level. When price later retests that zone from above, it often acts as support for two reinforcing reasons: traders who missed the original breakout view the retest as a second-chance entry, and existing longs feel more comfortable adding around a level that previously preceded a strong rally.
The source analysis pointed to the 1.1660-1.1670 zone as a support area anchored by the preceding period’s breakout activity, with the view that a meaningful return below it would only become likely if conditions in broader risk markets worsened materially. This is a time-specific illustration, not current guidance, but the structural logic it demonstrates applies to any prior breakout zone you identify.
Why risk sentiment can override technically strong support
No support level is a guarantee. It is a probability statement, and its reliability depends entirely on the prevailing macro and risk regime.
In calm or mildly positive risk environments, a strong prior breakout zone has a meaningful probability of holding. But in genuine risk-off episodes, where equities are selling off, credit spreads are widening, and volatility indices are elevated, the US dollar typically strengthens broadly as a safe haven. Under those conditions, even technically strong support in EUR/USD can break. The level did not fail on its merits; the macro regime shifted underneath it.
This is why professionals attach explicit conditions to technical views: “support at X should hold absent a broader deterioration in global risk sentiment.” The appropriate question you should always ask is not “will this level hold?” but rather “what macro or risk regime shift would cause this level to fail?”
Adopting that conditional framing is the single most important habit separating a useful technical view from a naive one.
Conditional scenario mapping, the practice of defining specific price triggers and the macro conditions required for each branch to activate, is the structured output of technical analysis when used as professionals use it, not as a prediction of where price will go, but as a decision framework for when it gets there.
Bringing the three pillars together: the convergence framework in practice
Each pillar on its own gives you partial information. Convergence across all three is how institutional desks build high-conviction views.
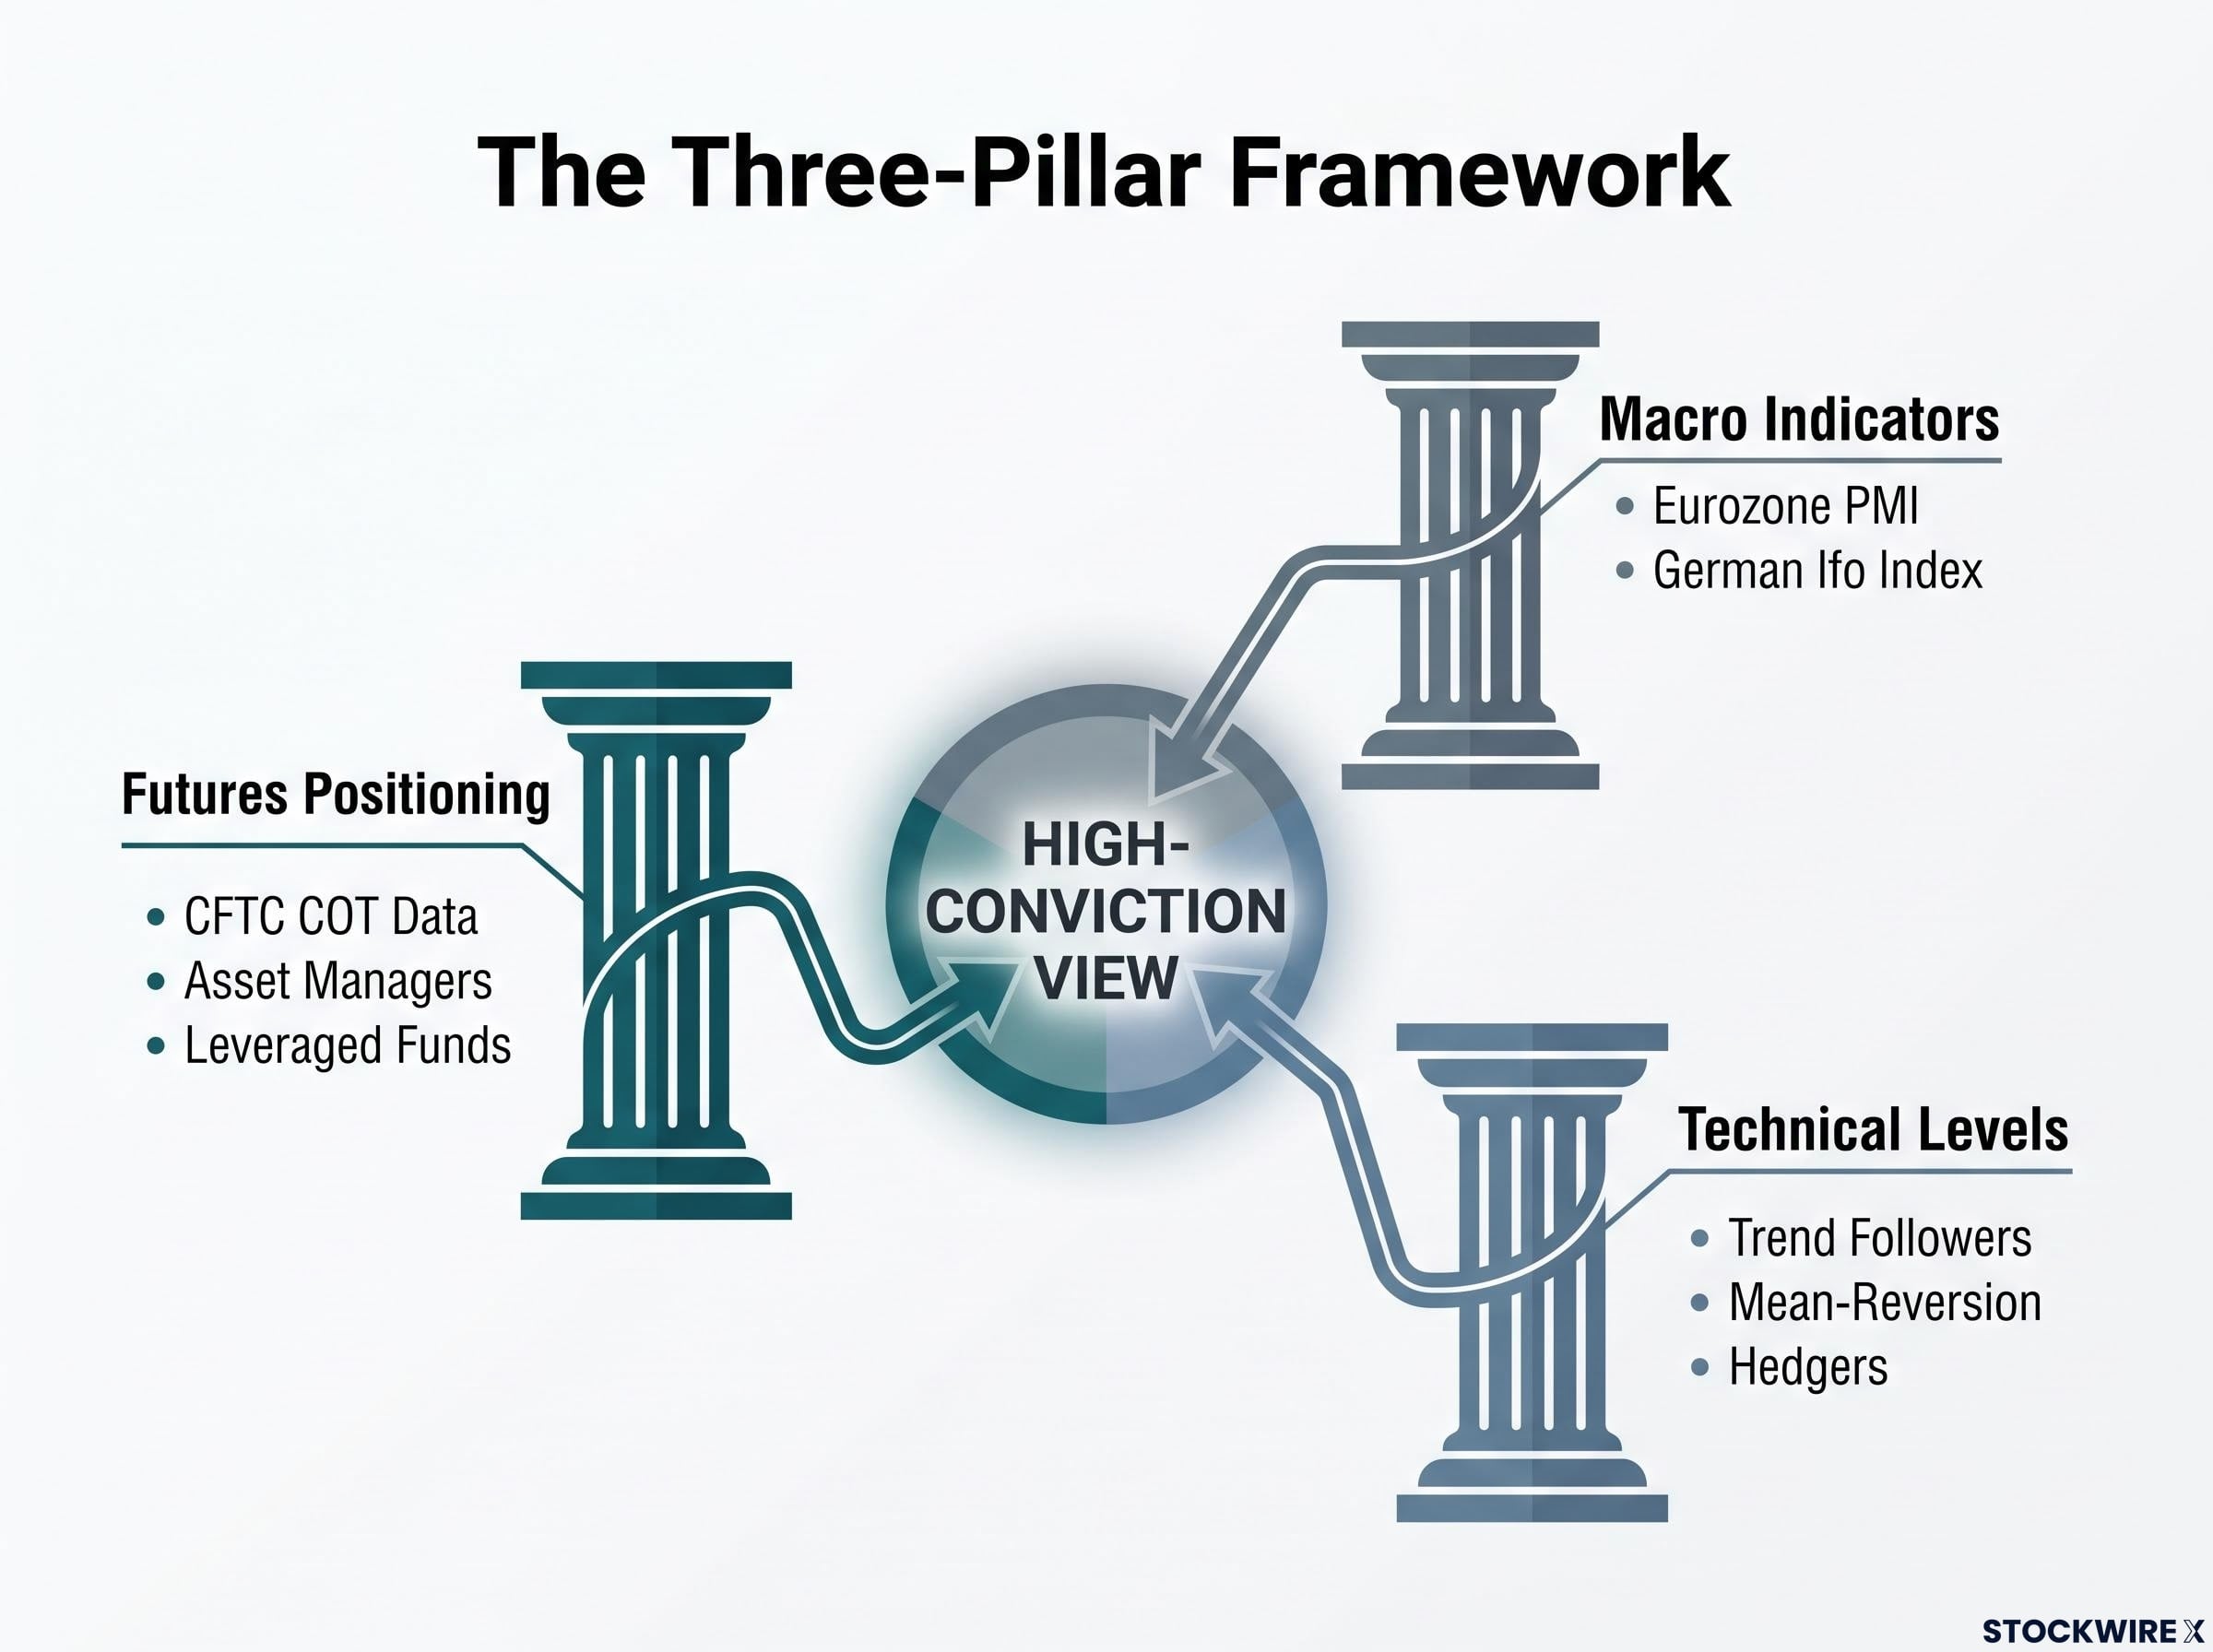
A bullish EUR/USD setup, with all three pillars aligned, looks like this: Eurozone PMIs have been improving for several consecutive months and Ifo expectations are rising from a low base (macro); speculative positioning remains underweight the Euro and has not yet caught up to the improved macro backdrop (positioning); EUR/USD is holding above a prior breakout zone with risk sentiment stable or improving (technicals). Each pillar confirms the others, and the setup carries genuine analytical weight.
The bearish counterpart reverses every element: weakening Eurozone PMIs and falling Ifo expectations while US data holds up, crowded Euro longs in futures markets, and EUR/USD failing at resistance with risk sentiment turning cautious.
| Pillar | Bullish Setup | Bearish Setup |
|---|---|---|
| Futures Positioning | Speculative underweight; not yet caught up to improving macro | Crowded Euro longs; positioned for strength already priced in |
| Macro Indicators | Rising PMIs and Ifo expectations; Eurozone outperforming | Falling PMIs and Ifo expectations; US data resilient |
| Technical Levels | Holding above prior breakout zone; stable risk sentiment | Failing at resistance; risk sentiment turning cautious |
The more useful skill is knowing what to do when the pillars disagree. When one pillar contradicts the others, say strong macro data but already very crowded speculative longs, professionals reduce conviction, increase hedging, or wait for clearer alignment before acting. A two-out-of-three signal is not worthless, but it warrants smaller position sizing and tighter risk parameters.
Here is the practical checklist for applying this framework yourself:
- Track COT positioning weekly, focusing on trends over several weeks rather than single snapshots
- Know PMI and Ifo release dates and consensus expectations in advance, so you can assess the surprise component
- Mark prior breakout zones and key technical levels on your EUR/USD chart
- Attach explicit conditions to every level: ask what macro or risk scenario would cause it to fail
- Seek convergence across all three pillars before treating any signal as high quality
Institutional price targets become outdated quickly. The method, how positioning, macro data, and technical levels are combined, is what remains durable across different market environments.
What this framework gives you that price charts alone cannot
EUR/USD price movement is the output. The forces that drive it, relative economic momentum, speculative positioning, and institutional behaviour around key levels, are legible before they fully express in price. The three-pillar framework is the structured way to read those upstream forces.
What makes this approach durable is that none of the inputs are proprietary. COT data is published weekly by the CFTC and freely accessible. PMI and Ifo releases follow published schedules with consensus forecasts available in advance. Technical levels are visible to anyone with a chart. The analytical edge comes not from exclusive data access but from the discipline of requiring multiple pillars to agree before treating any EUR/USD signal as high quality.
The method of combining pillars is what remains useful across different market environments, not the specific forecasts that applied when the method was first illustrated.
Your simplest entry point is identifying where current speculative positioning sits relative to the prevailing macro trend. If positioning has not caught up to the direction macro data is pointing, you have found the starting condition for the covering rally mechanism, and you can then check whether technical levels confirm or complicate the picture.
For readers wanting to see the three-pillar framework applied to the dollar side of the pair in live market conditions, our deep-dive into the Dollar Index technical breakdown covers the stair-step support rotation, moving average structure, and the macro catalyst calendar that determines whether the August 2026 move extends or reverses.
This article is for informational purposes only and should not be considered financial advice. Investors should conduct their own research and consult with financial professionals before making investment decisions. Past performance does not guarantee future results.