Canada’s Q2 2025 GDP came in at minus 1.6% annualised. RBC economists Nathan Janzen and Abbey Xu had projected a figure in excess of 3%. The gap between those two numbers is not a rounding error; it is a full reversal of the recovery story that consensus had priced in heading into the summer of 2025.
That reversal still matters. As of August 2026, Canada is working through a sub-trend growth trajectory with U.S. tariff policy unresolved and medium-term forecasts pointing to below-potential output through at least 2027. The Q2 2025 contraction was not a one-quarter stumble that the economy absorbed and moved past. It was the starting point for a structural growth question that remains open.
Here is what the data actually tells you about where Canadian economic momentum stands: what drove the contraction, why the domestic picture was more resilient than the headline suggests, and what the medium-term trajectory means for Canadian assets and monetary policy going forward.
The number that rewrote the recovery narrative
RBC’s Nathan Janzen and Abbey Xu published their pre-release analysis projecting Q2 annualised GDP growth in excess of 3%, describing it as validation of a genuine recovery. Statistics Canada’s official release recorded minus 0.4% quarter-on-quarter, or minus 1.6% annualised, following a plus 0.5% gain in Q1.
It was the first quarterly contraction since Q3 2023 and the sharpest non-pandemic decline in nearly a decade.
Per-capita real GDP fell 0.4% in Q2, erasing the 0.4% gain from Q1. That per-capita reversal strips out population growth noise and gives a human-scale reading: the average Canadian’s share of economic output shrank during the quarter.
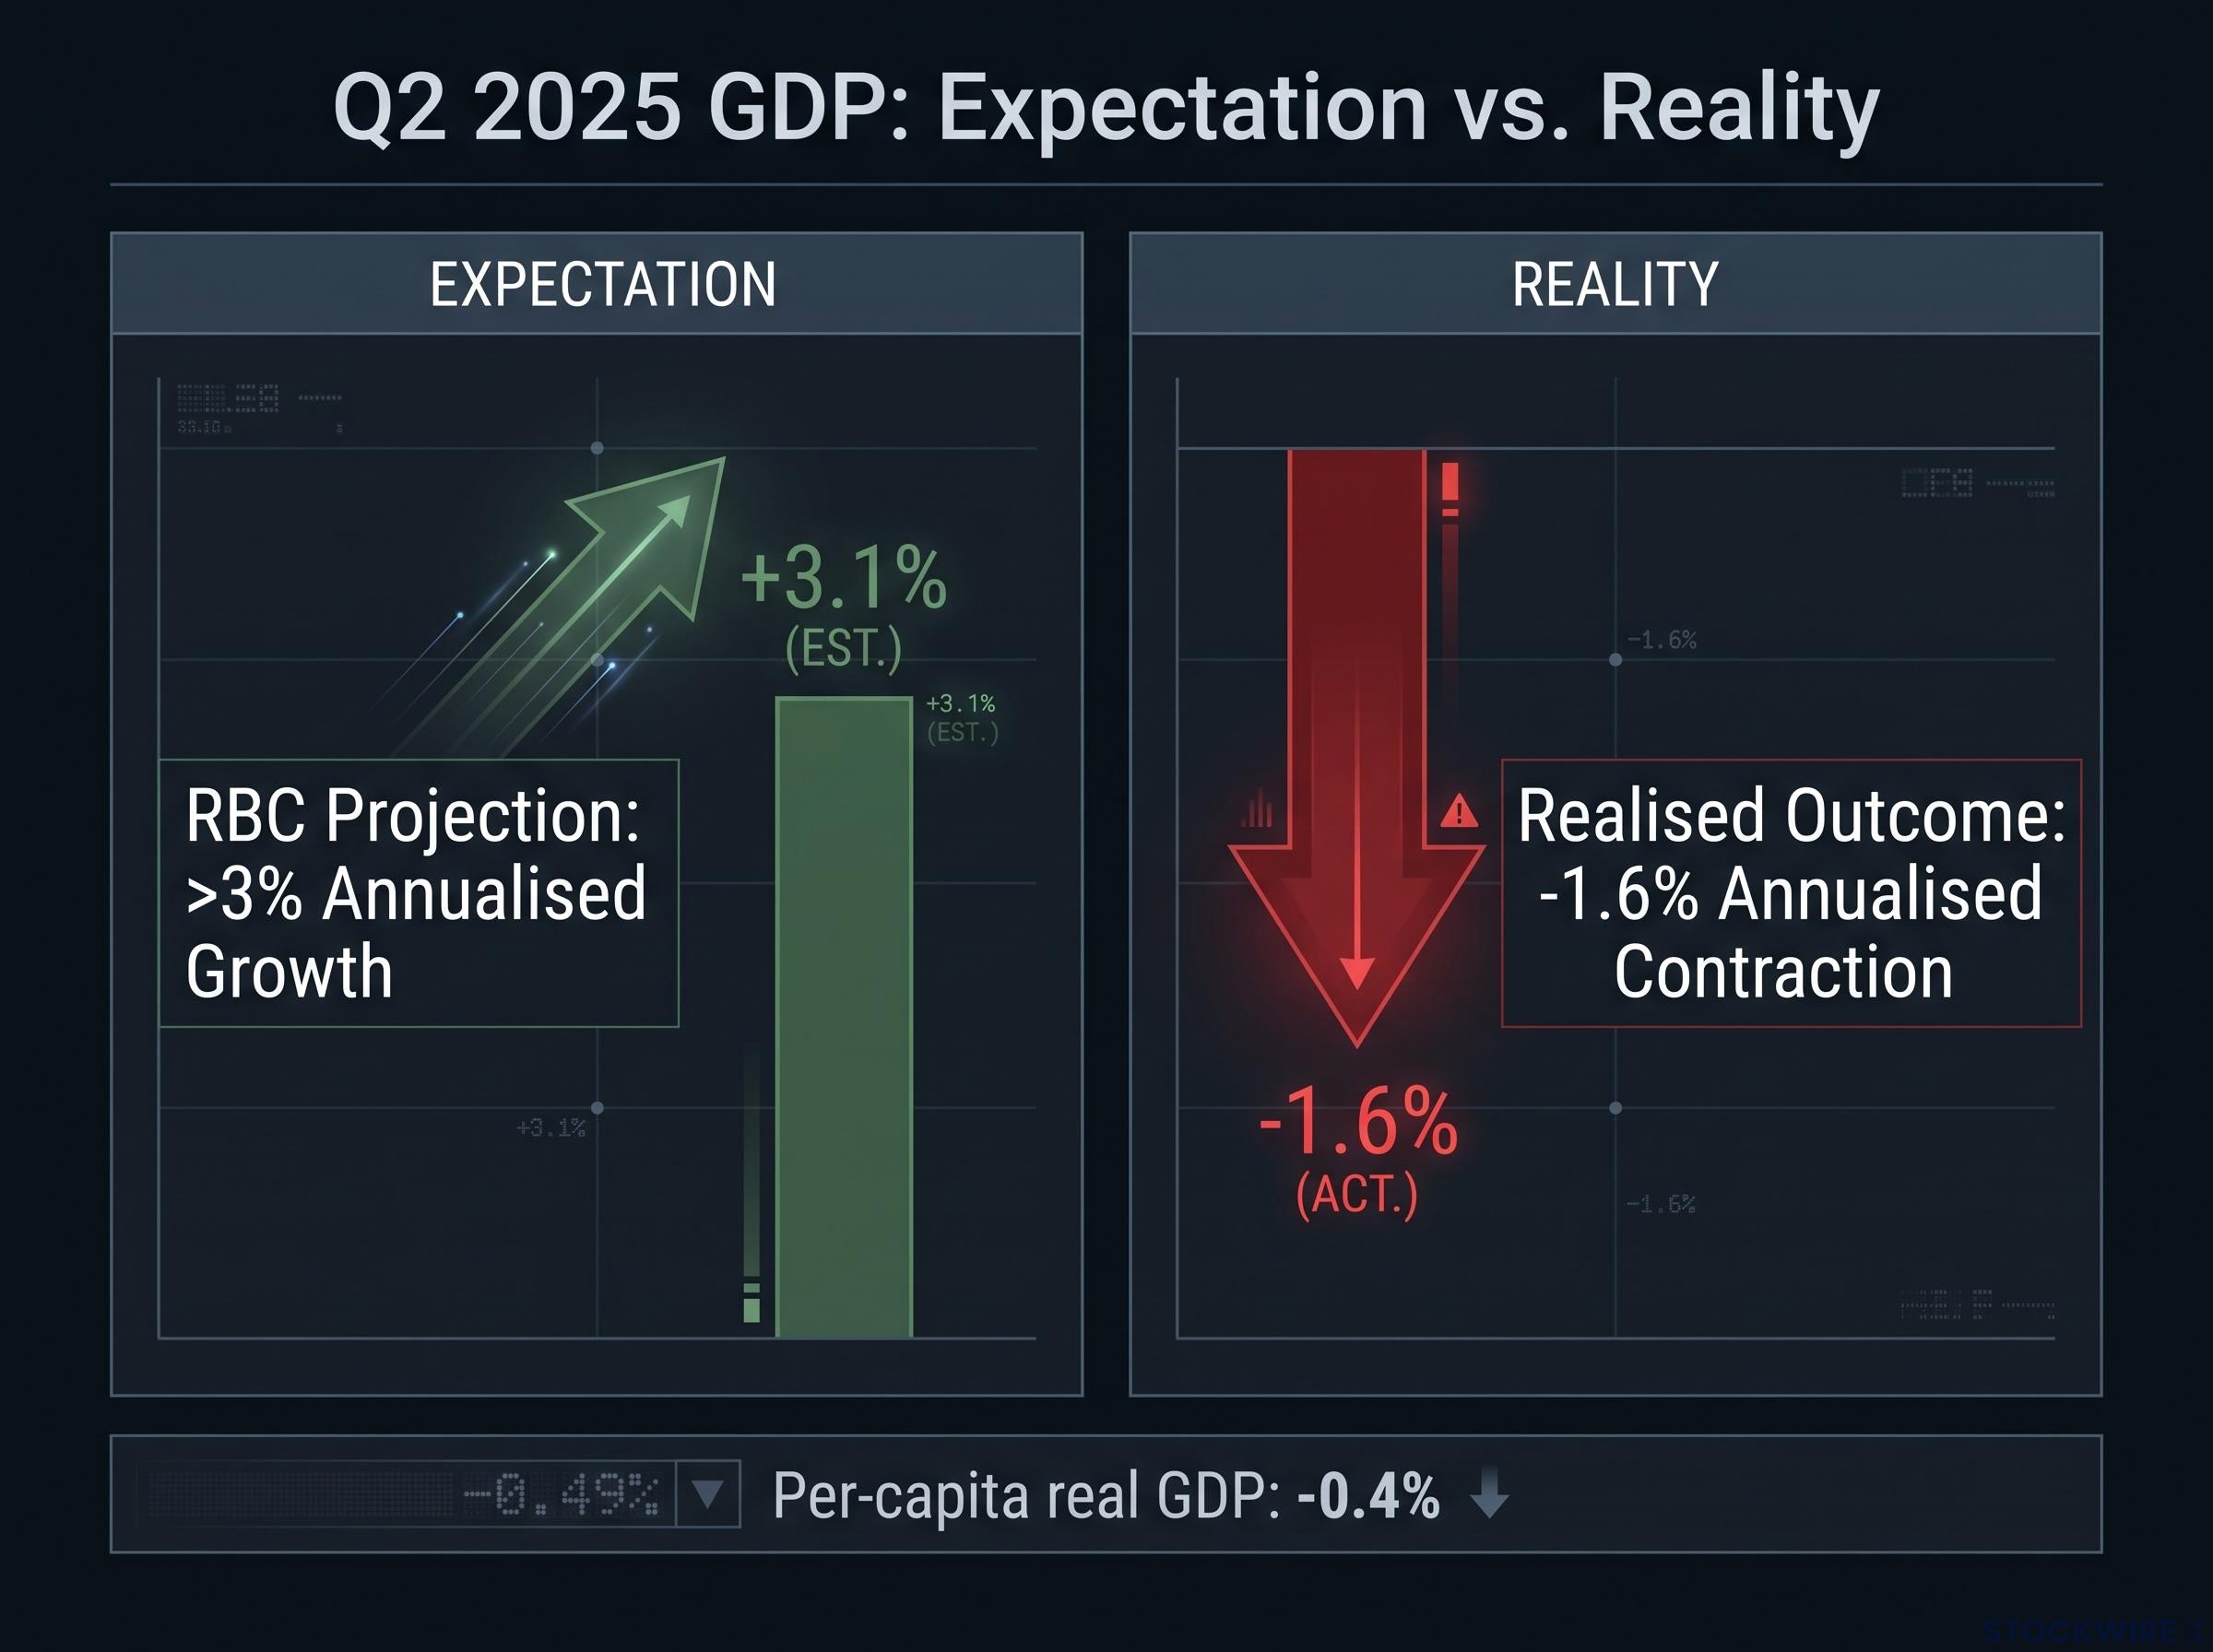
| Indicator | RBC Projection | Realised Outcome |
|---|---|---|
| Q2 annualised GDP growth | In excess of 3% | −1.6% |
| Q2 quarter-on-quarter growth | Positive rebound | −0.4% |
| Per-capita real GDP (Q2) | Implied positive | −0.4% |
The scale of the miss is what matters most here. This was not a minor data shortfall where the economy grew a little less than expected. It was a fundamental misread of the economy’s direction. That should recalibrate how much confidence you place in near-term Canadian growth consensus forecasts going forward, because the consensus was not just wrong on magnitude; it was wrong on sign.
The expectations differential concept explains why the Q2 miss hit harder than a simple negative-versus-positive comparison suggests: the same minus 1.6% annualised figure would have landed differently had consensus been positioned for contraction rather than growth in excess of 3%, and that gap between expectation and outcome is what drove the repricing rather than the absolute level of output.
When big ASX news breaks, our subscribers know first
Where the domestic economy held and where it did not
The headline contraction obscures a more complicated story underneath. Strip out the external sector, and the domestic economy did not collapse.
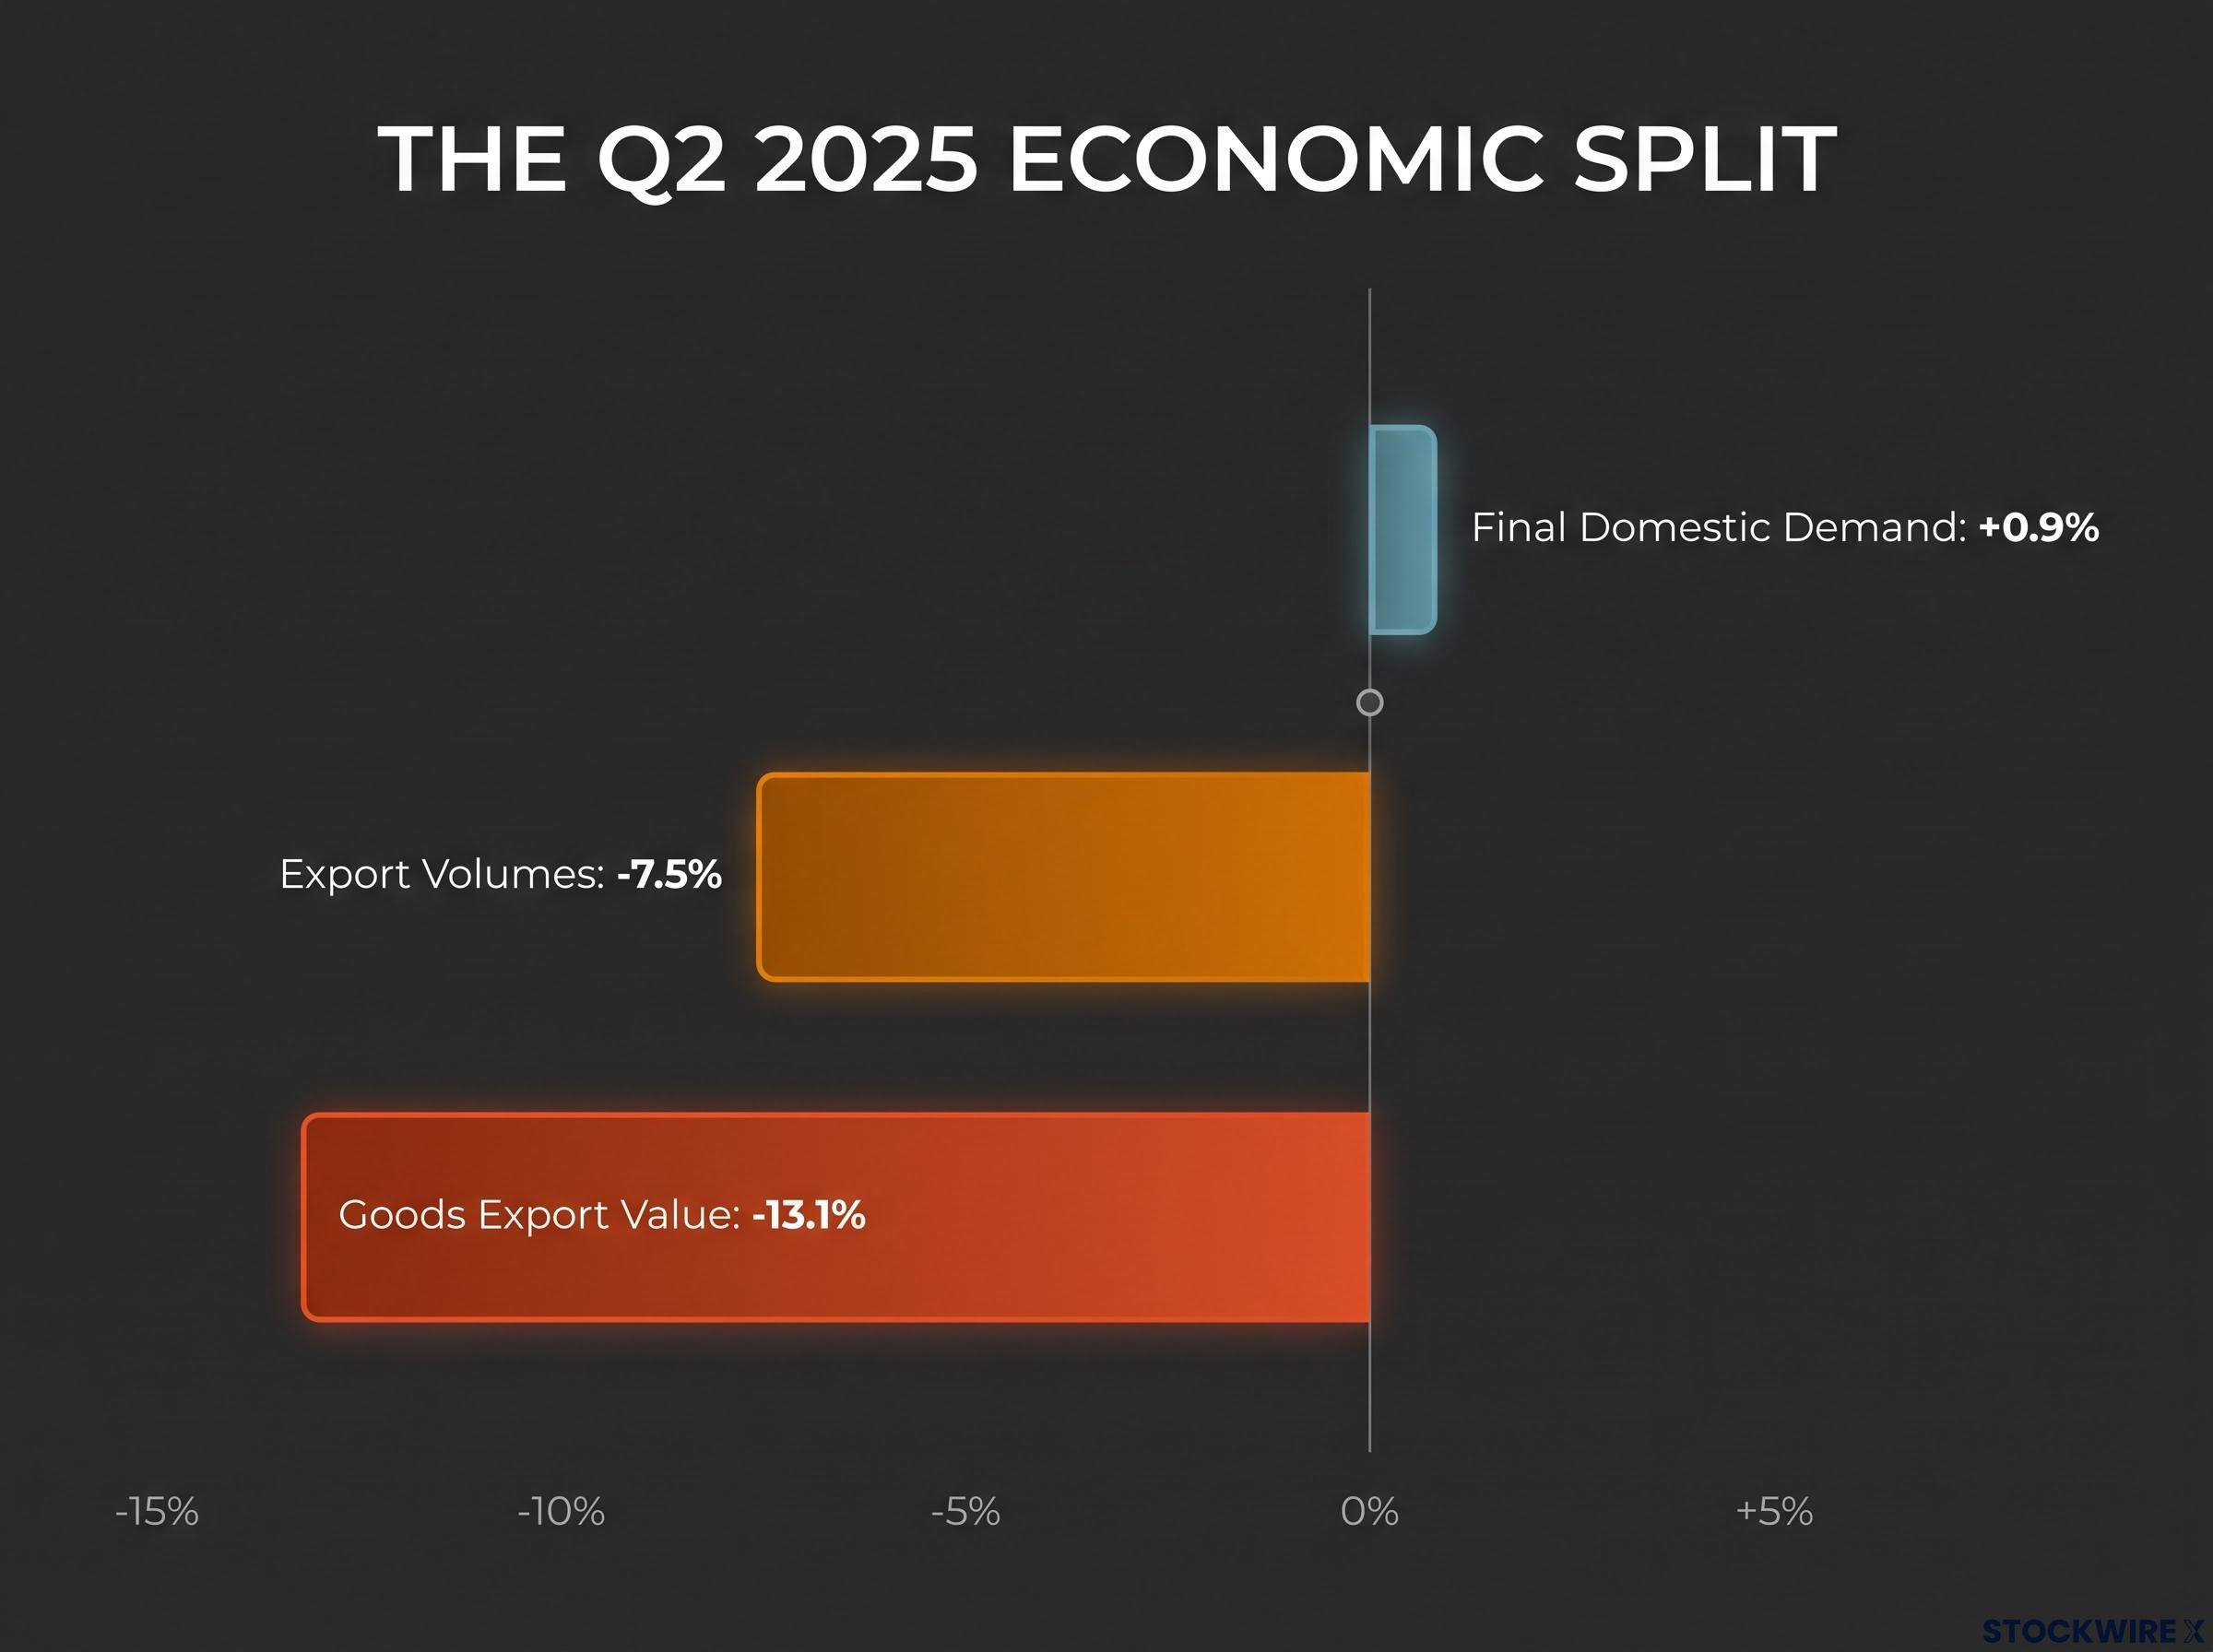
Final domestic demand, which captures household spending, government outlays, and business investment without the noise of trade and inventories, rose 0.9% in Q2 2025. That followed a minus 0.2% reading in Q1:
- Q1 2025 final domestic demand: minus 0.2%
- Q2 2025 final domestic demand: plus 0.9%
Business Data Lab characterised the domestic economy as having “held ground” in Q2, even as the headline turned negative. The weakness came from outside Canada’s borders, not from within.
That said, the domestic picture was not uniformly strong. Business investment in machinery and equipment declined during the quarter. TD Economics described household spending and investment across 2025 as anemic, with limited momentum building quarter to quarter.
A plus 0.9% domestic demand reading in a quarter where headline GDP contracted tells you something specific: the contraction was imposed on the economy from outside rather than generated from within. That distinction matters for sectoral positioning. If domestic demand is holding, rate-sensitive sectors are not facing the same structural headwinds as export-exposed sectors. The two stories require different responses.
How U.S. tariffs turned net exports into a wrecking ball
RBC’s pre-release analysis had forecast that trade would deliver a sizeable positive boost to Q2 growth, with a recovery in automotive output after winter disruptions acting as an additional tailwind. The official data told the opposite story.
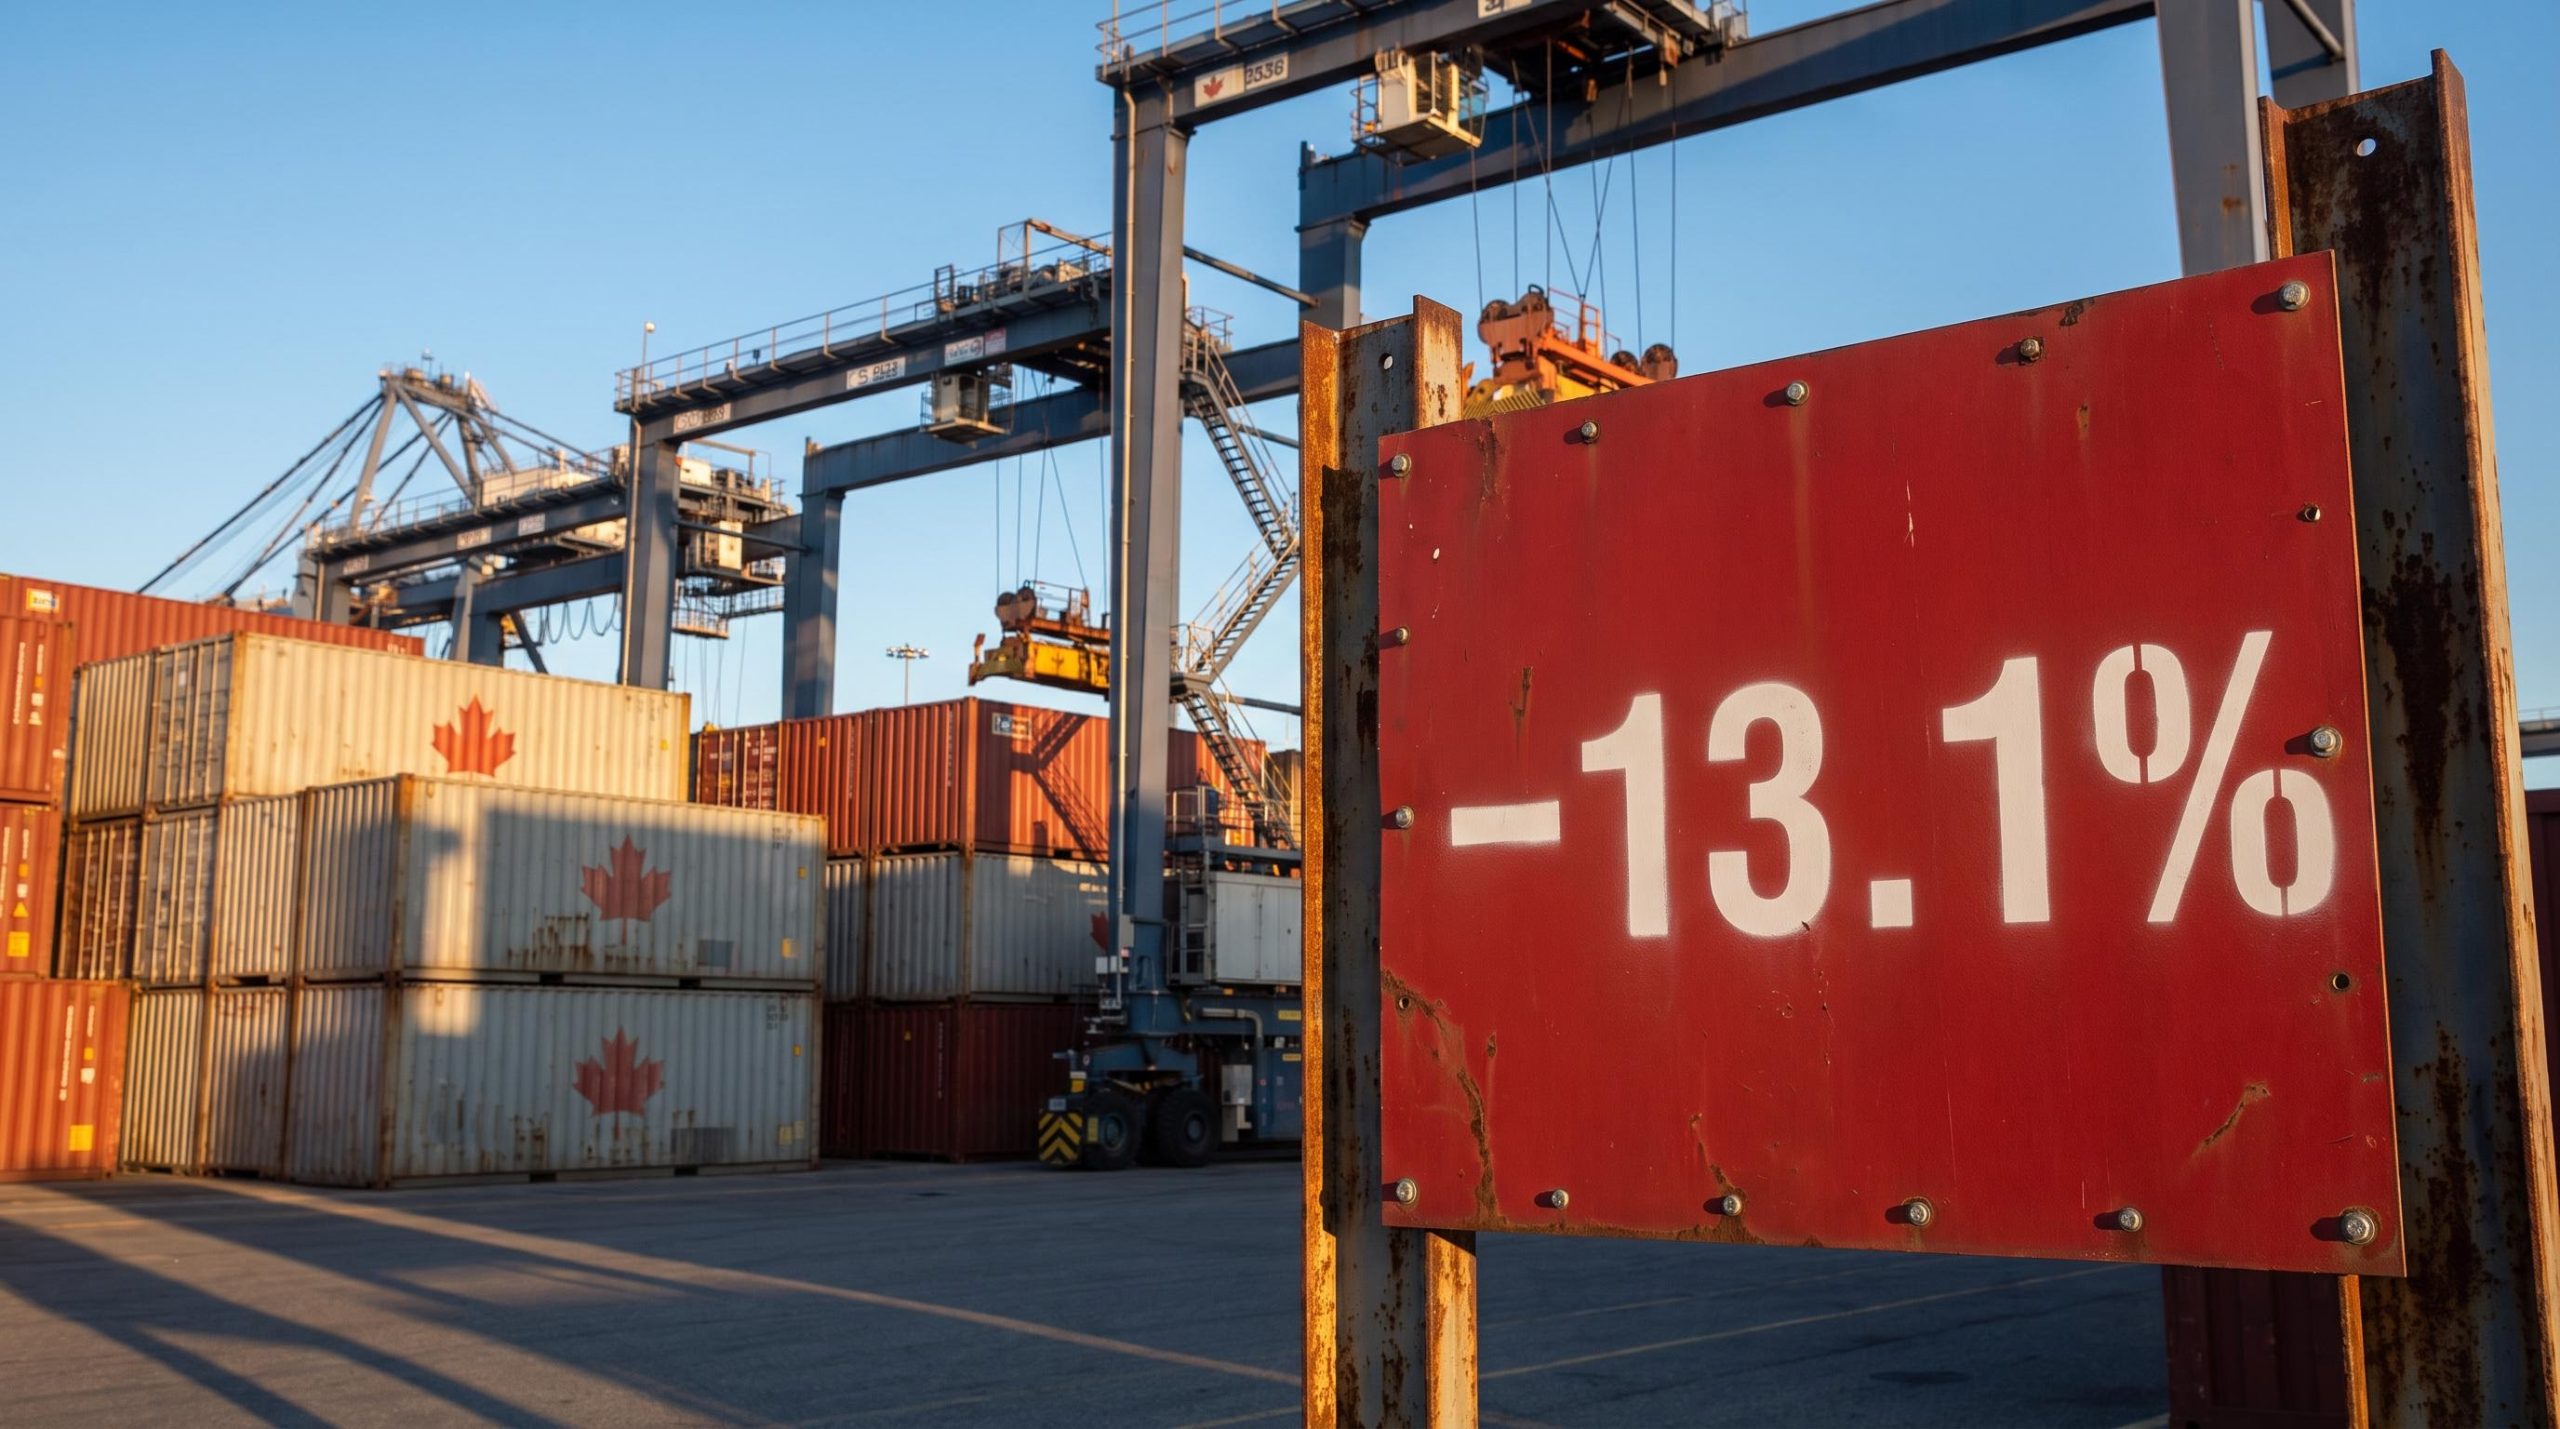
Goods exports fell approximately 13.1% in value during Q2 2025, dropping to the lowest level since late 2021.
The trade data make the mechanism clear:
- Export value: declined approximately 13.1% in Q2
- Export volumes: fell roughly 7.5% in the quarter
- Net exports: a major drag on GDP rather than the positive contributor that had been projected
U.S. tariffs on a wide range of Canadian goods drove the collapse. There is no evidence in Statistics Canada’s official release or Global Affairs Canada’s trade report that the anticipated automotive sector rebound produced a meaningful positive tailwind. Instead, broad tariff-related weakness hit manufacturing and goods exports across the board.
Section 338 tariffs carry a structural feature that distinguishes them from prior trade actions: no formal investigation, no congressional oversight, and no sunset clause, meaning the ceiling on the dispute is genuinely open-ended and the scope can be expanded by presidential proclamation without additional procedural steps.
A 13.1% collapse in goods export value in a single quarter tells you that U.S. trade policy has moved from a theoretical risk to a realised and quantifiable drag on Canadian output. For investors holding Canadian manufacturing, resources, or industrial equities, the trade shock’s magnitude is not a rounding error. It represents a direct earnings environment risk that remains structurally unresolved as of August 2026.
What Canada’s sub-trend growth path looks like through 2027
The Q2 contraction was not the beginning of a quick recovery arc. TD Economics projects Canadian real GDP growth on a Q4-over-Q4 basis as follows:
- 2025: 0.7%
- 2026: 1.3%
- 2027: 1.8%
Sub-trend growth means economic output is expanding more slowly than the economy’s productive capacity would allow. In practical terms, that translates to limited gains in living standards, slow improvement in labour market conditions, and weaker income growth for households over a multi-year period.
Two structural constraints explain why the path stays below trend even as the acute Q2 shock fades.
Trade uncertainty as a persistent external constraint
Tariff uncertainty does not just reduce export volumes in the quarter it hits. It creates a longer planning horizon problem for Canadian businesses. S&P Global Ratings explicitly flags trade tensions and tariff uncertainty as key constraints on Canadian growth going forward. Investment decisions get deferred when businesses cannot price export contracts with confidence, and supply chain adjustments take multiple quarters to execute. The result is a persistent drag that outlasts any single tariff announcement.
Demographic moderation and the labour force ceiling
Federal policy restricting temporary residents and tightening student intake constrains the labour force growth that has supported Canadian GDP expansion in recent years. These effects are expected to materialise from 2025 onward, reducing both the supply of workers and a source of housing demand. Rather than offsetting the trade headwind, demographic moderation compounds it: Canada faces softer external demand and a slower-growing domestic workforce simultaneously.
A 0.7% full-year growth forecast for 2025 tells you that Canada is not in a temporary soft patch but on a multi-year below-trend trajectory, with direct implications for income growth, employment conditions, and the pace of any recovery in rate-sensitive asset classes.
What the contraction signals for Bank of Canada policy and Canadian assets
The Q2 contraction shifted the Bank of Canada rate outlook decisively. A strong Q2 would have supported patience on easing. Instead, the contraction combined with trade uncertainty pushed market expectations firmly toward rate cuts.
The Q2 GDP result moved the Bank of Canada’s positioning from patience to active easing expectations, a more significant signal than any single month of data because it reflects the central bank’s own assessment of economic direction.
Canada’s core inflation picture adds a further dimension to the policy calculus: CPI-trim and CPI-median are both tracking below the Bank of Canada’s 2% target and beneath the Bank’s own quarterly forecasts, which strengthens the case for continued easing beyond what the GDP contraction alone would justify.
The asset class implications follow logically from that policy shift:
- Fixed income: softer growth and trade uncertainty support lower bond yields and strengthen the case for duration exposure. If the Bank of Canada cuts, shorter-dated bonds reprice first, but the growth trajectory supports duration across the curve.
- Canadian dollar: a negative growth surprise relative to projections combined with rising rate-cut expectations is typically negative for CAD, particularly if U.S. growth and rates appear relatively firmer by comparison.
- Equities: the two sector stories diverge. Export-heavy sectors (manufacturing, resources, some industrials) face ongoing tariff and demand risk, as the Q2 trade data demonstrated. Rate-sensitive sectors such as real estate and financials may benefit from eventual easing, but that support comes against a backdrop of weak household income growth and limited macro momentum.
For globally oriented investors, this framework translates the macro data into three positioning questions: how much duration to hold, whether to hedge CAD exposure, and which side of the domestic-versus-export split to favour within Canadian equities.
What the data revision story means for how you read Canadian GDP going forward
The RBC projection was not built on speculation. It drew on Statistics Canada’s advance estimate pointing to plus 0.2% June growth, alongside early monthly readings for April and May that together accounted for close to a full percentage point of quarterly expansion. Those inputs pointed to a strong quarter.
What happened was that revisions to earlier months, combined with the trade shock’s full weight appearing in the final data, collectively flipped the story from growth to contraction. Nathan Janzen and Abbey Xu had explicitly warned that the monthly GDP series carries a track record of material revisions that can alter the picture significantly.
This is not a one-off error. It is a structural feature of GDP accounting. Monthly readings are explicitly preliminary. Advance estimates are designed to provide a directional signal, not a definitive outcome. The gap between the advance estimate and the final Q2 data illustrates exactly why treating preliminary prints as settled numbers creates exposure.
Knowing that advance estimates can reverse entirely by the final release tells you to build confirmation lags into your analytical process. If you are making allocation decisions on a preliminary GDP print, you are positioning on a number that may not survive the next revision cycle.
This article is for informational purposes only and should not be considered financial advice. Investors should conduct their own research and consult with financial professionals before making investment decisions.
The contraction as baseline: what has and has not changed about Canada’s growth story
The Q2 episode confirmed one thing and revealed another. What it confirmed: Canada’s medium-term growth path is sub-trend, with TD Economics projecting a gradual climb from 0.7% in 2025 to 1.8% by 2027, still below potential throughout. The Bank of Canada is in easing mode rather than pause mode. Those realities were already forming before the Q2 data arrived.
What Q2 revealed was the mechanism. The contraction was driven by the external trade shock rather than a collapse in domestic demand. Final domestic demand came in at plus 0.9%, holding ground while net exports cratered. That distinction matters because it tells you the economy’s internal recovery capacity is not structurally impaired; it is externally disrupted.
The forward question is whether Canada can rebuild export volume under a tariff regime that remains unresolved, and whether domestic demand momentum can compensate for the trade drag while that resolution plays out. Three variables will determine the answer:
Trade policy resolution remains the single largest swing factor for Canadian goods exports, and the current state of negotiations, paused tariffs with no signed agreement and no automatic extension mechanism, means that resolution timeline is structurally unknowable rather than merely uncertain.
- Trade policy resolution: the single largest swing factor for Canadian goods exports and the sectors exposed to them
- Domestic demand momentum: whether household spending and government outlays can sustain the positive trajectory visible in Q2’s final domestic demand reading
- Bank of Canada easing pace: how aggressively the central bank cuts, and whether rate relief flows through to household spending and business investment quickly enough to matter
The recovery timeline is tied to trade policy resolution as much as to any domestic lever the Bank of Canada can pull. If you hold Canadian assets, the trade headlines deserve at least as much attention as the domestic economic indicators.
Past performance does not guarantee future results. Financial projections are subject to market conditions and various risk factors.