While ASX earnings season has absorbed most investor attention over the past fortnight, two macro forces have been quietly repricing risk in the background: a US debt load that has crossed USD $40 trillion and a tightening Iran sanctions regime that is beginning to generate friction in the US-China relationship.
Neither risk is a headline today. Both could become one. The US is running annual net interest costs above USD $1 trillion, managing duration through short-dated issuance that leaves the debt stock exposed to a rate shock, and heading into the Jackson Hole symposium (27-29 August 2026) with bond markets already testing the limits of fiscal tolerance. Simultaneously, successive waves of Iran-related sanctions are disrupting Chinese crude imports and raising the spectre of secondary sanctions that could directly implicate Chinese entities.
Here is a framework for mapping the conditions under which these risks compound, the ASX sectors most exposed, and eight indicators worth tracking before the next inflection point.
The US debt problem is bigger than the headline number suggests
USD $40 trillion in gross national debt is the context. It is not the risk. The risk is the cost of carrying that debt at current rates.
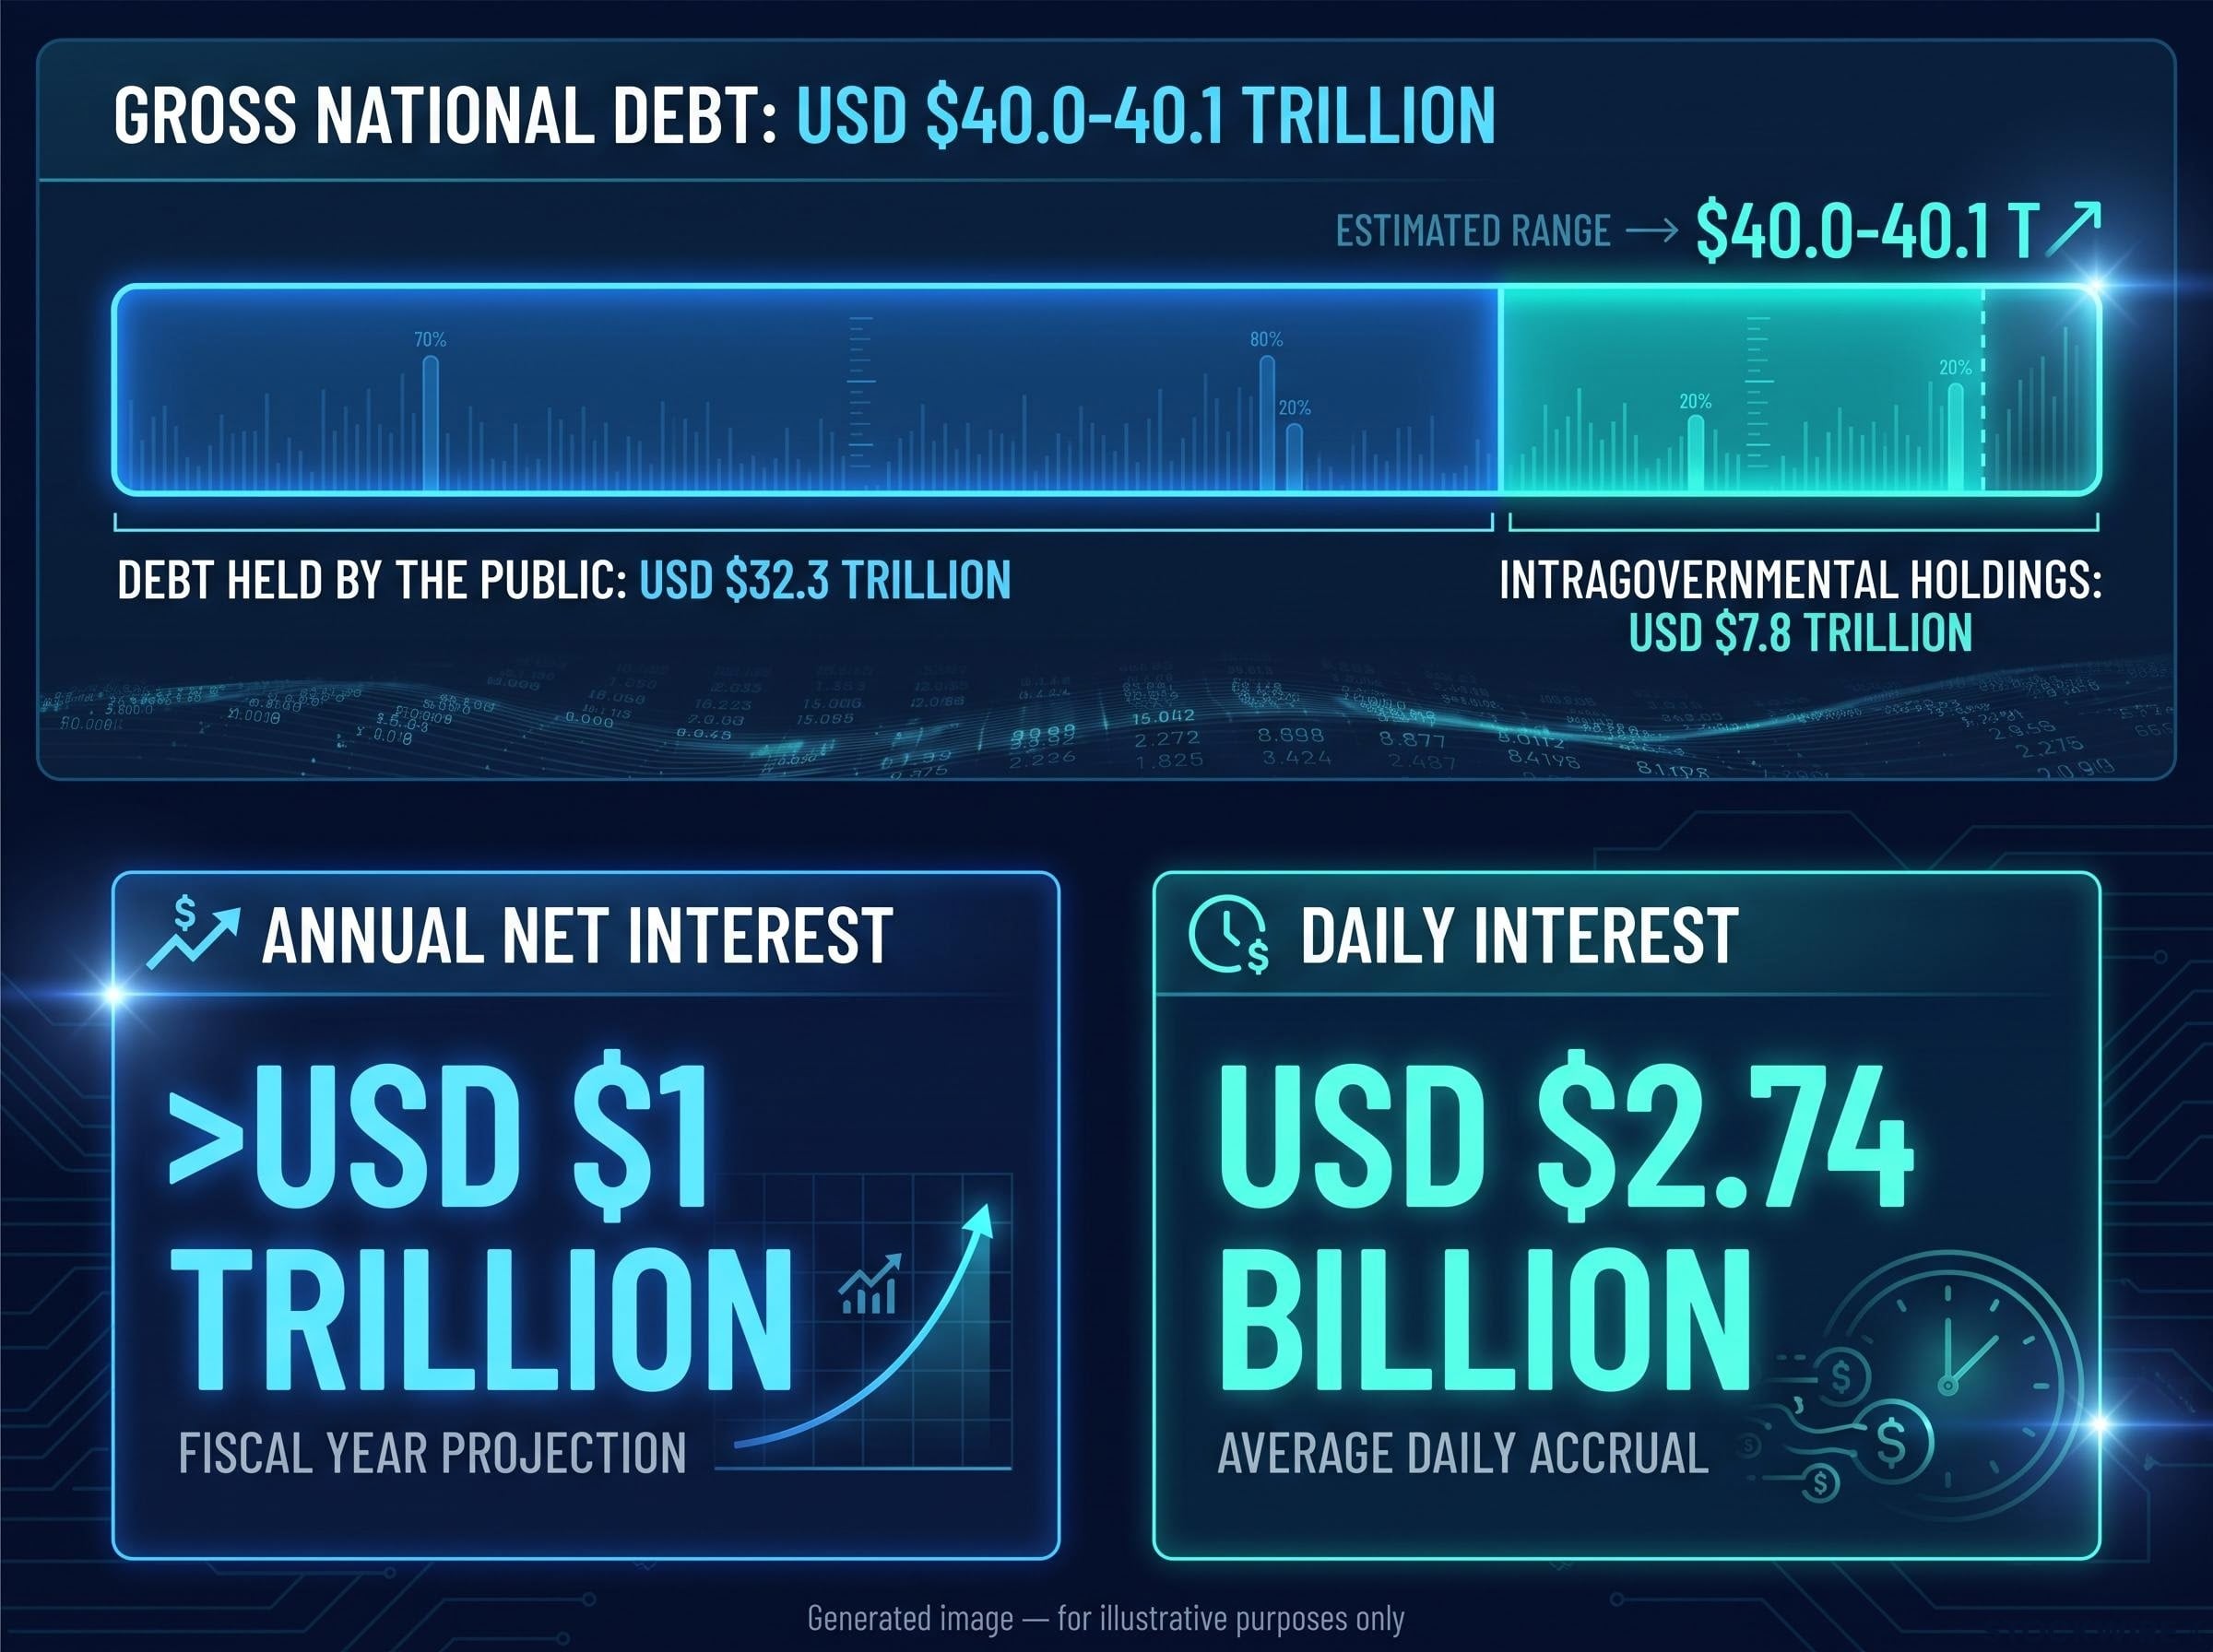
The stock breaks down as follows:
- Gross national debt: approximately USD $40.0-40.1 trillion
- Debt held by the public: approximately USD $32.3 trillion
- Intragovernmental holdings: approximately USD $7.8 trillion
Annual net interest now exceeds USD $1 trillion, which implies the US government is spending approximately USD $2.74 billion per day just to service what it owes. That figure reframes the debt debate from an abstract political argument to an active cash management problem that is already shaping how the Treasury manages duration, and that vulnerability is directly relevant to anyone holding rate-sensitive assets.
U.S. Treasury Fiscal Data on national debt confirms total debt reached approximately USD $39.8 trillion as of July 2026, with interest costs for FY2026 tracking at USD $1,170 billion, figures that validate the scale of the carrying-cost problem central to this analysis.
The Treasury’s strategy of rolling shorter-dated instruments to finance the retirement of longer-dated obligations carries structural risk: the optics of near-term yield management come at the cost of greater exposure to any future rate shock, a dynamic some analysts liken to addressing a long-term liability with short-term, high-cost borrowing.
The buyback operations themselves, at approximately USD $4 billion per operation, are modest to the point of irrelevance against a USD $40 trillion debt stock. They do not change the structural picture. The issuance mix and duration management are a source of market concern, not a solved problem. Investors who track headline debt figures but miss the issuance-mix dynamic are watching the wrong variable.
Investors who track headline debt figures but miss the issuance-mix dynamic are watching the wrong variable, a conclusion supported by closer analysis of debt affordability metrics: interest payments representing 18.5% of US tax revenue in fiscal year 2025 reveal more about near-term fiscal stress than the gross debt-to-GDP ratio that dominates financial media coverage.
When big ASX news breaks, our subscribers know first
What Jackson Hole could change, and why the timing matters
The Jackson Hole symposium (27-29 August 2026) is not just a scheduled economic conference. It is an event risk where the Fed’s communication stance on long-end yields, not any specific rate decision, is the variable that matters.
The key market question heading into next week is direct: how tolerant is the Fed of elevated long-term yields in the face of a USD $40 trillion debt load? A hawkish surprise, or a deliberate refusal to lean against bond-market stress, would likely push US 10- and 30-year yields higher and weigh on risk assets globally.
Research into past symposia shows that leaner central bank guidance can itself raise term premia (the extra yield investors demand for holding longer-dated bonds), because investors must demand more compensation when they are uncertain about the policy reaction function.
The range of possible outcomes is wide, and the asymmetry of those outcomes is the reason to care now rather than after the fact. Jackson Hole has repeatedly acted as an inflection point for rate expectations, with impact driven by shifts in perceived long-run policy stance rather than tactical rate signals.
With September hike odds collapsed to around 30% ahead of the symposium, the equity risk premium sits in a range that leaves rate-sensitive assets highly vulnerable to a hawkish surprise, because a pause is already largely priced in and the downside from a more aggressive communication exceeds the upside from dovish signals.
What a hawkish outcome looks like for Australian assets
For ASX investors, Jackson Hole is not an abstract US monetary policy event. It is a potential reset point for the global discount rate that directly affects how every rate-sensitive Australian asset is valued. The four ASX categories most exposed to higher discount rates are:
- A-REITs, where valuations are directly sensitive to the long-end yield curve
- Infrastructure stocks, which rely on discounted cash flow models that compress under higher rates
- Utilities, whose defensive yield appeal diminishes as risk-free rates climb
- High-multiple growth stocks, where the present value of distant earnings shrinks fastest
Banks present a mixed picture: higher rates could support net interest margins in the near term, but rising medium-term credit risk from household and SME balance sheets works in the opposite direction.
How Iran sanctions reach the ASX via Beijing
The causal chain from Washington to the ASX runs through Beijing, and each link makes the next harder to dismiss.
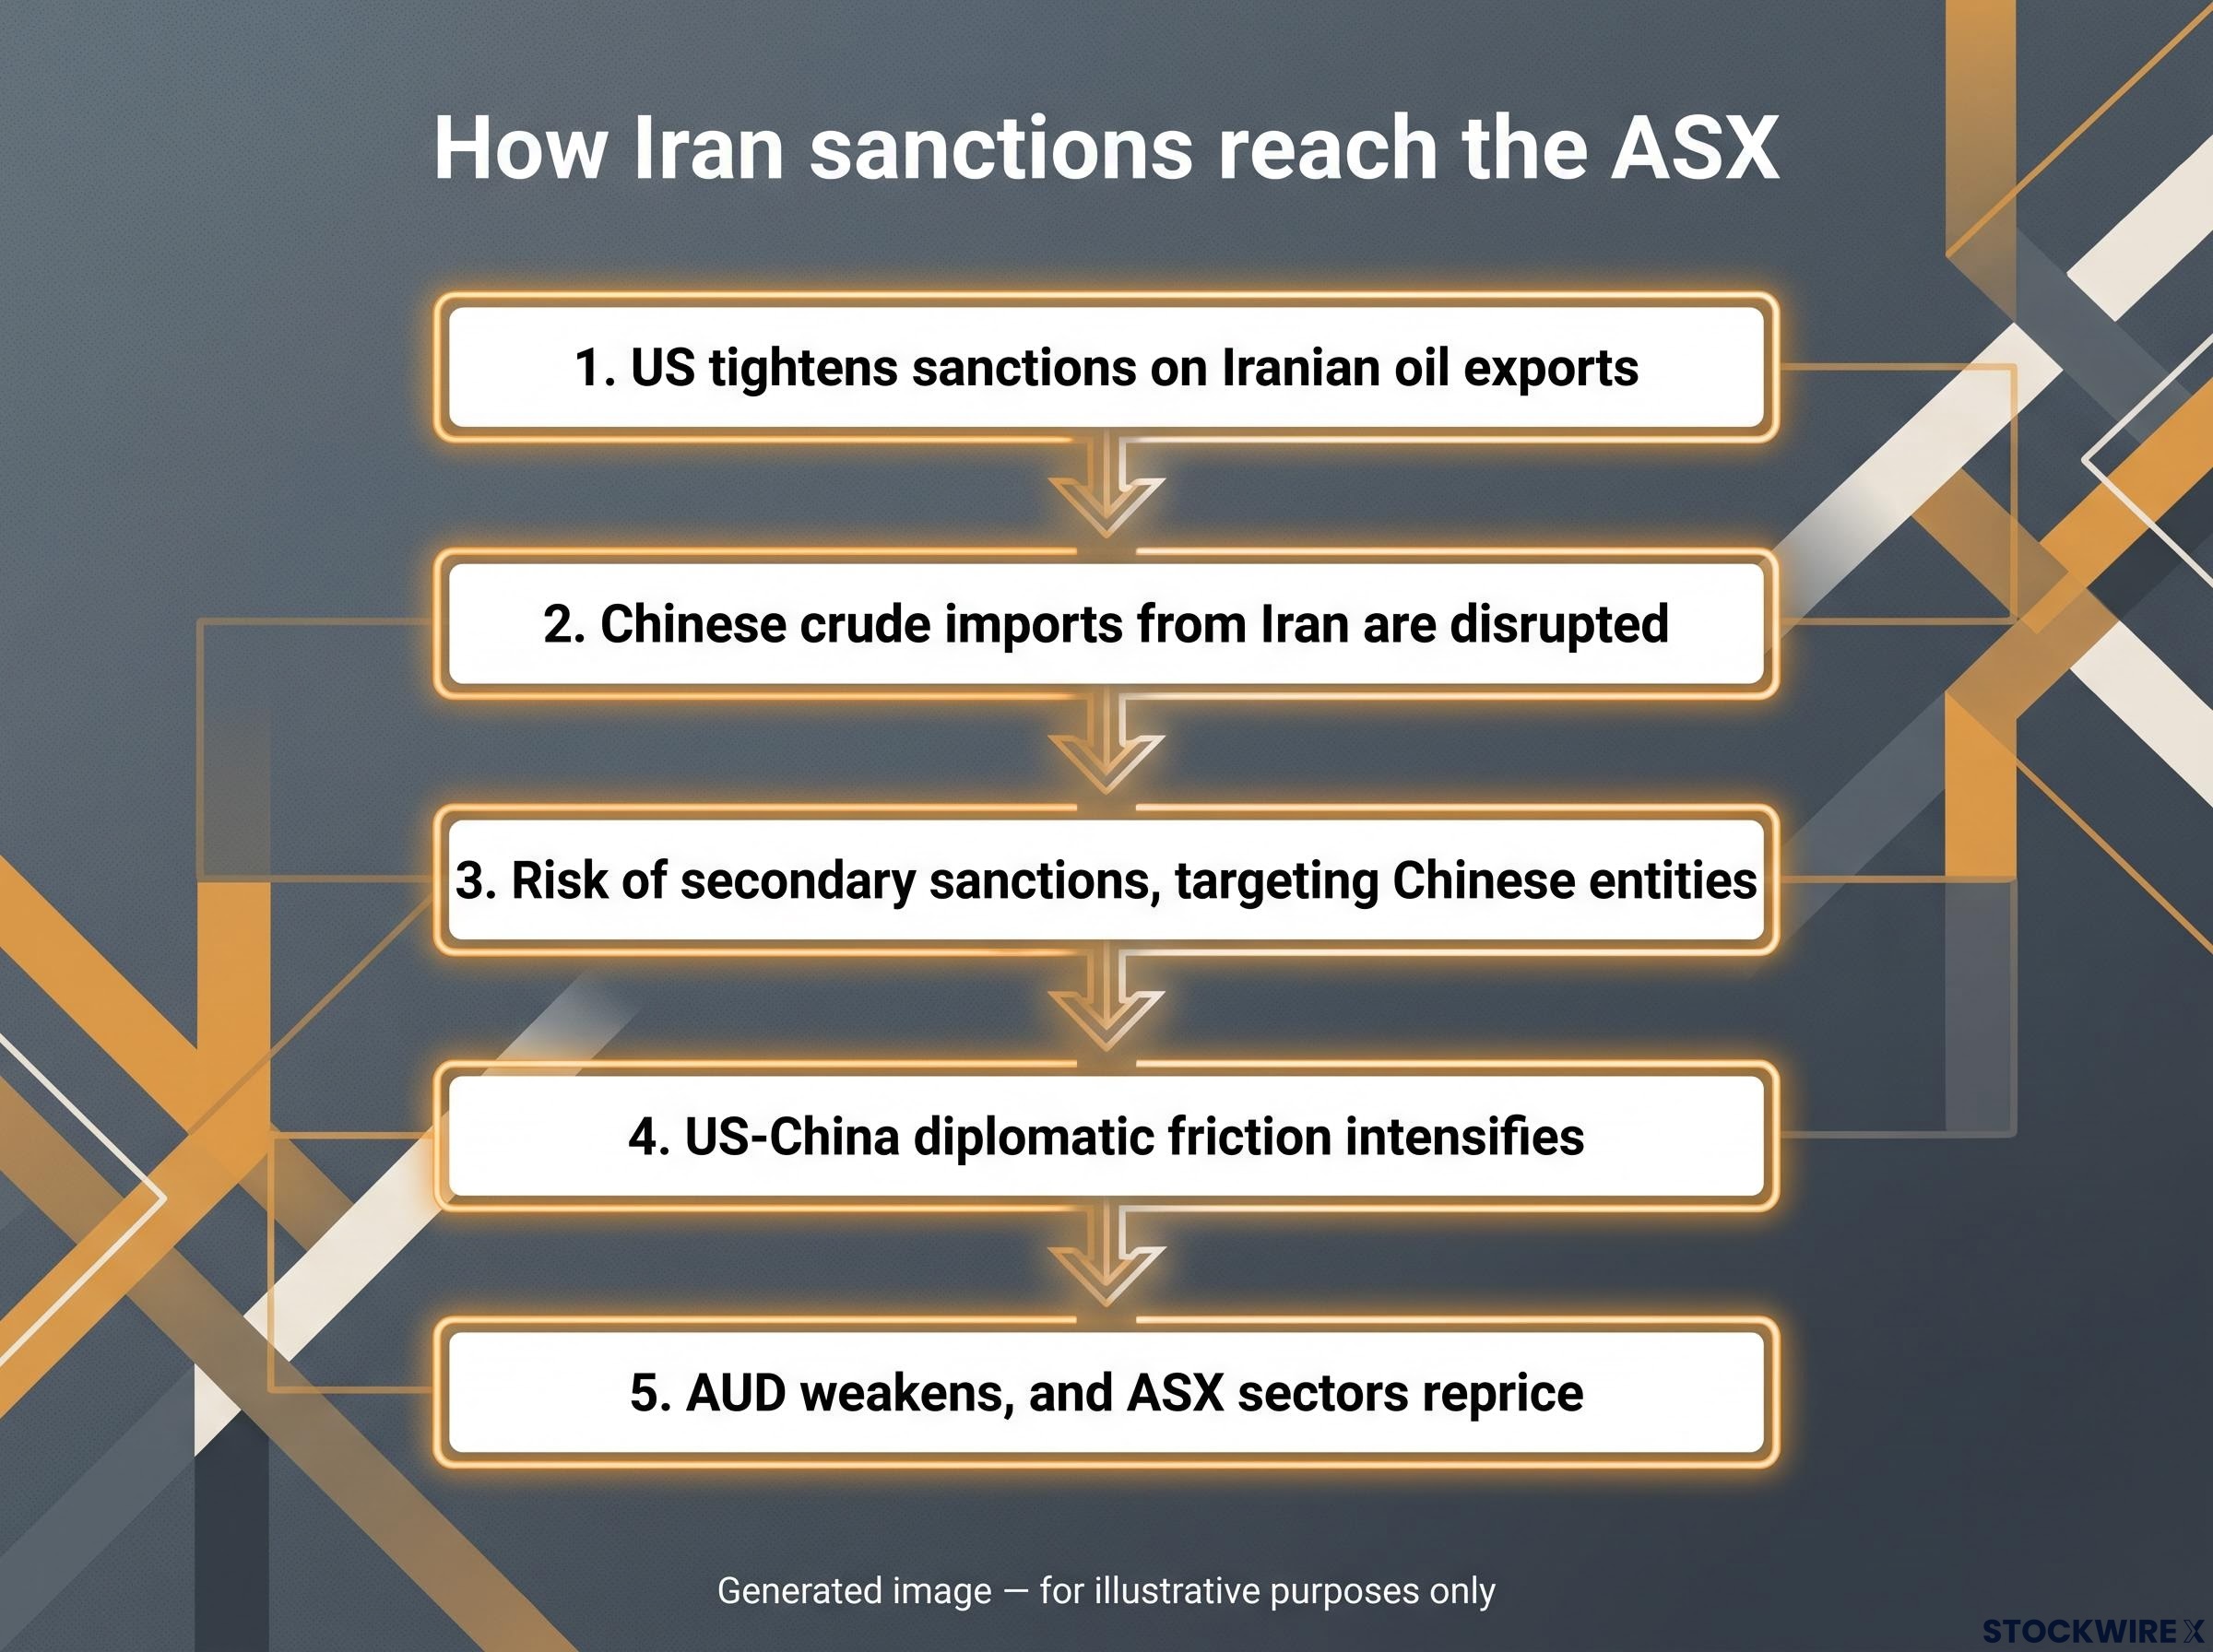
- The US tightens sanctions on Iranian oil exports
- Chinese crude imports from Iran are disrupted, raising freight costs and forcing shipping workarounds
- The risk of secondary sanctions, targeting Chinese entities purchasing Iranian crude, escalates
- US-China diplomatic friction intensifies, with Iran sanctions, rare earth leverage, and trade tensions surfacing simultaneously
- The AUD weakens as a China demand proxy, and ASX energy, materials, and rate-sensitive sectors reprice
China has been a key buyer of Iranian crude, often at a discount, and successive waves of US sanctions since 2025-26 have disrupted but not eliminated those flows. Sanctions have raised freight and charter costs, triggered tanker-ownership workarounds, and caused short-term drops in Chinese imports at various points. One analysis notes that Chinese exports to Iran fell by roughly 90% over a short period amid war-related disruptions and stricter sanctions, though that figure has not been independently confirmed.
The mechanism that elevates this from a commodity price story to a US-China relations story is secondary sanctions. If those sanctions credibly threaten Chinese entities, Iran-related geopolitics stops being about oil prices and starts being about bilateral diplomatic friction, which is directly material to ASX miners and energy names beyond simple oil price sensitivity.
The secondary sanctions escalation ladder is the highest-impact single variable in the Iran-China oil dynamic: moving from targeted teapot refiners to Chinese state banks and major firms would shift Iranian exports from disrupted to severely constrained, and could trigger a critical minerals countermove that the commodity tape and company-specific equity impacts would absorb very differently.
The rare earth dimension
China’s documented control of rare earth and critical mineral export channels provides a separate source of diplomatic leverage. Tighter Chinese export controls remain a scenario risk rather than a confirmed current event, but if deployed, they could boost medium-term price expectations for Australian lithium and rare earths producers while simultaneously disrupting specific offtake and processing arrangements. The commodity tape and the company-specific impact could move in opposite directions.
The four channels through which these risks reach Australian portfolios
The two macro risks described above do not arrive at the ASX as separate events. They travel through four interconnected transmission channels, and understanding how those channels compound under stress is the analytical shift that separates a reactive portfolio response from a prepared one.
| Channel | Trigger | Direction | Most exposed ASX sectors | Offsetting factor |
|---|---|---|---|---|
| Global yields | US fiscal stress pushes 10- and 30-year yields higher | Higher Australian yields regardless of RBA | A-REITs, infrastructure, utilities, high-multiple growth | RBA may lag if domestic conditions soften |
| AUD as risk proxy | US-China tension or broad risk-off | Weaker AUD, stronger USD and JPY | Importers, consumer discretionary | Currency translation benefit for USD-earning miners and exporters |
| Energy and commodity pricing | Iran sanctions embed supply risk premium | Higher oil and LNG spot prices | LNG-exposed producers benefit on revenue; rate-sensitive sectors squeezed by inflation re-acceleration | Equity multiples may compress even as spot prices rise |
| Equity risk premium | US fiscal sustainability concerns | Higher global equity risk premium | Broad ASX index, with beta to US and global moves | Flight to quality may support gold and defensives |
The compounding effect is where this framework earns its value. An investor holding a single-channel view, for instance that Iran is bullish for energy stocks, may be wrong if the risk-off channel simultaneously compresses the equity multiple that was priced on the oil revenue upside. When broad risk-off conditions take hold, any currency translation advantage for miners and exporters tends to be swamped by the weight of falling equity prices across the board.
Three scenarios and what each one means for ASX positioning
The point of scenario analysis is not to predict which future arrives. It is to stress-test your holdings against each one and identify where you are most concentrated.
| Scenario | Trigger condition | ASX underperform | ASX outperform | Key watch variable |
|---|---|---|---|---|
| A: Higher US yields, no geopolitical shock | Hawkish Jackson Hole; fiscal stress without escalation | A-REITs, infrastructure, utilities, high-multiple growth | Commodity producers with USD revenues; banks mixed | US 30-year yield and term premia |
| B: Iran-China sanctions escalation, modest oil spike | Secondary sanctions target Chinese entities; oil rises | Rate-sensitive sectors under inflation re-acceleration pressure | LNG-exposed energy, gold, some rare earths and lithium names | Official sanctions language on Chinese entities |
| C: Full risk-off (tail risk) | Failed diplomacy, sanctions escalation, AUD weakness combine | Broad equity weakness dominates; banks face dual headwinds | Gold and defensives; LNG revenue supported but multiples compress | AUD/USD plus US 30-year yield moving simultaneously |
Scenario C is a tail risk, not a base case. But the scenario most relevant to any individual investor depends on existing sector exposures. An overweight to A-REITs and infrastructure is most vulnerable to Scenario A. A materials-heavy portfolio may underestimate the demand-side risk embedded in Scenario C, where China slowdown concerns compress volumes even as commodity prices hold.
When all four transmission channels fire at once, the currency uplift that looked protective for exporters and miners is typically buried under the weight of broad equity weakness. Any hedge that appeared sound in isolation stops functioning when cross-channel compounding takes over.
Eight indicators worth checking before the next inflection point
The analysis above maps conditional risk. The monitoring checklist below converts it into a weekly habit.
- US 10- and 30-year Treasury yields and term premia: the fastest indicators of fiscal stress transmission to global discount rates
- Jackson Hole speeches and subsequent market repricing: watch for tolerance or intolerance of elevated long-end yields in the coming days
- USD index and AUD/USD: real-time gauges of risk sentiment and China demand expectations
- Official US sanctions announcements on Iran: particularly any mention of secondary sanctions targeting Chinese entities
- Iranian crude flows to China: volumes, discounts, freight costs, and tanker routing data signal how effectively sanctions are biting
- Iron ore, copper, and LNG spot prices: barometers of China demand and global energy risk premia
- US-China diplomatic calendar: any confirmed engagements, their framing, and outcomes
- RBA commentary: for any signal that global rate dynamics are altering the domestic policy path
The three-indicator combination to watch
The single combination that warrants the most attention is the US 30-year yield direction, the AUD/USD trend, and official Iran sanctions language moving in the same risk-off direction simultaneously. When all three align, it signals cross-channel compounding rather than idiosyncratic noise. That is when the four transmission channels described earlier begin reinforcing each other, and the distinction between a background risk and a foreground repricing event collapses.
What the reporting season backdrop obscures
ASX reporting season has produced a fortnight of company-specific results: earnings beats, guidance upgrades, margin commentary. That is useful information. But the macro variables examined here are setting the conditions for the next leg of market movement, and they are operating on a different timeline.
For investors wanting to see how macro transmission channels have already manifested in ASX stock-level data, our full explainer on ASX market breadth deterioration examines how 22 index constituents hit 52-week lows in a single week while the headline index fell less than 1%, illustrating the divergence between index-level calm and sector-level stress.
Jackson Hole arrives next week. The trajectory of US-China diplomatic engagement remains unresolved. Neither the US debt trajectory nor the Iran sanctions regime is a binary on-off risk; both are gradual pressure-builders whose market impact tends to arrive suddenly when a catalyst crystallises the underlying vulnerability.
The macro risks examined here are gradual pressure-builders whose market impact tends to arrive suddenly when a catalyst crystallises the underlying vulnerability. The quiet period was the preparation window.
A portfolio review conducted before a catalyst event carries more optionality than one conducted after yields have moved or the AUD has weakened. The framework above maps conditional risk, not a predetermined outcome. Investors who have reviewed their rate-sensitive and China-exposed holdings against these scenarios are better positioned than those waiting for the catalyst to arrive.
This article is for informational purposes only and should not be considered financial advice. Investors should conduct their own research and consult with financial professionals before making investment decisions. These statements are speculative and subject to change based on market developments and company performance.
—