The headline number for China’s industrial output in July was 4.5% year-on-year growth. Unspectacular. Broadly in line with expectations. Easy to file away.
But inside that number, high-tech manufacturing expanded at 16.9%. That gap is not statistical noise. It is the signature of a structural break.
China’s industrial economy is separating into two distinct growth regimes. Traditional production is plateauing. Robotics, electric vehicles, and semiconductors are accelerating at rates that would be remarkable in any single sector, let alone across three simultaneously. For investors monitoring Chinese equities, global supply chains, or emerging-market exposure, reading the aggregate industrial figure without disaggregating it is a category error.
Here is what the July data reveals about where China’s industrial engine is being pointed, what policy architecture is driving it, and what it actually changes for portfolio positioning and risk assessment.
The gap inside the headline is the story
4.5% overall industrial output versus 16.9% high-tech manufacturing growth in July 2026. The gap is the signal.
That spread is not a one-month anomaly. In the first half of 2026, high-tech manufacturing grew approximately 13.3% year-on-year, while overall industrial firms managed 5.0-5.4%. Overall manufacturing output in July came in at 5.5%, outpacing the broader industrial headline but still nearly three times slower than its high-tech subset.
Survey data sharpen the picture further. The high-tech manufacturing PMI (Purchasing Managers’ Index, a monthly survey measuring whether factory activity is expanding or contracting) sat firmly above 53 in July, well into expansion territory. The broader factory PMI softened around the neutral 50 line. Two different industrial economies are running side by side inside the same headline.
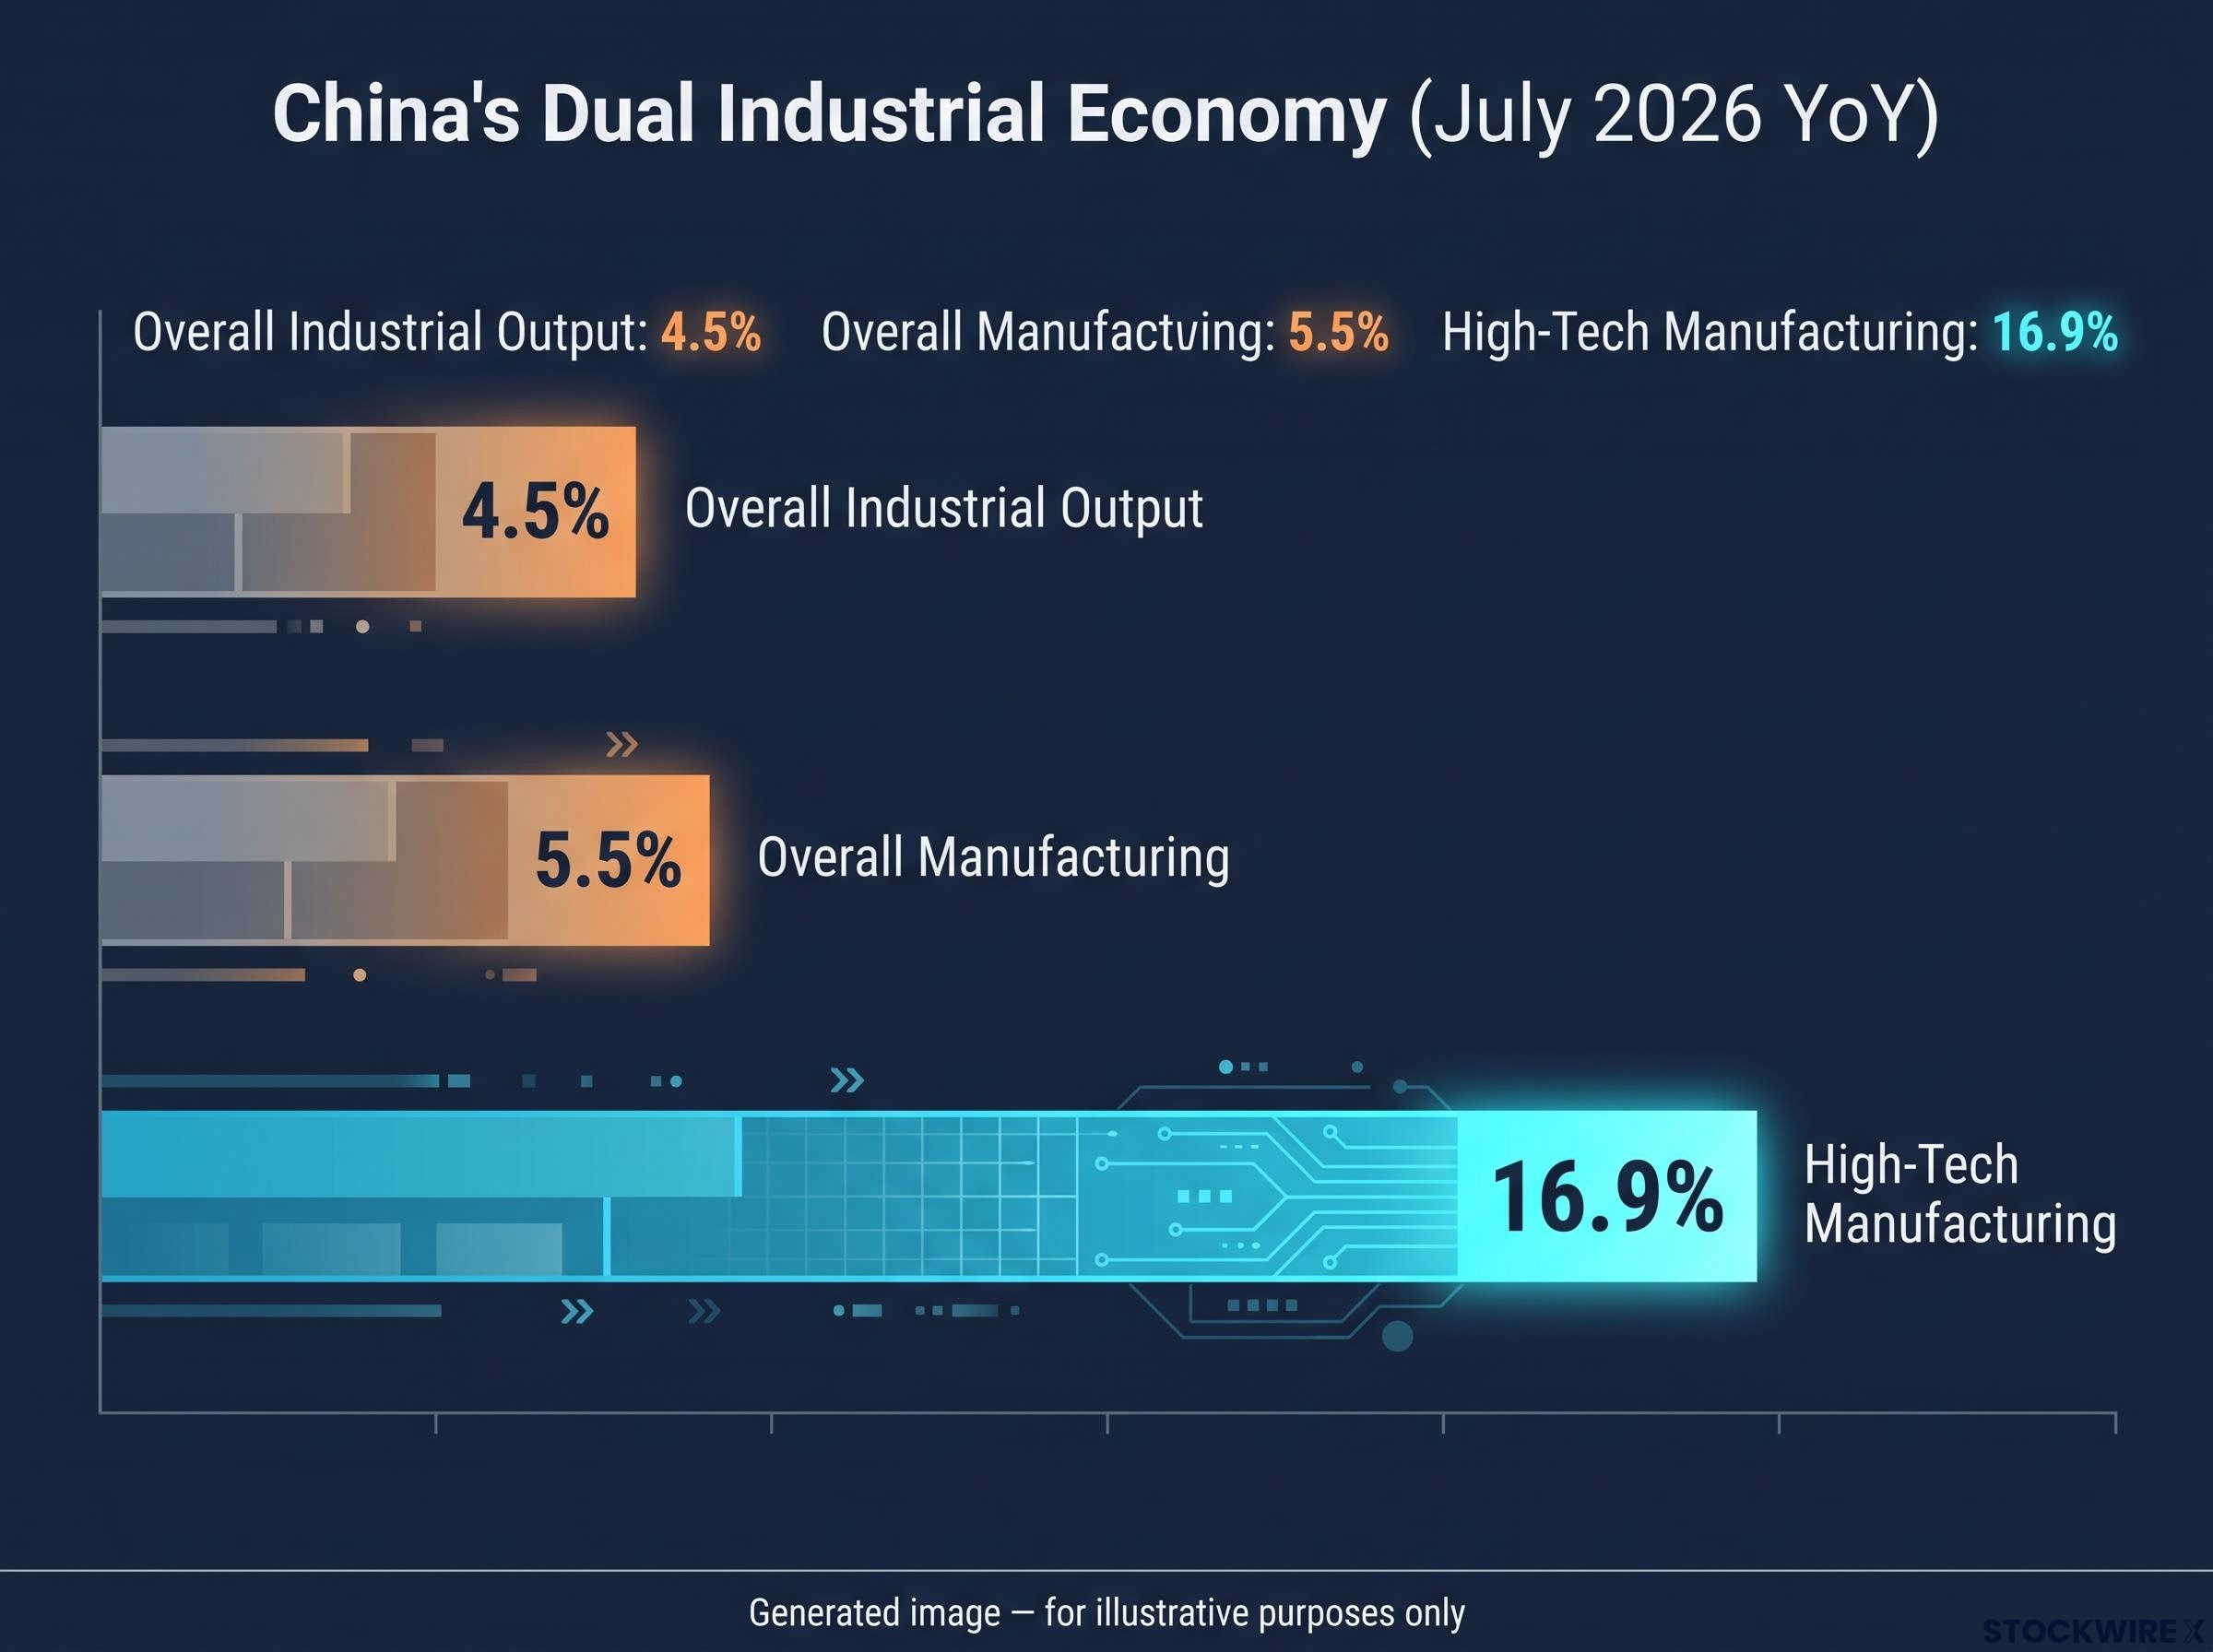
| Metric | July 2026 (YoY) | H1 2026 (YoY) |
|---|---|---|
| Overall industrial output | 4.5% | 5.0-5.4% |
| Overall manufacturing | 5.5% | — |
| High-tech manufacturing | 16.9% | ~13.3% |
ING analyst Lynn Song has pointed to this divergence as a marker of fundamental change in how China’s industrial base is evolving, with technology-intensive sectors displacing conventional manufacturing as the primary engine of output growth. What this tells you is that the aggregate industrial headline is actively concealing the most important thing happening in Chinese manufacturing. Any investment thesis anchored to that headline number alone is working from the wrong data.
The K-shaped divergence now entering its sixth consecutive year, with semiconductor exports compounding against collapsing property investment and negative consumer spending, is the macro architecture inside which the July industrial figures sit.
When big ASX news breaks, our subscribers know first
What is actually growing at 16, 20, and 30 percent
The 16.9% aggregate is itself an average. Beneath it, three sectors are compounding at rates that, taken individually, would each warrant a standalone story.
Semiconductor integrated circuit production rose 20.7% year-on-year in July. This fits a pattern of sustained double-digit expansion as China scales domestic chip and electronics ecosystems, even if much of the volume remains concentrated at mature technology nodes.
New energy vehicle (NEV) output grew 29.9% year-on-year in July. Provincial data reinforce the trend: leading high-tech hubs reported NEV output gains above 20% in the first half, with regional clusters in Zhejiang and Shanghai outpacing national growth.
Industrial robot production expanded 30.2% year-on-year in July. China’s factory-automation push has been one of the most sustained industrial buildouts of the past decade, and the July figure is consistent with that trajectory rather than a deviation from it.
China’s 30.2% industrial robot output growth compounds into a physical AI advantage that conventional AI race scorecards built on semiconductor benchmarks and language model performance fail to capture, because the data advantage accumulating from 2 million deployed robots widens independently of chip export controls.
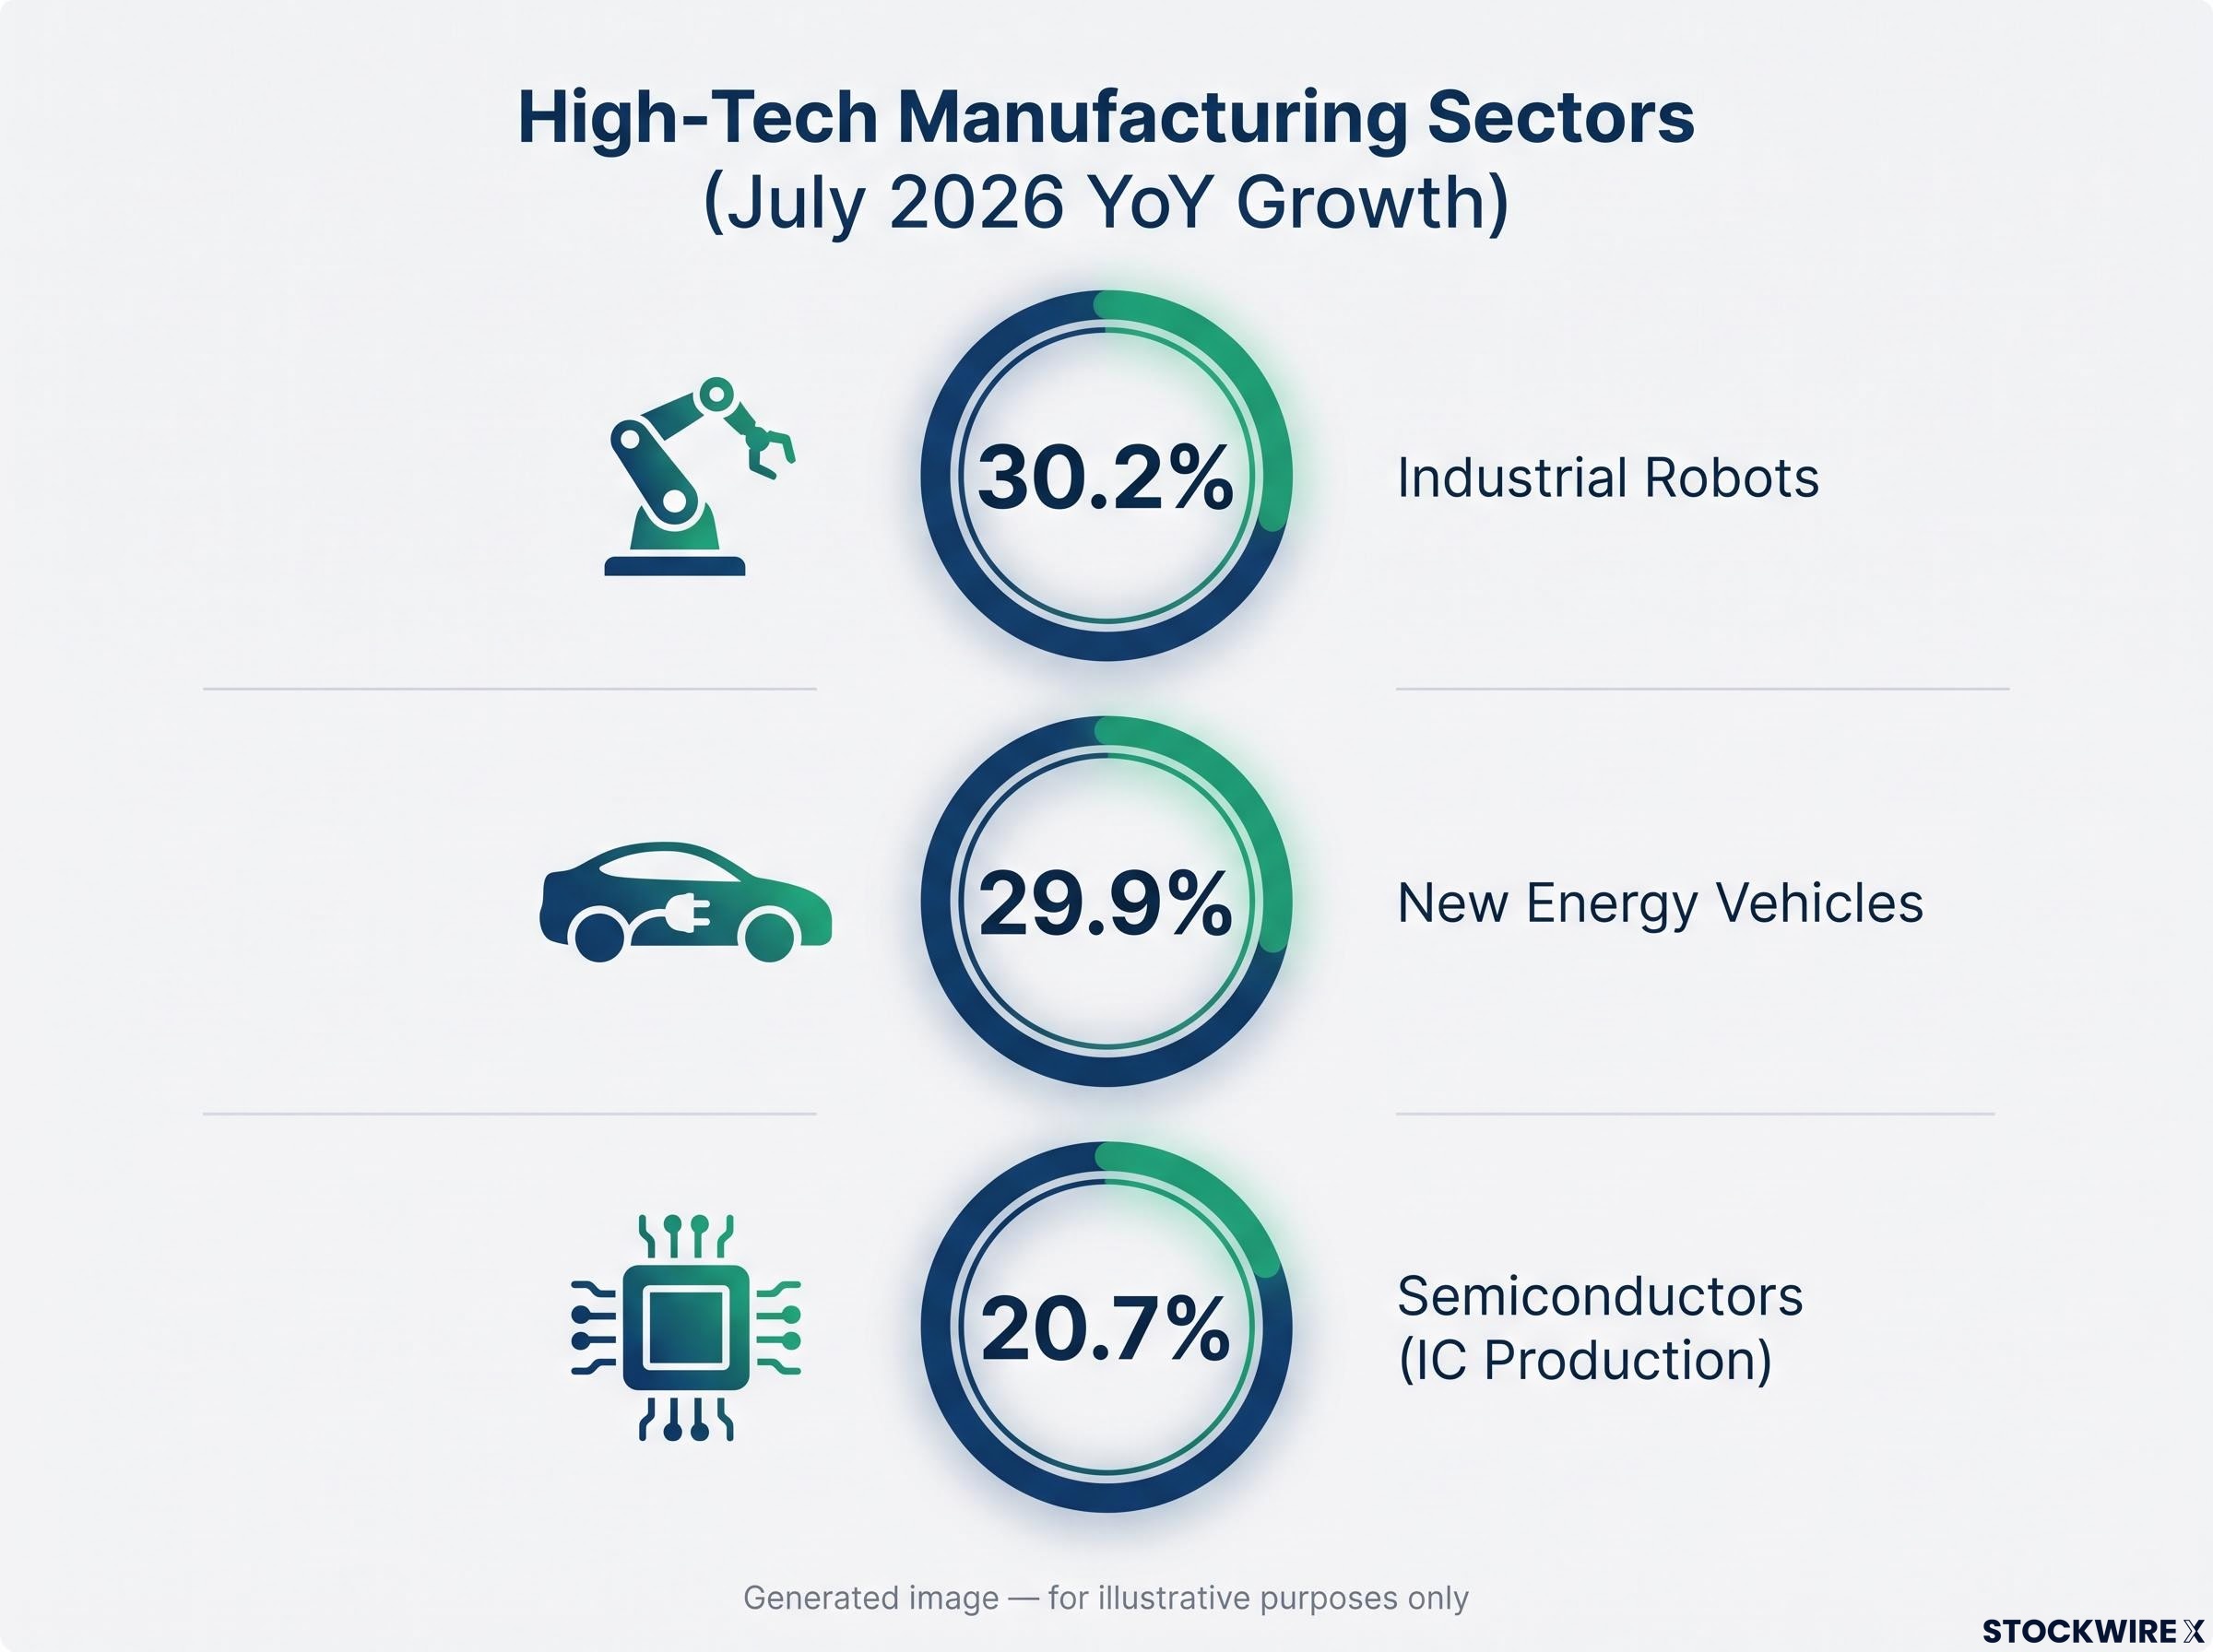
| Sector | July 2026 (YoY) | Trend direction |
|---|---|---|
| Semiconductors (IC production) | 20.7% | Sustained acceleration |
| New energy vehicles | 29.9% | Sustained acceleration |
| Industrial robots | 30.2% | Sustained acceleration |
These are not the only contributors. Other sectors demonstrating strength include:
- Electronics and digital products
- Rail and aerospace equipment
- 3D-printing equipment and lithium-ion batteries
High-tech and digital product manufacturing contributed approximately 48% of industrial value-added growth for major firms in H1 2026. Three unrelated sectors all printing above 20% in the same month means the growth is systemic, not a single-product phenomenon. That is the level at which you should be assessing your exposure.
Why China builds these industries the way it does
Every growth figure cited above carries a variable that changes how you should interpret it: the role of the state.
China’s official policy communications frame high-tech and equipment manufacturing as “new quality productive forces,” a term that signals the deliberate, top-down direction behind the data. These are not sectors that happen to be growing. They are sectors being grown.
The policy architecture supporting this acceleration spans six specific levers:
- Subsidies directed at priority industries including NEVs and AI hardware
- Tax breaks for qualifying high-tech enterprises
- Cheap financing through state-backed lending channels
- Industrial-park infrastructure concentrated in provincial clusters
- Procurement preferences favouring domestic advanced manufacturing
- Regulatory frameworks tilted toward intelligent equipment and new energy
National statistics reinforce the political priority. China’s statistical bureau separately tracks high-tech manufacturing, equipment manufacturing, and digital product output, foregrounding their outperformance. When a government designs its own data architecture to spotlight specific sectors, the policy signal is unmistakable.
The overcapacity tension
Here is where the analytical nuance matters. State backing makes high growth rates both more sustainable (through structural support) and more fragile (through overcapacity and policy-shift risk) than the output figures alone suggest. Domestic NEV pricing pressure is already visible. If you are assessing Chinese manufacturing equities, you need to price in the policy variable explicitly, modelling scenarios around policy continuity and export-control escalation rather than simply extrapolating the growth rate forward.
How China’s industrial shift reaches global supply chains
The production figures above describe what is happening inside China. The supply-chain data describe why it matters everywhere else.
China accounted for approximately 54% of global factory-robot installations in 2024, already more than half of world demand.
That single figure reframes the entire robotics story. A country supplying more than half of the world’s factory automation equipment means global manufacturers are exposed to Chinese industrial policy decisions whether or not they hold a single Chinese equity.
July customs data extend the picture into exports. According to available trade figures, high-tech product exports rose approximately 40.7% year-on-year, with semiconductor exports nearly doubling in value terms. Provincial clusters in Zhejiang and Shanghai were noted as leading high-tech export hubs. (These export figures have not been independently verified beyond initial reporting and should be treated with appropriate caution.)
The three primary supply-chain exposure vectors for global investors and multinationals are:
- Factory automation: China’s dominant share of global robot installations makes production equipment sourcing decisions directly sensitive to Chinese pricing and policy
- EV and battery supply chains: NEV output growth at nearly 30% means component and platform dependencies are deepening across global automakers and their tier-one suppliers
- Semiconductor and electronics components: Even concentrated at mature nodes, the scale of China’s chip production expansion creates meaningful supply exposure for any business sourcing mid-range chips or electronic components
This is not purely a domestic capacity story. Chinese advanced manufacturing is actively capturing external market share, and the sensitivity of global production networks to Chinese policy and geopolitics is rising accordingly.
Factory-gate inflation running at 4.1% year-on-year in June 2026, its fastest pace since July 2022, sits alongside the output acceleration the July data reveals; Chinese manufacturers paying rising input costs for metals, energy, and chips while selling into a domestic base with weak consumer pricing power are absorbing a margin squeeze that has not yet fully transmitted into global export prices.
What this means if you are allocating to China or modelling EM risk
If you run an index-level China allocation, you are now bundling two fundamentally different growth stories into one line item. Advanced manufacturing is accelerating. Legacy sectors are stagnating. Treating the allocation as monolithic understates both the upside in one half and the risk concentration in the other.
The emerging-market risk model problem is more structural. Traditional factor models weighted toward property, infrastructure, and commodity exposure systematically misread China’s current correlation profile. Performance in Chinese equities and credit is now more tied to technology cycles, export controls, and innovation policy than to commodity prices or construction activity. High-tech and digital products contributed approximately 48% of major-firm industrial value-added growth in H1 2026. Standard EM weightings calibrated to property and materials are not just stale; they are carrying unpriced tail risk in sectors where policy and geopolitics now dominate the return distribution.
Three analytical adjustments worth making now
- Disaggregate sector-level data when assessing macro exposure. The 16.9% versus 4.5% divergence is the quantitative case for never treating the headline as sufficient. Separate high-tech and equipment manufacturing metrics from legacy sectors in every macro read.
- Anchor fundamental work in advanced manufacturing clusters. Robots, EVs, batteries, semiconductors, and AI hardware, concentrated in provincial ecosystems like Zhejiang and Shanghai, are now where incremental growth lives. Company-level analysis must be anchored here, not derived from aggregate industrial readings.
- Incorporate policy risk and export-control scenario analysis explicitly in valuations. For Chinese semiconductor and EV-related names, state support is both an accelerant and a source of risk. Scenario analysis around policy continuity and trade restriction escalation should be standard practice, not optional.
The structural case is clear; the valuation question is not
The evidence base is substantial. The divergence between headline industrial growth and high-tech manufacturing performance is persistent across H1 2026 and accelerating in July. It is multi-sector, spanning robotics, EVs, and semiconductors simultaneously. It is export-validated, with high-tech product exports growing at multiples of the broader rate. And it is policy-backed, with a state architecture explicitly designed to sustain it.
The structural transformation is real. The harder question is what it is worth.
Structural transformation and overcapacity can coexist. The July data alone does not resolve which sectors are building durable competitive positions versus policy-dependent capacity that will face pricing pressure as domestic markets saturate. The early-warning signal to watch is domestic pricing compression in NEVs and mid-range semiconductors. The primary tail risk requiring explicit scenario modelling is export-control escalation.
For investors modelling export-control escalation as a tail risk, our deep-dive into the optical transceiver supply gap examines how a single FCC rulemaking targeting Chinese manufacturers who control two-thirds of global supply could open a 12-24 month gap in AI infrastructure build-outs.
The structural story is confirmed by the data. Acting on it requires a framework capable of distinguishing the two very different futures embedded in the same growth figures.
The analytical work that matters most now is not whether China’s industrial economy is transforming. It is separating the sectors where transformation creates durable earnings power from those where state-backed capacity is running ahead of sustainable demand.
This article is for informational purposes only and should not be considered financial advice. Investors should conduct their own research and consult with financial professionals before making investment decisions. Forward-looking statements regarding China’s industrial policy direction and sector growth trajectories are subject to change based on policy developments, trade conditions, and market dynamics.