Commonwealth Bank of Australia commands more column inches for its share price than almost any other name on the ASX. But for a growing cohort of retail investors, the price is secondary. The dividend stream is the point.
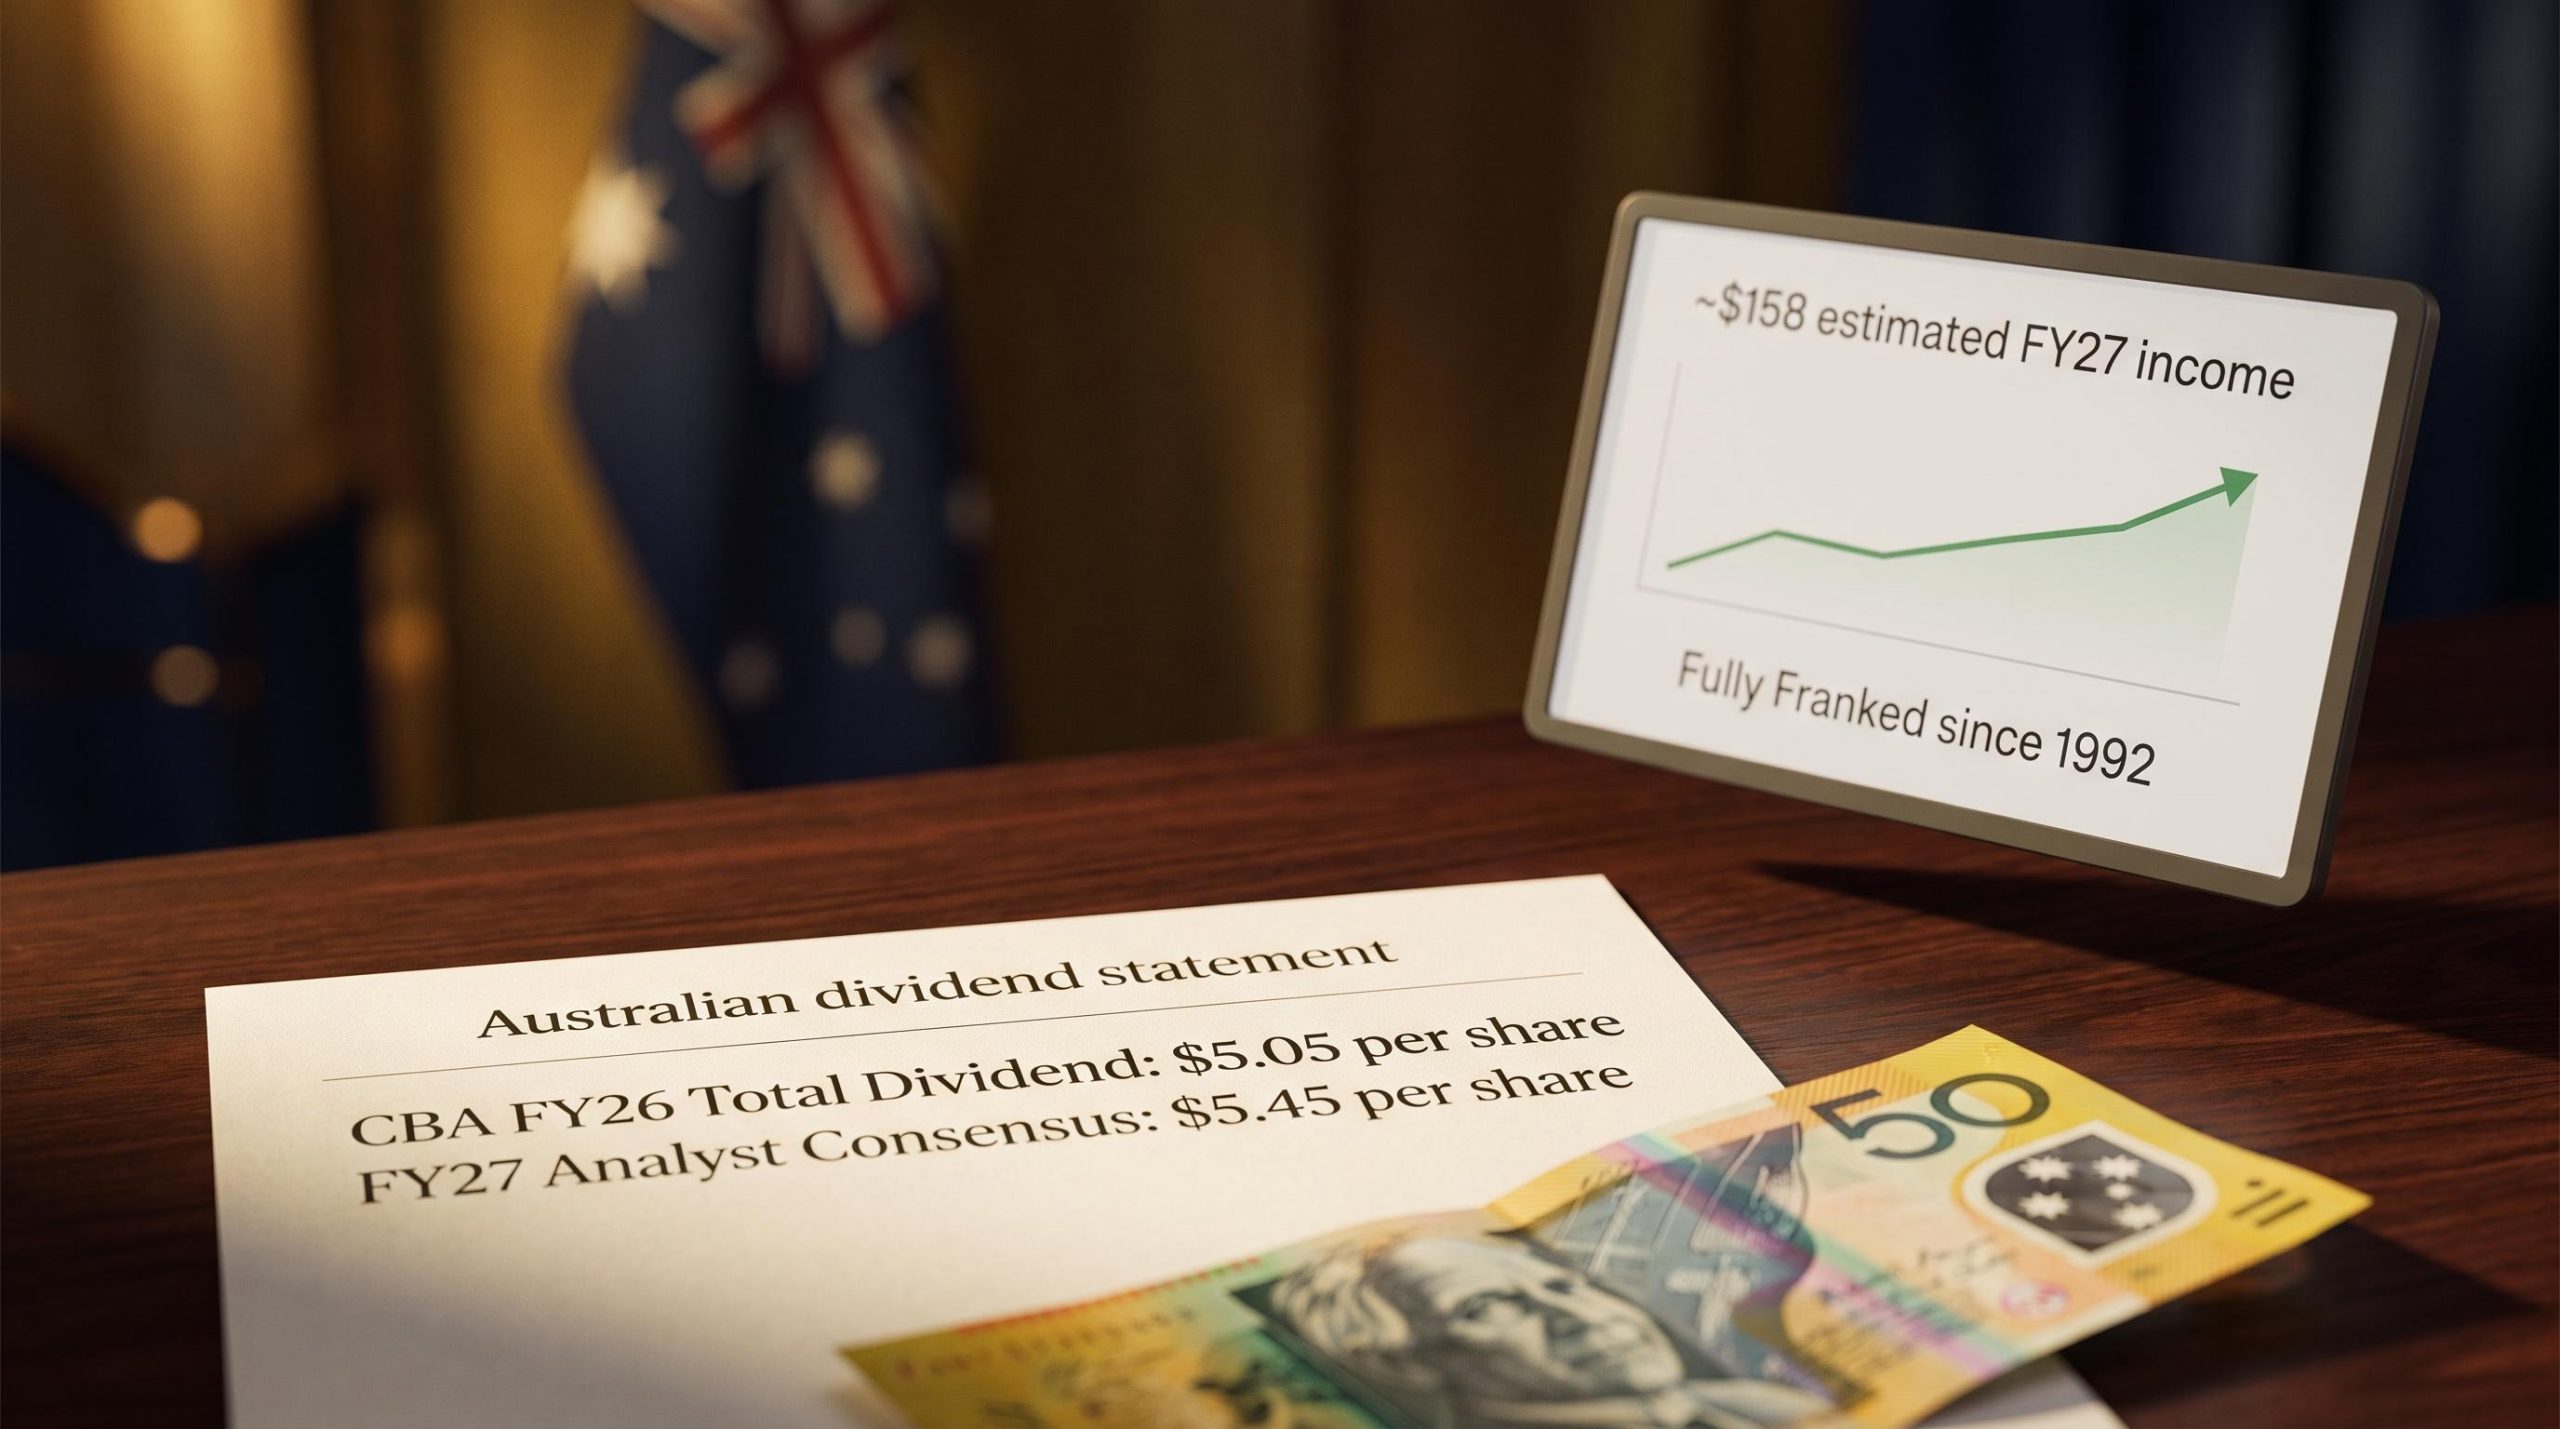
CBA has paid fully franked dividends without interruption since 1992. That is not a marketing line; it is a verifiable record stretching across recessions, a pandemic, and multiple credit cycles. With FY26 figures now confirmed and FY27 analyst forecasts available, the income case has more data behind it than at most points in the year.
The share price sits around $168 in mid-August 2026, which means a retail investor can model income from a CBA holding with unusual precision right now. Here is exactly what a $5,000 investment pays in dividends, where that figure is heading in FY27, and why the franking credit layer changes what those numbers are actually worth to an Australian resident shareholder.
CBA’s dividend track record: why consistency matters for income investors
Three decades of uninterrupted fully franked payments is not just a historical footnote. It is the primary reason income-focused investors treat CBA differently from other ASX large-caps, and it is worth understanding what that consistency actually signals.
CBA’s dividend record is a quality marker for investors who plan around cash flow rather than capital gains. When a company pays without interruption through the Global Financial Crisis, a mining downturn, and a pandemic, it tells you something about how the board prioritises payout stability relative to earnings volatility. That distinction matters more to income investors than the headline yield on any given day.
The structural features that underpin this reliability are straightforward:
- Payment frequency: Semi-annual, splitting the income stream into two predictable instalments per year
- Payment months: Interim dividend in March, final dividend in September
- Franking status: All dividends fully franked at the 30% corporate tax rate
This article sits firmly in the income camp. CBA as a capital gains play is a different conversation with different metrics. The question here is narrower and more practical: what does this stock actually pay you?
When big ASX news breaks, our subscribers know first
What FY26 confirmed: the numbers behind the income claim
Before any forecasting enters the picture, the FY26 numbers are locked in. CBA has paid both dividends, the figures match the company’s official profit announcement, and the income calculation that follows is arithmetic, not projection.
| Component | Amount per Share | Payment Month |
|---|---|---|
| Interim dividend (1H26) | $2.35 | March 2026 |
| Final dividend (2H26) | $2.70 | September 2026 |
| Total FY26 | $5.05 | Full year |
At a share price of around $168, a $5,000 investment secures approximately 29 shares. Multiply 29 by the confirmed $5.05 per share and the result is approximately $146 in annual dividend income, fully franked, split across two payments. That is not an estimate. It is a confirmed figure derived from corporate disclosures.
The simple cash yield on those numbers comes to approximately 3.0% ($5.05 divided by approximately $168), though published yields vary between roughly 2.6% and 3.0% depending on data source and methodology. What matters for the income investor is the dollar figure: $146, calculable and verifiable.
What analysts are forecasting for FY27
FY26 is settled. FY27 is where the forward-looking view takes over, and the analyst consensus provides a bounded estimate rather than a single precise number.
The current FY27 dividend forecast range sits at $5.25 to $5.45 per share, fully franked. The upper end, $5.45, reflects the analyst consensus, which currently clusters near that figure. The lower end, $5.25, is a deliberately conservative assumption rather than a published analyst target; it provides a floor for scenario planning.
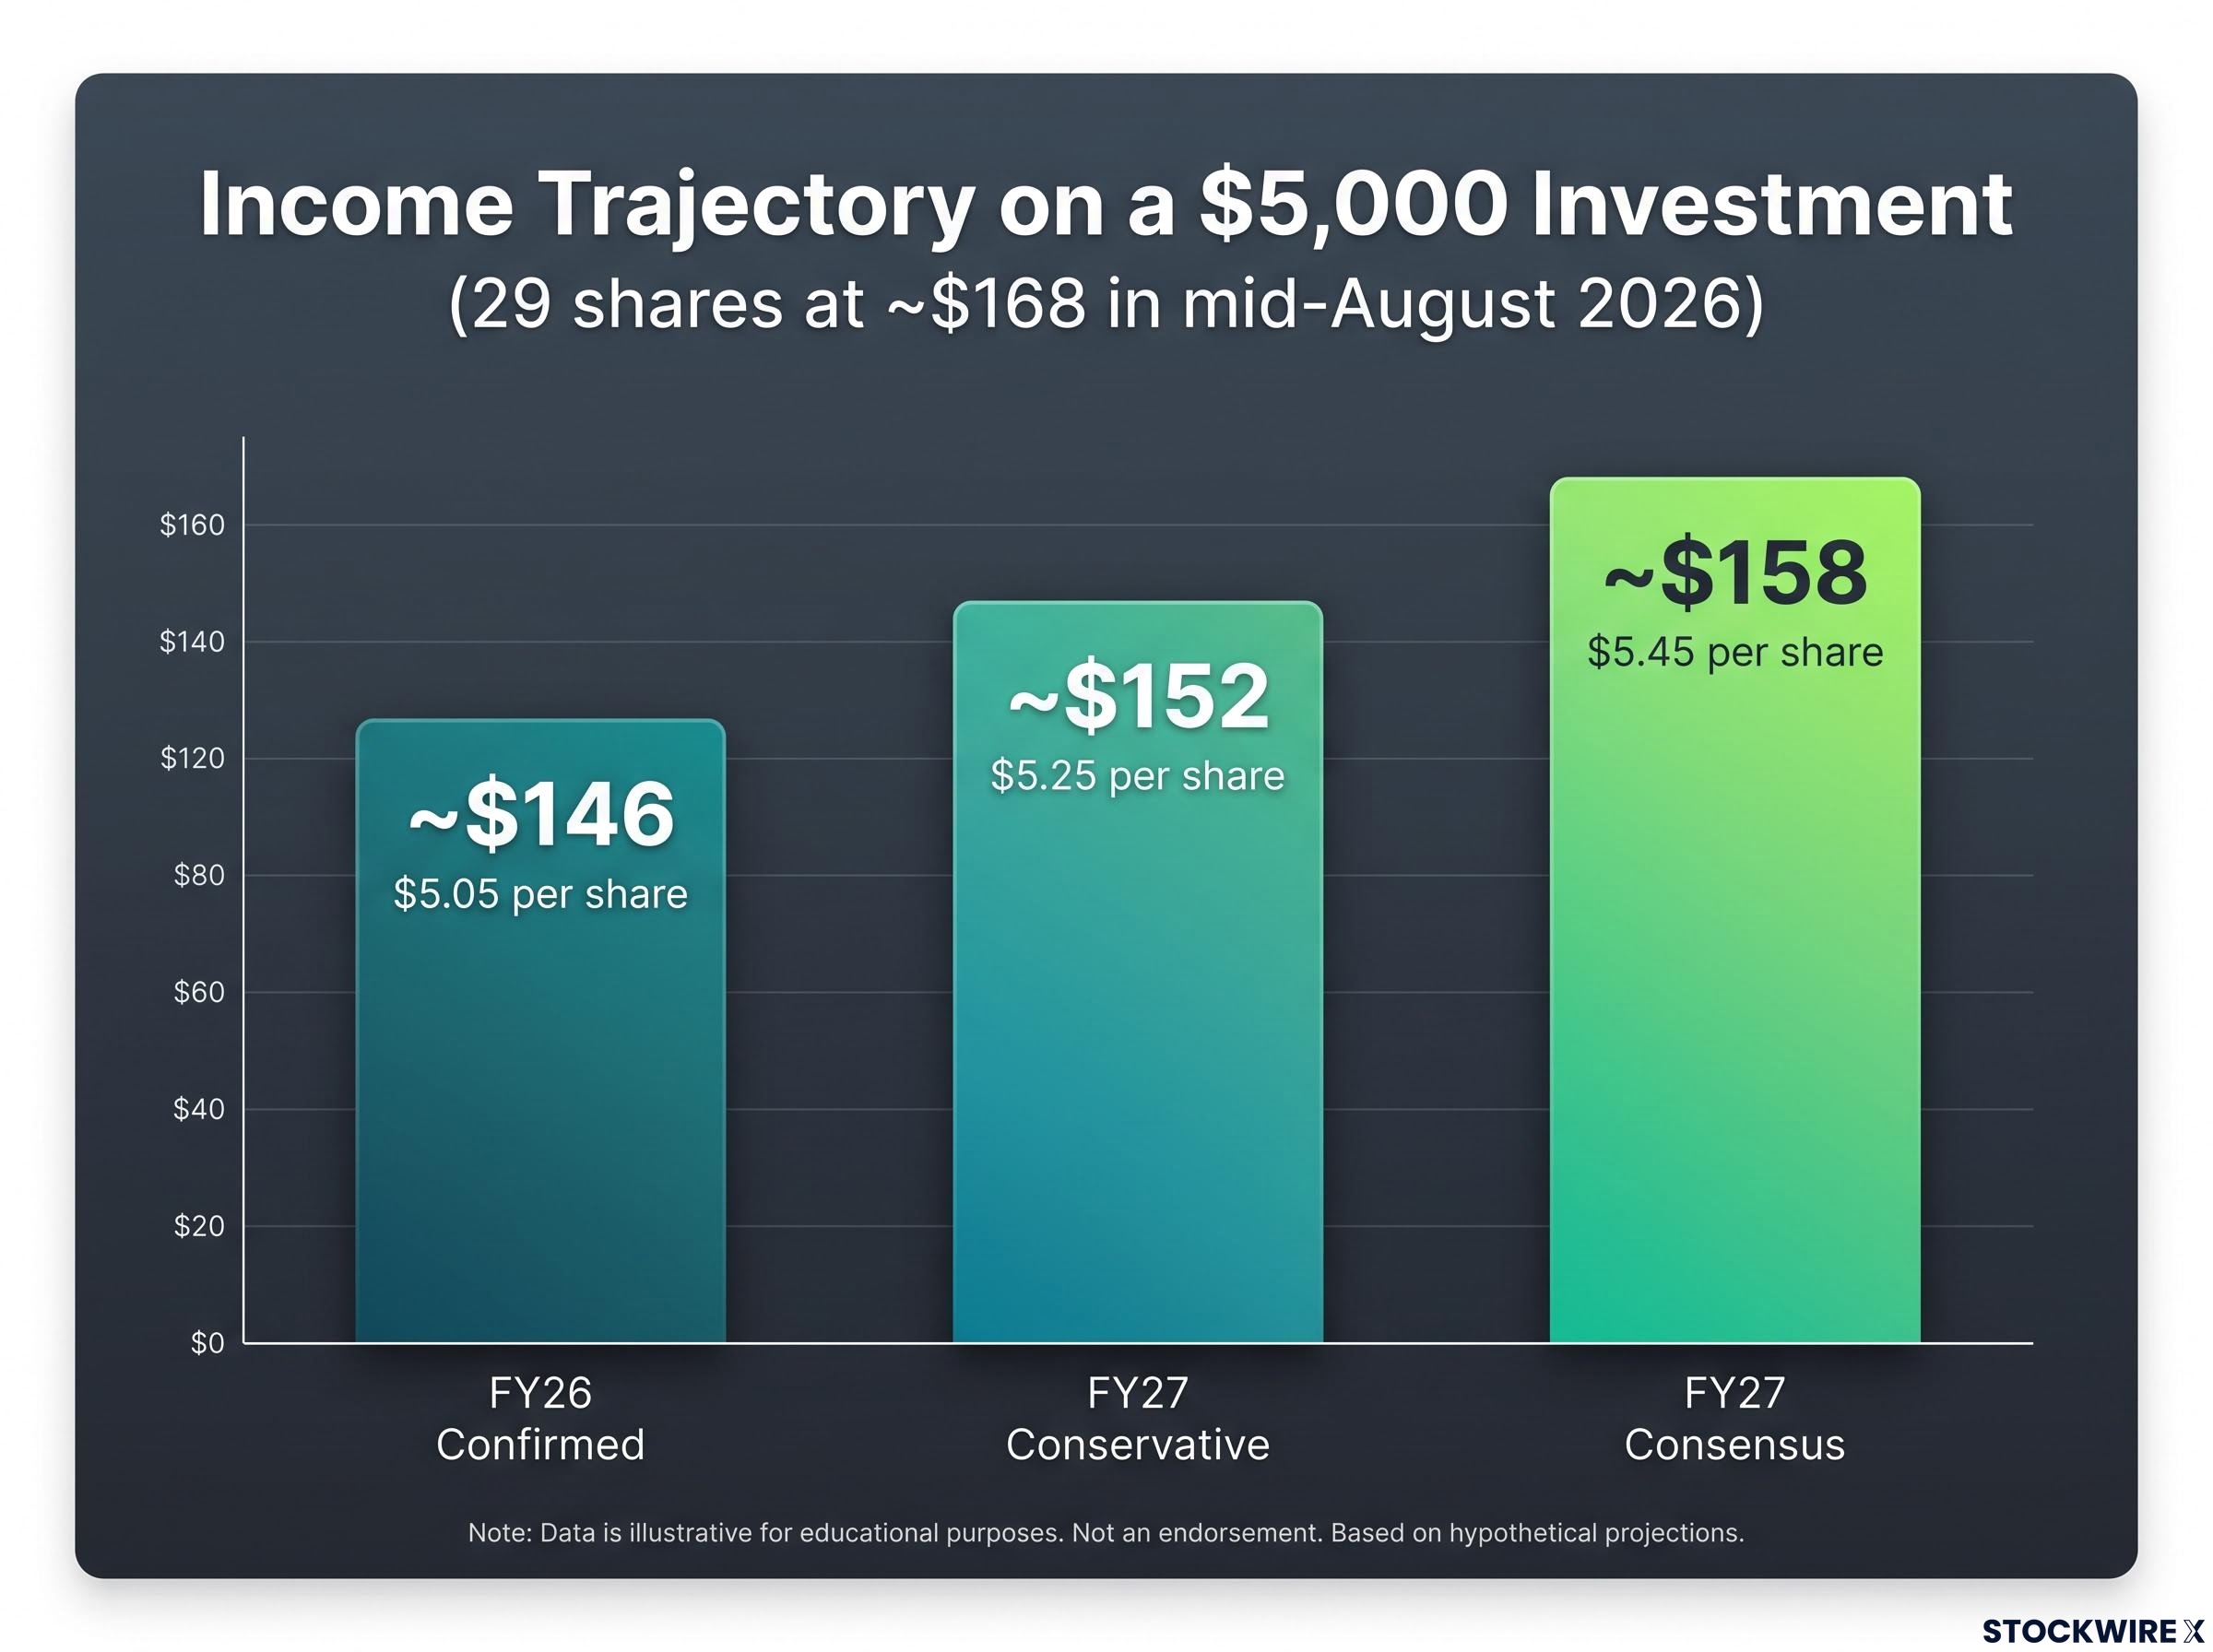
| Financial Year | Dividend per Share | Basis | Estimated Income on 29 Shares |
|---|---|---|---|
| FY26 | $5.05 | Confirmed actual | ~$146 |
| FY27 (conservative) | $5.25 | Conservative lower-bound estimate | ~$152 |
| FY27 (consensus) | $5.45 | Analyst consensus | ~$158 |
“A $5,000 CBA investment confirmed approximately $146 in FY26 dividend income, with analyst consensus pointing toward approximately $158 by FY27.”
What the $146 to $158 range across the two financial years tells you is that the dividend is not just maintainable; it appears to be on a modest growth trajectory. For investors evaluating CBA as a long-term income position, that trajectory matters more than any single year’s figure. The forward yield on the FY27 range comes to approximately 3.2% at a share price around $168, though yield moves with price. Forecasts remain subject to revision.
Dividend yield moves inversely with share price, so a CBA price decline toward analyst consensus targets would lift the yield figure without the company paying a single dollar more per share, a dynamic that makes the metric a useful starting filter but an incomplete basis for income decisions on its own.
Franking credits and what they mean for your actual return
The approximately 3% cash yield cited throughout this article is only part of the picture for Australian resident shareholders. Fully franked dividends carry an attached tax credit that changes the effective return, and understanding the mechanics is worth a few minutes.
Franking credits represent tax the company has already paid on its profits at the corporate rate. When CBA pays a fully franked dividend, it passes along a credit for that 30% corporate tax already paid. The shareholder then uses that credit against their personal income tax liability. Three points matter:
The standard method for franking credit calculations applies the 30/70 formula to each dividend payment, so a $2.70 final dividend from CBA carries an attached credit of approximately $1.16 per share, a figure that changes the effective return for Australian resident shareholders across every tax bracket.
- What fully franked means: CBA has paid corporate tax at 30% on the profits from which the dividend is distributed, and the full credit for that tax is passed to the shareholder
- How credits offset tax: The franking credit reduces the amount of personal income tax owed on the dividend income; it is not a bonus payment but a recognition that tax has already been paid at the corporate level
- Refundability for eligible investors: Shareholders whose marginal tax rate falls below 30%, or who have taxable income below the tax-free threshold, may receive a cash refund for the excess credit
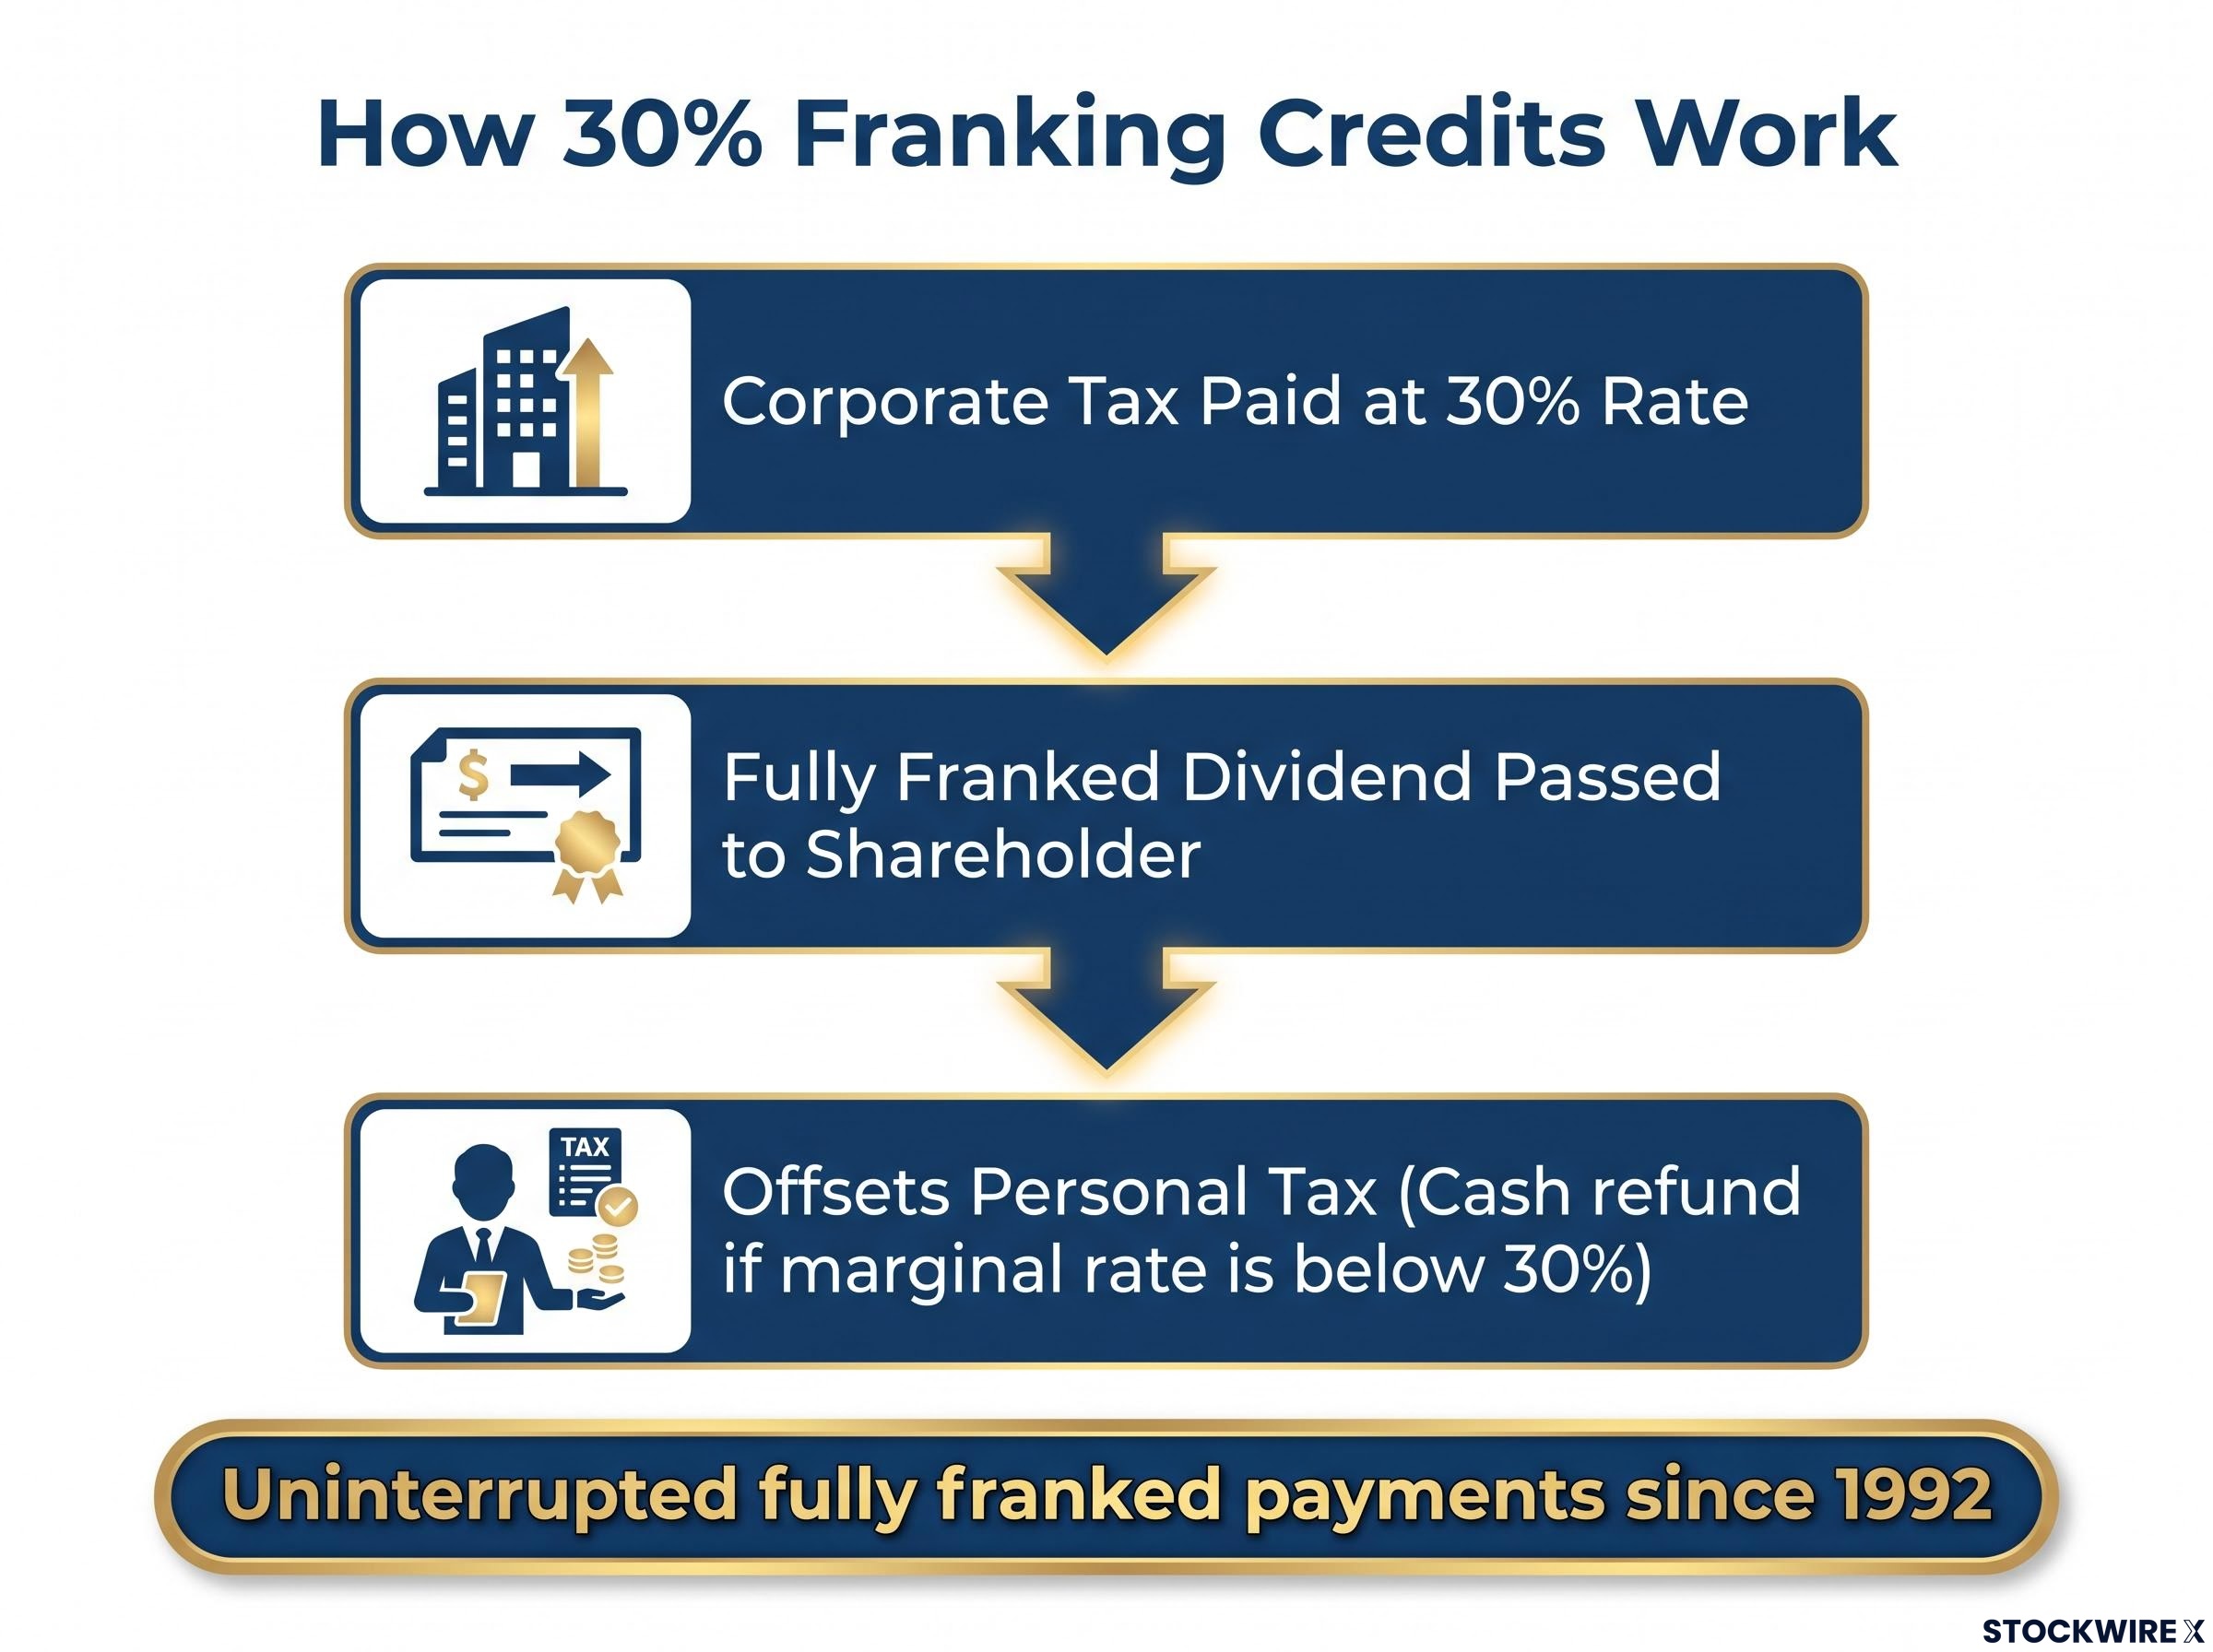
The cash yield of approximately 3% excludes the value of franking credits. For eligible Australian resident shareholders, the grossed-up yield, which accounts for credits already paid at the corporate rate, is higher. The precise benefit depends on your marginal tax rate and individual circumstances.
If you are comparing CBA’s income stream against term deposits, bonds, or unfranked dividend alternatives, the franking credit layer is the variable that makes a direct yield comparison misleading without adjustment.
RBA research on dividend imputation value quantifies the degree to which tax paid at the corporate level translates into genuine economic benefit for resident shareholders, reinforcing why a direct yield comparison between franked dividends and term deposits or unfranked alternatives requires an explicit adjustment for the credit layer.
This article is for informational purposes only and should not be considered financial advice. Investors should conduct their own research and consult with financial professionals before making investment decisions.
Sizing up the income case before you act
The evidence assembled across this article gives you a structured basis for evaluation. Here is what sits in the confirmed column, and what remains variable.
Three confirmed positives:
- An uninterrupted fully franked dividend record dating back to 1992
- Confirmed FY26 income of approximately $146 on a $5,000 holding (29 shares at around $168)
- Analyst consensus pointing toward modest dividend growth in FY27, with income on the same holding estimated at approximately $152 to $158
Three variables that shift the outcome:
- Share price at entry: A higher entry price reduces yield and share count on a $5,000 investment; a lower price increases both
- FY27 forecast certainty: The consensus currently clusters near $5.45 per share, but analyst estimates are subject to revision based on CBA’s earnings trajectory
- Individual tax position: The value of franking credits varies by your marginal tax rate, and the grossed-up yield that matters to you personally depends on circumstances only you and your tax adviser can assess
The income figures in this article, a cash yield range of approximately 2.6% to 3.0% before franking, are a starting point for personal financial evaluation. They are not a guarantee, and past dividends do not assure future payments.
Past performance does not guarantee future results. Financial projections are subject to market conditions and various risk factors.
What FY26’s confirmation changes for income investors in FY27
FY26’s confirmed $5.05 per share does more than close the books on one financial year. It validates the baseline from which the FY27 consensus is built. When analysts project approximately $5.45 for FY27, they are doing so against a demonstrated payout, not an assumption. That narrows the gap between expectation and evidence, which is the primary source of conviction for income investors.
The CBA dividend forecast for FY27 is currently one of the more data-supported income cases available to ASX dividend investors. You have a 33-year track record of uninterrupted fully franked payments, a confirmed FY26 result that met expectations, and a consensus estimate that implies modest growth. The income range on a $5,000 holding, approximately $146 confirmed in FY26 through to approximately $158 at FY27 consensus, gives you a narrow, calculable band to plan around.
Investors evaluating an income target at scale, rather than the $5,000 entry point modelled here, face materially different capital requirements; at the FY27 forecast of $5.45 per share, generating $10,000 in annual cash dividends requires approximately 1,835 shares and a capital outlay in the range of $275,000 at current price levels.
The next confirmation point arrives with CBA’s FY27 interim dividend announcement, expected in early calendar 2027. That figure will be the first real test of whether the FY27 full-year consensus holds or requires revision.
Until then, the evidence sits where it is: confirmed, franked, and growing modestly. What you do with it depends on your income objectives, your tax position, and whether the yield, after accounting for franking credits, meets your threshold relative to alternatives. The data is here. The decision is yours.
For investors whose objective extends beyond a single stock position to generating a full retirement income from ASX shares, our comprehensive walkthrough of living off dividends in Australia covers the capital benchmarks required to meet the ASFA comfortable retirement standard and the tax structures that most efficiently convert franked dividends into retirement income.