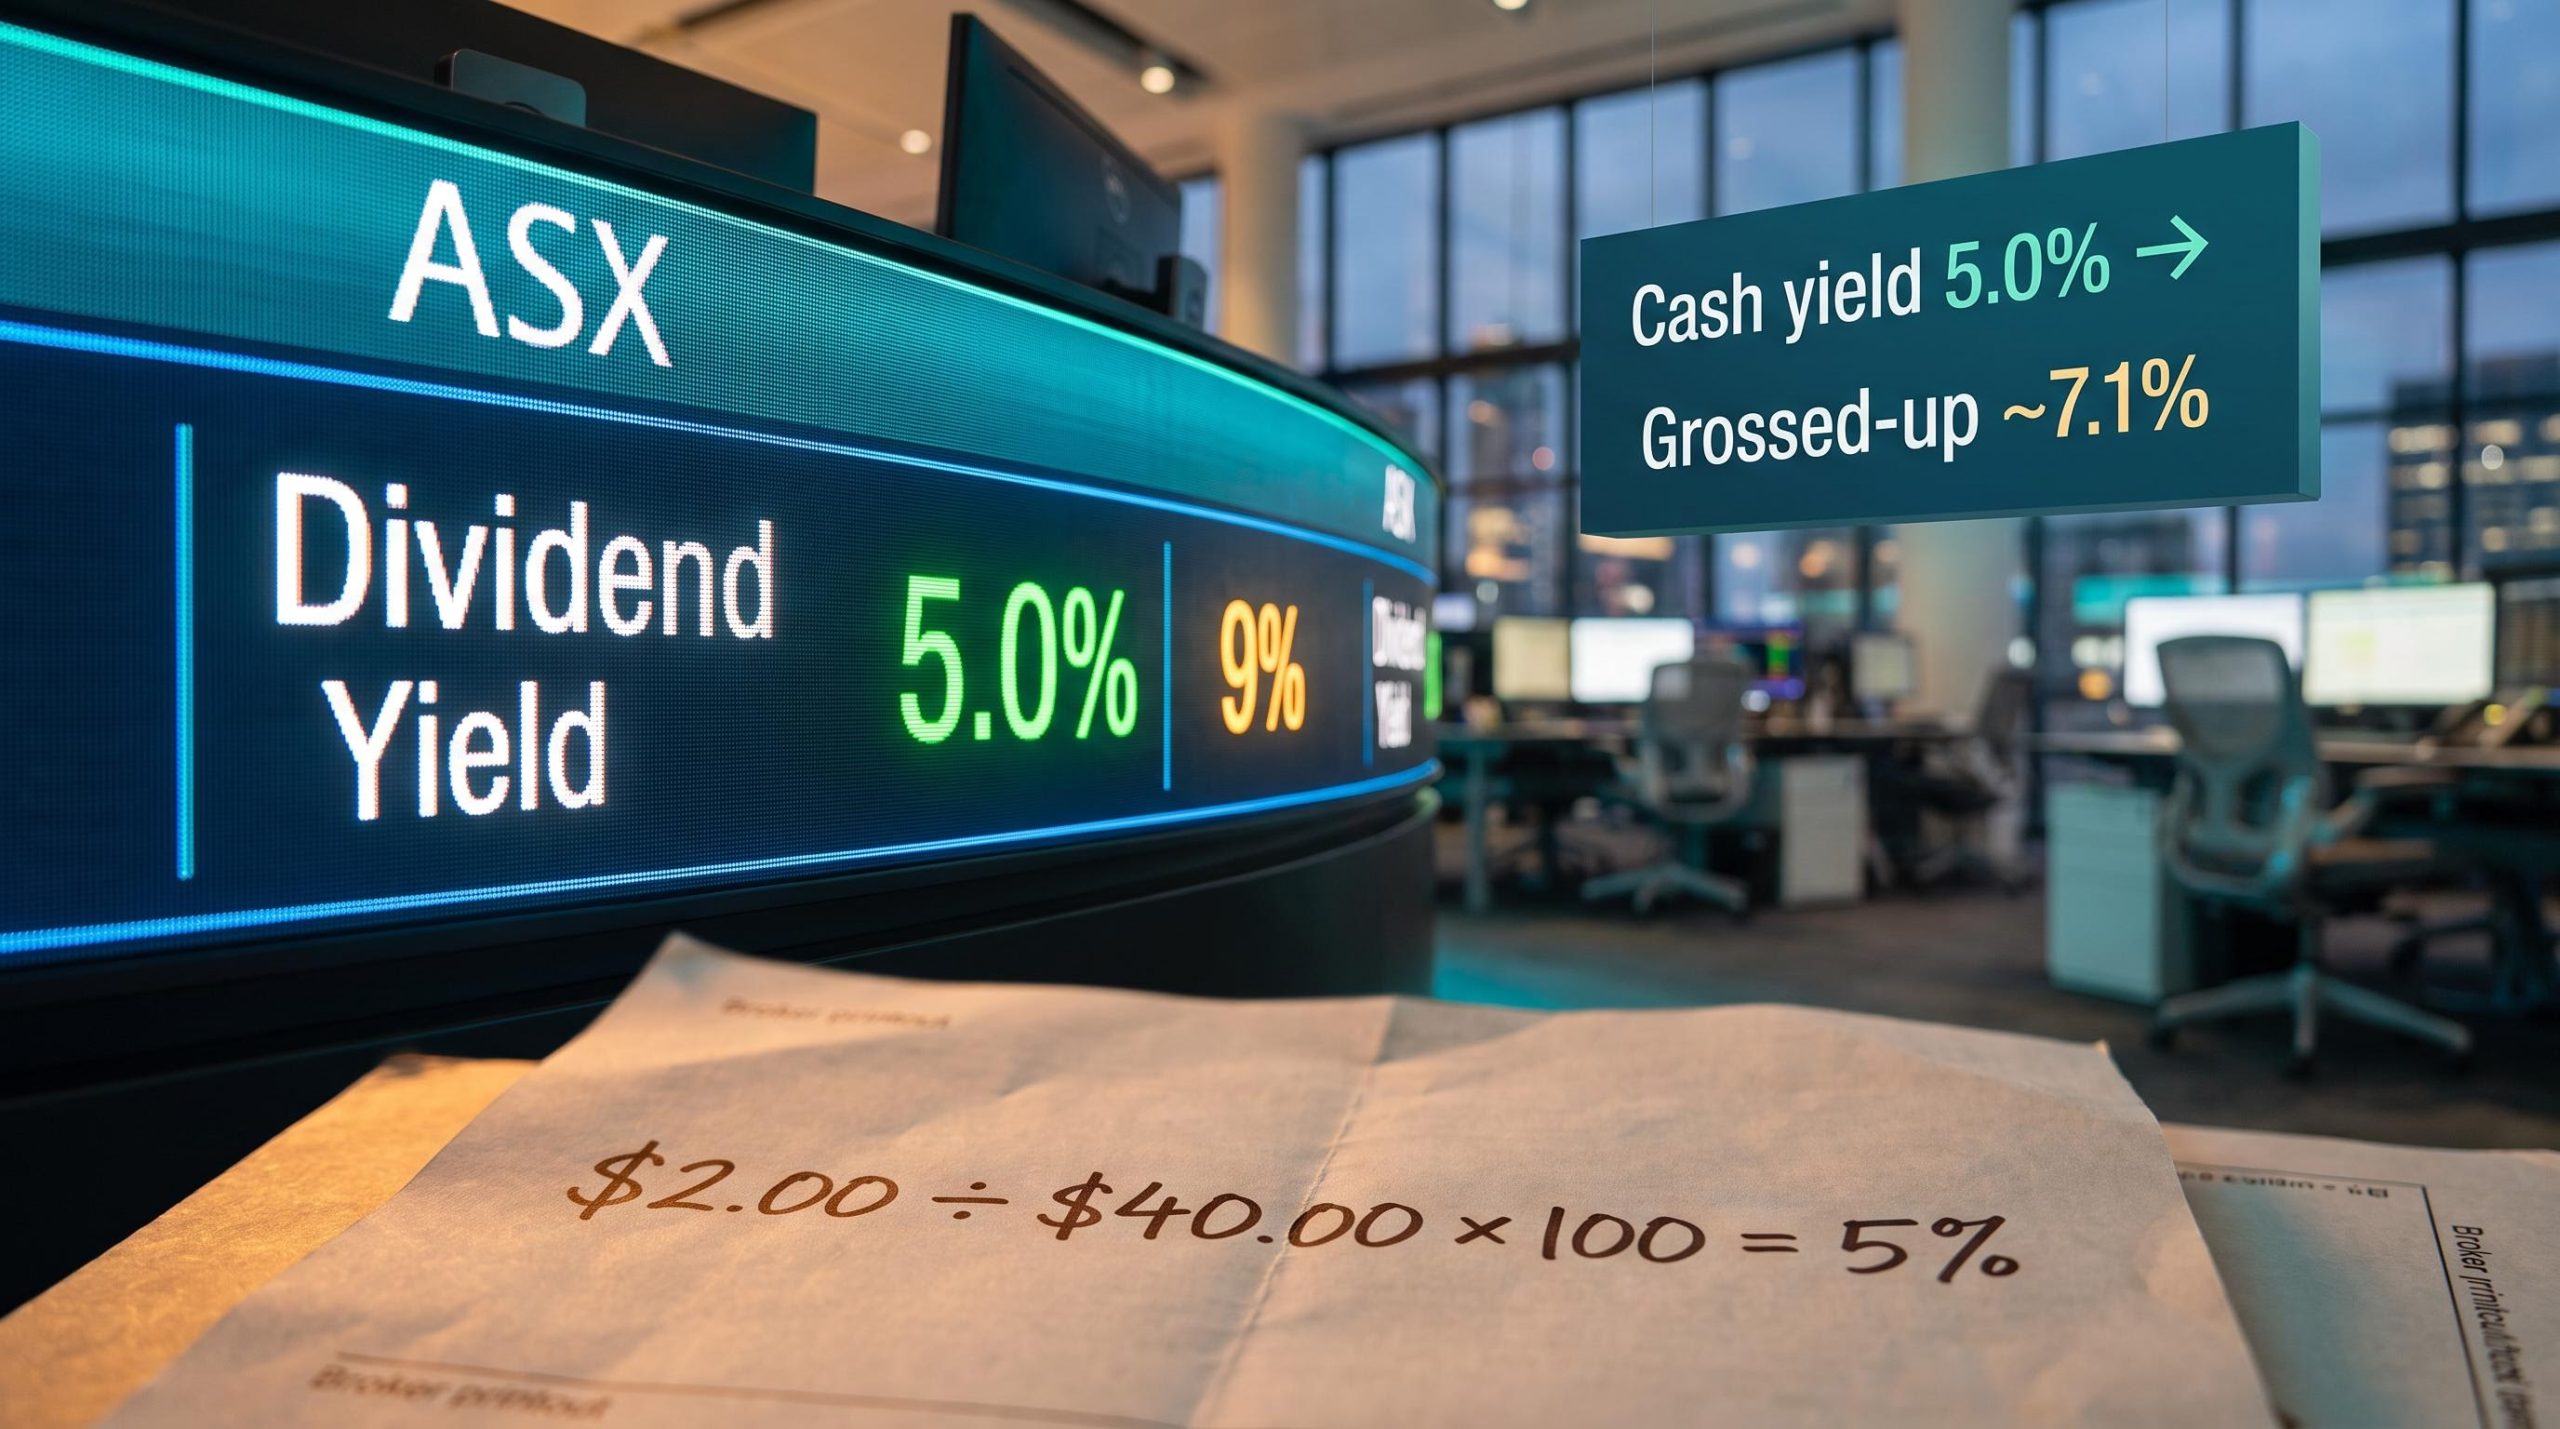
A stock yielding 9% sounds like a gift until you realise the yield doubled in a fortnight because the share price halved. The number did not improve; the denominator collapsed. That single scenario captures why dividend yield is one of the most quoted and most misunderstood metrics on any broker platform.
You see dividend yield on every ASX screener, every ETF factsheet, every comparison table in the financial press. Most investors encounter the number long before they understand what moves it, what distorts it, or what it leaves out entirely.
Here is what this piece gives you: the exact calculation behind the percentage, the mechanical reason the same stock’s yield changes daily without the company doing anything, and a practical framework for using the number without being misled by it.
What dividend yield actually measures
Dividend yield tells you how much cash income you receive from dividends for every dollar you have invested in a stock, expressed as a percentage. It is a ratio with two inputs.
Dividend yield formula: Annual dividends per share ÷ current share price × 100
The formula standardises income across different share prices. That is its core job. A stock trading at $10 paying $0.50 and a stock trading at $80 paying $4.00 both yield 5%, which makes them directly comparable on an income basis even though their dollar payouts look very different.
Here is how it works with a concrete example:
- Inputs: A stock trades at $40 per share. It pays $2.00 per share in total annual dividends.
- Calculation: $2.00 ÷ $40.00 × 100 = 5%.
- Income output: A $1,000 investment at that price buys 25 shares, generating approximately $50 in dividend income per year before tax.
That $50 figure is what makes the abstract percentage feel real. It is the cash your capital produces, separate from any share price movement.
It is worth flagging two important points early on. Across the ASX, a significant number of listed companies pay no dividends at all, preferring to channel earnings back into the business, which leaves them with a yield of zero. Beyond that, no dividend is ever contractually guaranteed, no matter how consistent a company’s payment history appears. Most ASX companies follow a semi-annual payment rhythm, distributing an interim dividend and a final dividend across the year, which differs from the quarterly cadence common among US-listed companies.
When big ASX news breaks, our subscribers know first
How share price movement drives yield up and down
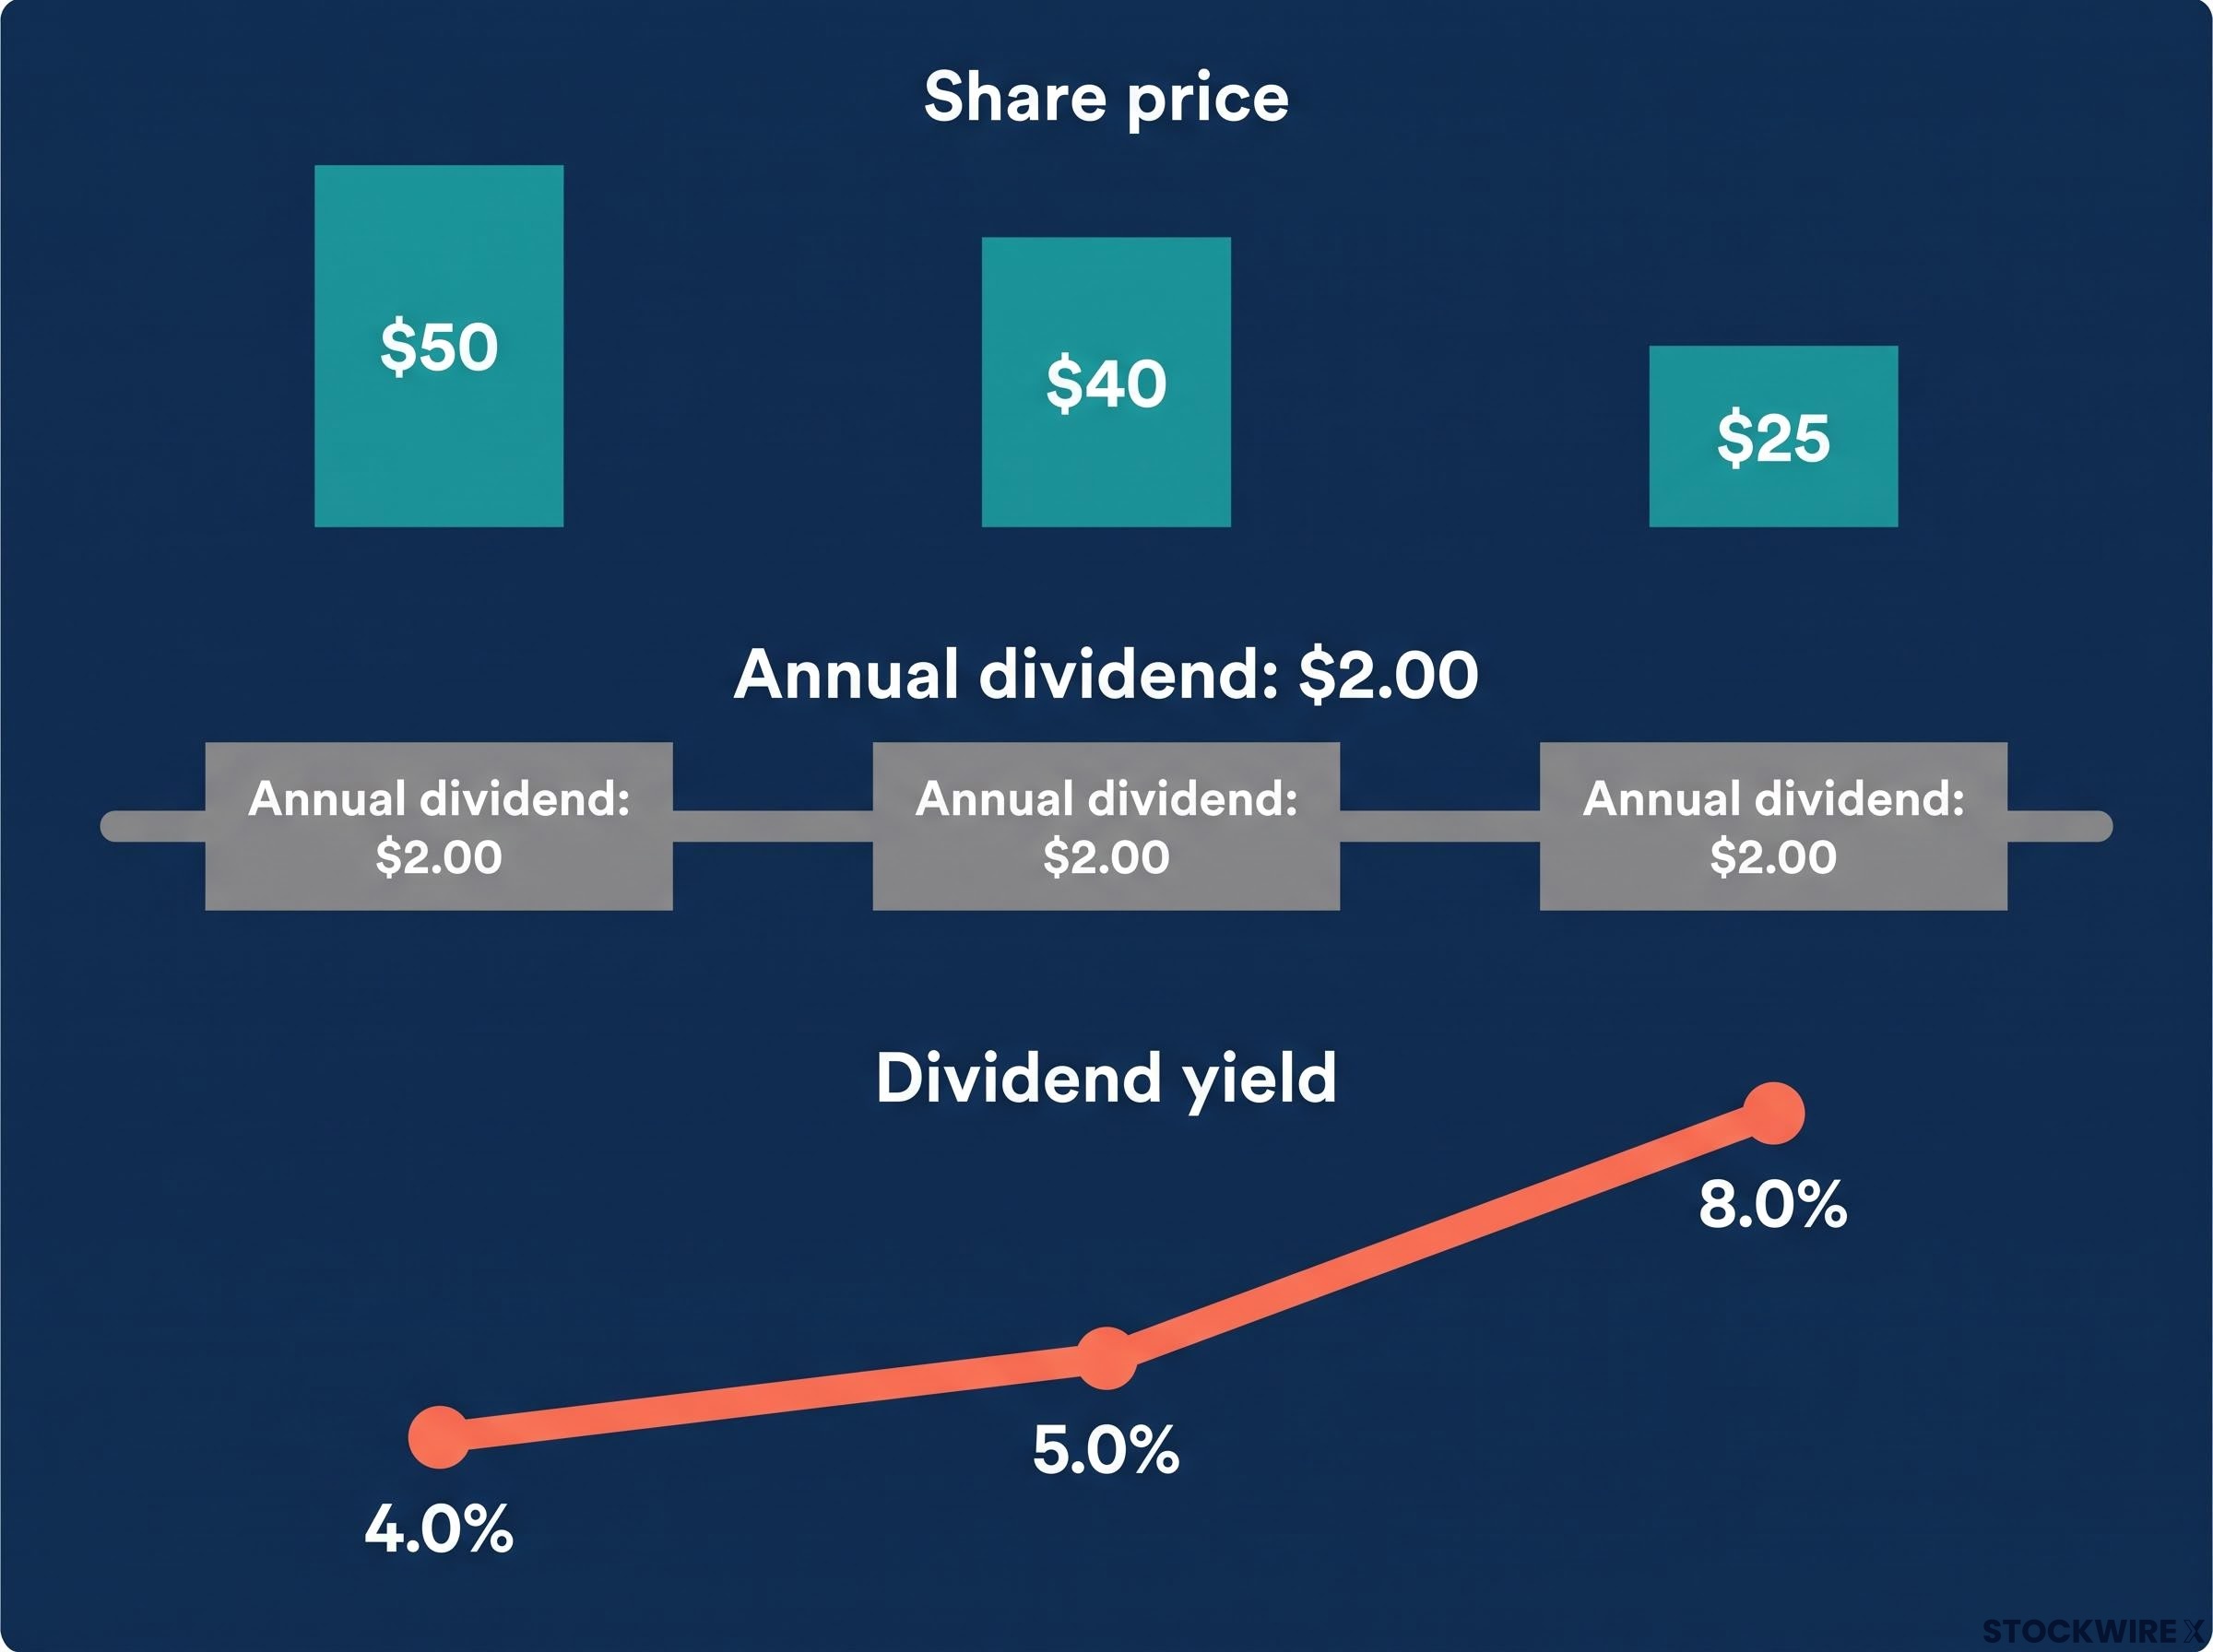
The relationship between share price and yield is mechanical, and the easiest way to see it is through numbers. The table below shows the same $2.00 annual dividend at three different share prices.
| Share price | Annual dividend | Dividend yield |
|---|---|---|
| $50 | $2.00 | 4.0% |
| $40 | $2.00 | 5.0% |
| $25 | $2.00 | 8.0% |
Same dividend. Three different yields. The only variable is the share price, sitting in the denominator of the formula. As the price falls, the yield rises. As the price rises, the yield falls. That is the inverse relationship, and it is a mathematical consequence of the formula, not a change in company policy.
This is where misreading the number gets expensive. A falling share price inflates yield in exactly the same way a shrinking denominator inflates any fraction. The company has not become more generous; the market has repriced the stock lower.
A yield that has jumped from 5% to 9% in a single month while the dividend announcement is unchanged is not a sign that income is improving. It is a signal the market expects a dividend cut, and the price has moved first.
The reverse is equally true. A falling yield can simply mean the share price is rising on improving business performance. That is good news for your total return, even though the yield number looks smaller on the screen.
The yield figure you see on your broker platform today is a snapshot tied to that day’s closing price. The same stock could show a meaningfully different yield tomorrow without the company changing anything at all.
Trailing yield and forward yield: which number are you looking at?
You have probably seen two different yield figures for the same stock on two different platforms and wondered why they do not match. The answer is almost always this: one is showing you trailing yield and the other is showing you forward yield.
Trailing dividend yield
Trailing yield is calculated using the total dividends a company has distributed over the preceding 12 months, divided by today’s share price. It is backward-looking and firmly based on confirmed payments.
- Based on real, completed dividend payments
- The most common default on ASX broker platforms
- Can be distorted by one-off special dividends that inflate the annual figure
- Does not reflect a recent dividend cut until a full 12 months have passed
Forward dividend yield
Forward yield is derived from analyst projections of the dividends a company is expected to pay over the coming 12 months, divided by today’s share price. It is a projection, not a confirmed figure.
- Based on estimates, not completed payments
- Useful for gauging expected income direction
- Inherently uncertain because dividend policy can change at any time
- A company facing earnings pressure may show a notably lower forward yield than trailing yield
Here is why the distinction matters in practice. If a company paid $2.00 per share last year but analysts forecast $1.60 next year due to earnings pressure, the trailing yield looks meaningfully higher than the forward yield on the same day at the same price. If you are comparing two stocks and one figure is trailing while the other is forward, your comparison is misleading before you even start.
ASX data providers and broker platforms often display different defaults without labelling them clearly. Before you draw conclusions from any yield figure, confirm which basis the platform is using. Knowing whether you are looking at confirmed historical income or an analyst’s projection changes how much weight the number deserves in your decision-making.
What a high yield can and cannot tell you about a stock
A high yield is genuinely attractive if you are investing for income. It gives you a quick comparison point against term deposit rates, bond yields, and other income-producing assets available in Australia. That usefulness is real, and there is no reason to dismiss it.
The problem starts when yield becomes the only number you look at.
A stock generating a 2% yield alongside 10% annual share price growth may produce far stronger total returns over time than one offering a 9% yield while its price steadily erodes. Focusing on the higher yield can create a sense of income security that obscures the ongoing loss of capital underneath.
Dividend yield captures the income side of your return only. It says nothing about what the share price is doing. Total return, the combination of income and capital movement, is the figure that determines whether your investment is actually growing your wealth.
Here are the specific blind spots that yield alone cannot cover:
- Total return omission: Yield ignores share price changes, so a high yield can mask ongoing capital loss
- Payout ratio omission: Yield does not tell you what proportion of earnings the company is paying as dividends; a payout ratio above 100% means the company is distributing more than it earns, which is not sustainable
- Dividend sustainability omission: Yield assumes the current dividend level will continue, but dividends are not guaranteed and can be reduced or suspended at any time
- Sector concentration risk: Income-focused screens built purely on yield tend to cluster in mature, low-growth sectors, potentially excluding quality growth companies that reinvest rather than distribute
The payout ratio, the proportion of earnings paid out as dividends, is the most important companion metric to yield. It tells you whether the current dividend level is sustainable or whether the company is stretching to maintain a payout it cannot afford. A high yield with a payout ratio above 100% is a red flag, not a bargain.
Certain highly regarded businesses distribute nothing to shareholders, building value entirely through rising share prices rather than income payments. A screen that filters purely on yield would never surface these companies.
How franking credits change the yield picture for Australian investors
If you invest in ASX-listed shares, the headline yield on your broker platform is probably not the complete income picture. Franking credits can meaningfully change the after-tax return you actually receive, depending on your personal tax situation.
Many ASX-listed companies pay fully or partially franked dividends. A franking credit reflects the corporate tax that has already been remitted to the ATO on the profits underlying a dividend payment, typically at the 30% rate. Receiving a franked dividend means that tax has effectively been pre-paid on your behalf, reducing your personal tax liability on that income or, in some circumstances, producing a cash refund.
The impact is most pronounced for investors on lower marginal tax rates and for self-managed superannuation funds (SMSFs) in pension phase, where franking credits can be fully refunded in cash. For these investors, the effective after-tax yield is materially higher than the headline cash yield.
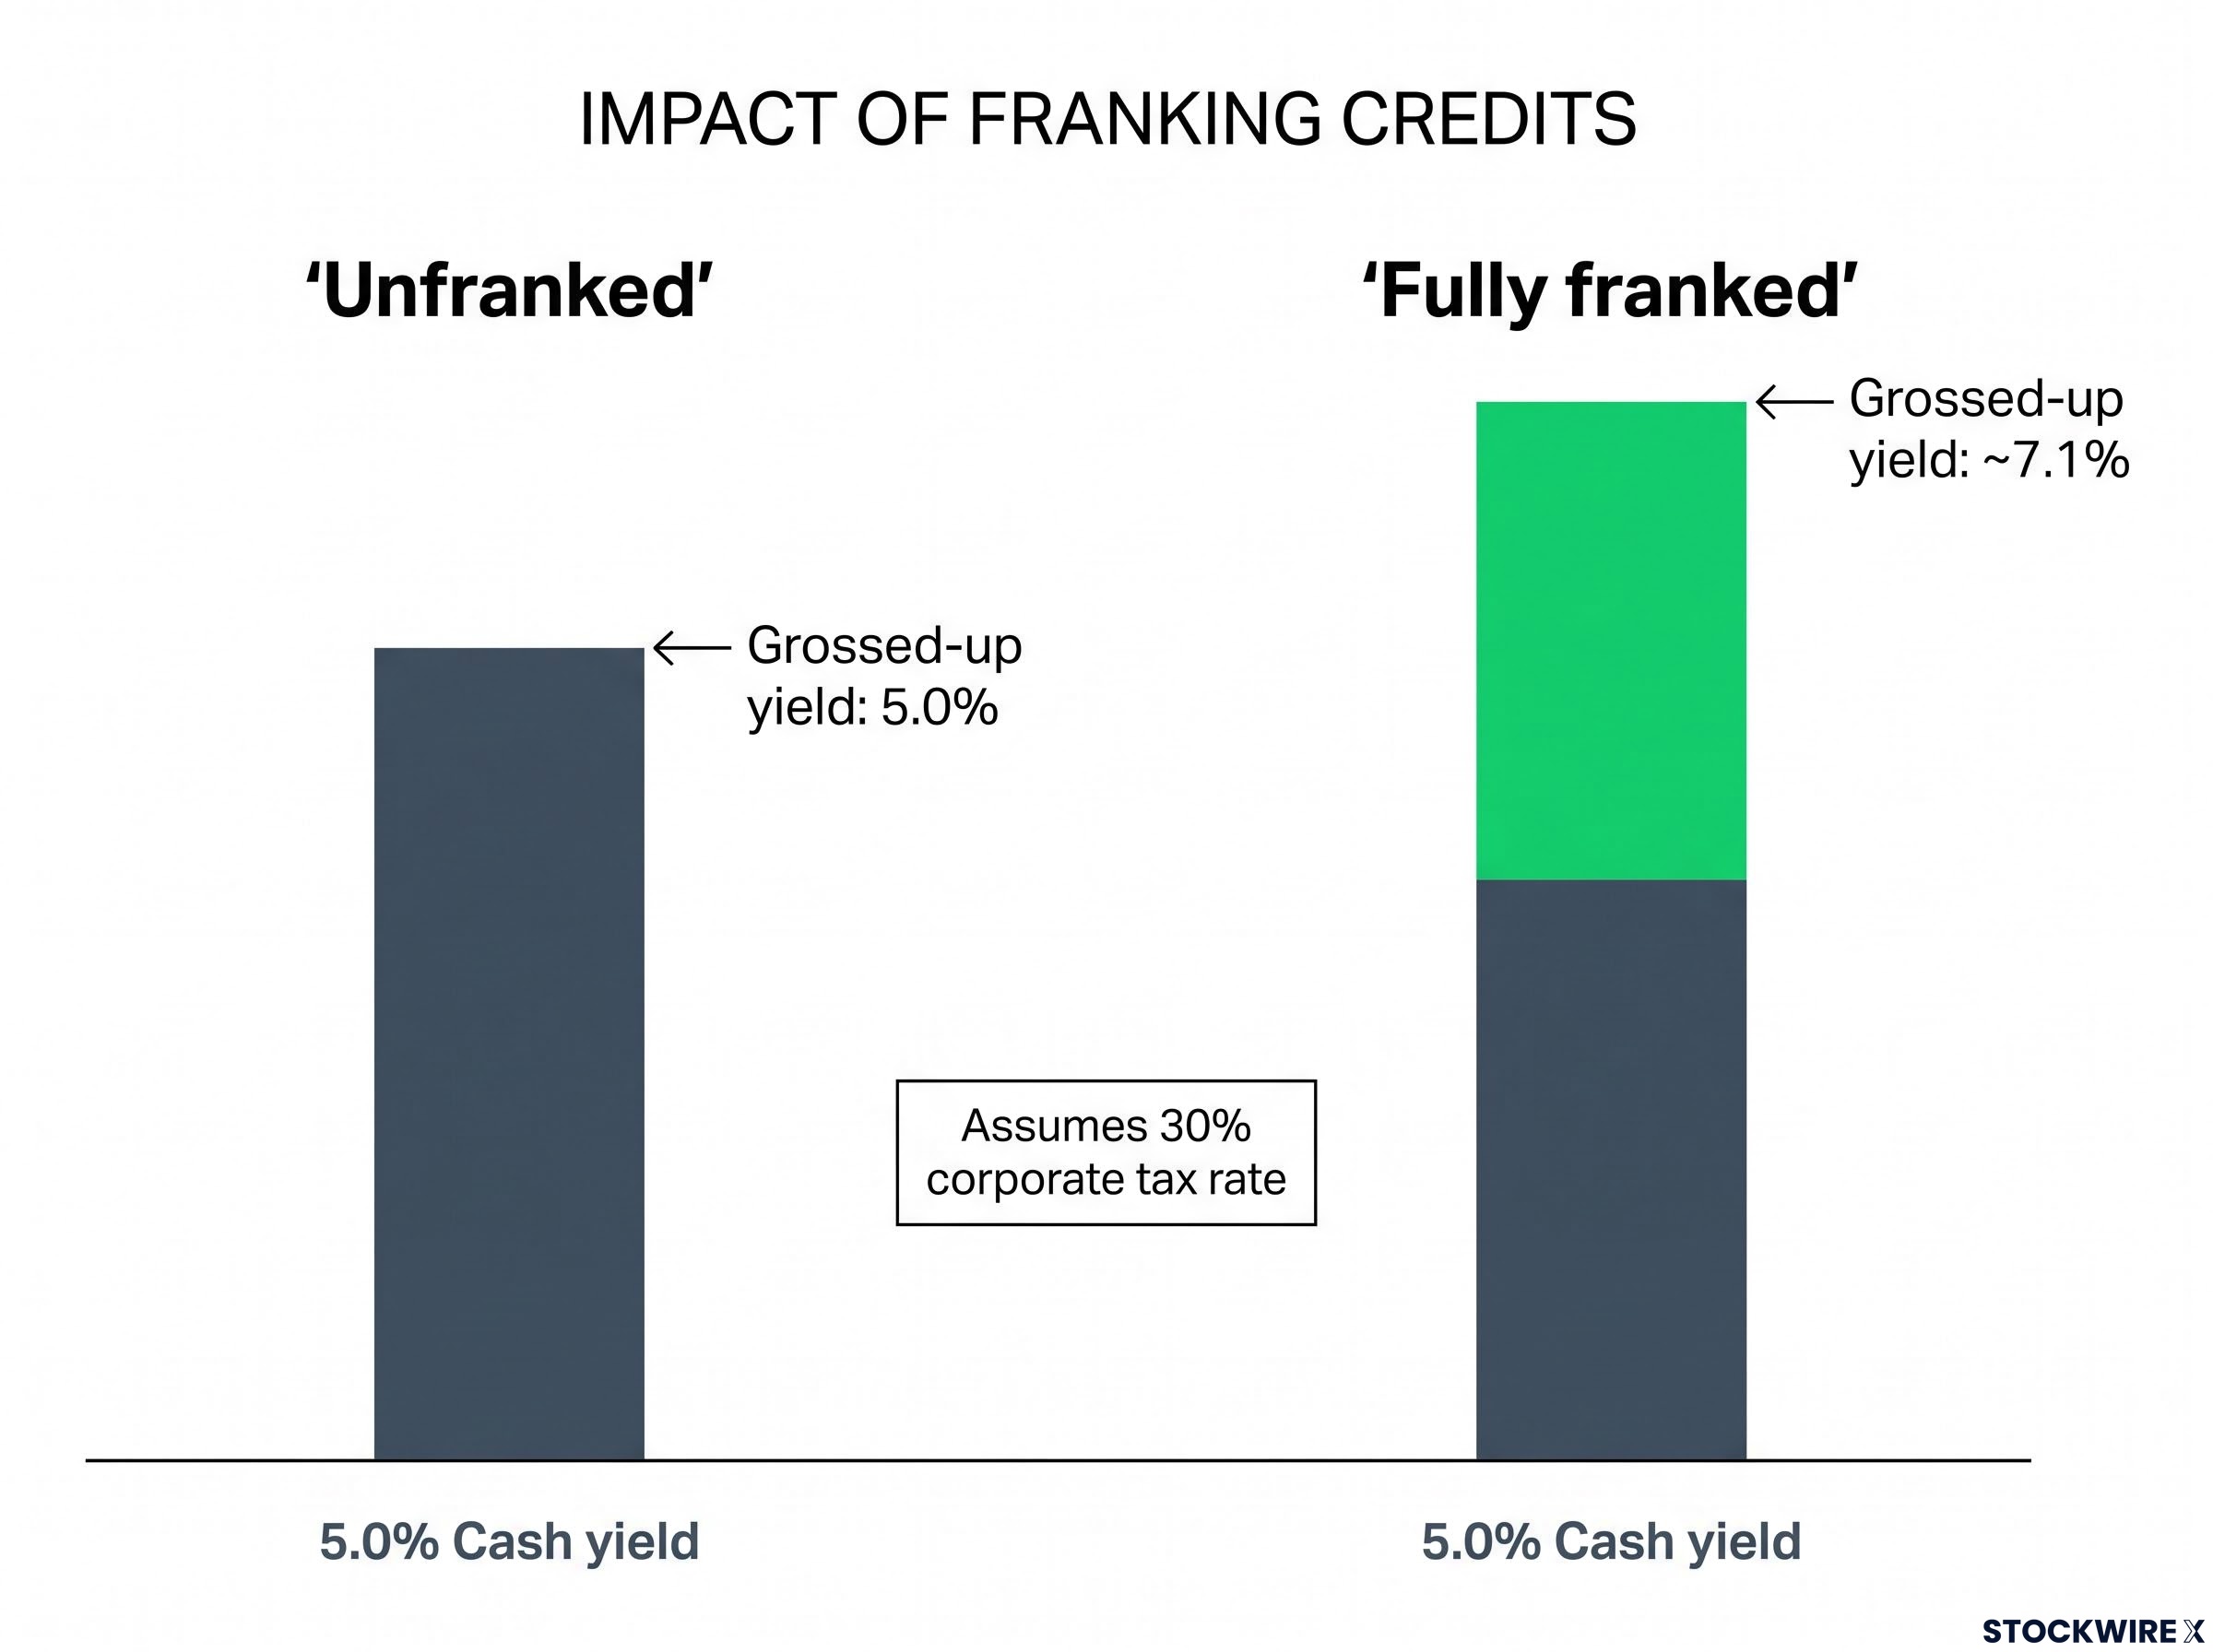
The grossed-up yield formula shows you the pre-tax value of a fully franked dividend:
Grossed-up yield = Cash yield ÷ (1 minus corporate tax rate)
| Dividend type | Cash yield | Grossed-up yield |
|---|---|---|
| Fully franked | 5.0% | ~7.1% |
| Unfranked | 5.0% | 5.0% (no uplift) |
That difference, from 5% to approximately 7.1%, is substantial. Comparing a fully franked ASX dividend yield with an unfranked yield or a term deposit rate without adjusting for franking understates the effective return of the franked option.
The investors who benefit most from franking credits include:
- Individuals on marginal tax rates below 30%, who receive a credit exceeding their tax liability
- SMSFs in accumulation phase, taxed at 15% and therefore receiving a partial credit refund
- SMSFs in pension phase, where the 0% tax rate means the full franking credit is refunded in cash
The benefit varies by your personal tax situation and is not available equally to all investors. But for eligible investors, particularly those approaching or in retirement, the grossed-up yield is the figure that should inform your comparisons between ASX income stocks and other assets.
This information is general in nature. The tax treatment of franking credits depends on your individual circumstances. Consult a qualified tax professional for advice specific to your situation.
Using dividend yield as one tool, not the whole toolbox
Dividend yield is an excellent first filter for income investors. It tells you the current income level of a stock relative to its price, and it lets you compare that income level across different shares, funds, and asset classes. Where it falls short is when it becomes the final answer rather than the first question.
Yield is a starting filter, not a final score. The investors who use it most effectively treat it as a sorting mechanism that narrows a list, not a scoring mechanism that ranks it.
Here is a four-step screening sequence you can apply whether you are looking at ASX large-caps, listed investment companies (LICs), or exchange-traded funds (ETFs) with a distribution yield:
- Start with yield to gauge the current income level and identify stocks within your target income range
- Check dividend growth history to see whether the dividend has been rising, flat, or declining over time, which tells you the trajectory of your income stream
- Review the payout ratio to assess what percentage of earnings are being distributed, and whether that level looks sustainable through a normal business cycle
- Evaluate business fundamentals including profits, cash flow, debt levels, and competitive position to judge how durable the dividend is if conditions deteriorate
For ASX ETFs and LICs specifically, it is worth noting that distribution yield may include return of capital components that are not true income. That adds another layer of scrutiny before you treat the headline distribution yield as a like-for-like comparison with a company’s dividend yield.
This sequence turns yield from a single number into the entry point of an analysis. That is where it does its best work.
Reading yield with both eyes open
Dividend yield is a genuinely useful income metric. It gives you a standardised way to compare what your capital earns across different stocks, funds, and asset classes. It becomes misleading only when it is treated as a verdict rather than a starting point.
The framework that makes yield meaningful has three parts: understand the number (how it is calculated and whether you are looking at trailing or forward), interpret the number (what is driving it higher or lower, and whether that movement reflects opportunity or risk), and contextualise the number (adjust for franking, check the payout ratio, and consider total return alongside income).
As you build an income portfolio on the ASX, combining yield literacy with fundamental analysis positions you to make more durable income decisions than screening on yield alone ever could. The percentage on the screen is where the analysis starts. What you do with it next is what determines whether it serves you well.
This article is for informational purposes only and should not be considered financial advice. Investors should conduct their own research and consult with financial professionals before making investment decisions.