
At the current trajectory of analyst forecasts, a Commonwealth Bank of Australia (ASX: CBA) shareholder needs roughly 1,835 shares to generate $10,000 a year in passive income by FY27. That is a concrete number. What sits behind it, the dividend growth assumptions, the franking credit mechanics, and the near-unanimous analyst caution on valuation, is considerably more complicated.
CBA is the stock Australians reach for first when they think about dividend income. Its semi-annual payments, a growth record spanning nearly three decades, and fully franked status make it a natural anchor for any income-oriented portfolio. Yet as of May 2026, 14 of 16 analysts tracked by CommSec rate CBA a sell, with only 2 holds and zero buys. The gap between CBA’s income appeal and its current analyst reception is wide enough that any serious assessment of the dividend story has to hold both realities at once.
What follows works through the FY26 and FY27 dividend projections in detail, explains how franking credits change the real yield calculation for Australian investors, models the shareholding required to reach $10,000 in annual passive income, and frames the analyst consensus as context no income investor can afford to set aside.
What the FY26 and FY27 dividend forecasts actually show
CBA paid a total dividend of $4.65 per share in FY2024, fully franked. Independent analyst projections collated by CommSec now forecast that figure rising to $5.15 per share in FY26, representing approximately 6.2% year-on-year growth, and then to $5.45 per share in FY27, an increase of roughly 5.8%.
The progression matters more than either number in isolation. A 6.2% step followed by a 5.8% step shows growth decelerating slightly, a pattern consistent with a mature banking franchise expanding dividends from a high base rather than accelerating into new territory. That trajectory sits comfortably within CBA’s roughly 30-year record of generally increasing dividends, though it does signal that the fastest phase of post-pandemic recovery in payouts may be behind.
FY27 forecast: $5.45 per share, representing the highest projected annual dividend in CBA’s history, according to CommSec-collated analyst estimates.
| Financial Year | Dividend Per Share | YoY Growth | Franking |
|---|---|---|---|
| FY2024 (actual) | $4.65 | — | 100% |
| FY26 (forecast) | $5.15 | 6.2% | 100% |
| FY27 (forecast) | $5.45 | 5.8% | 100% |
For investors building a long-term income model, the slight deceleration between FY26 and FY27 is worth noting. It does not undermine the growth story, but it does suggest the trajectory is one of steady compounding rather than expanding momentum.
When big ASX news breaks, our subscribers know first
How franking credits change the real yield calculation
The dividend yield most investors see on a broker screen is the cash yield: the annual dividend divided by the share price. For CBA, that number tells only part of the story. Every CBA dividend is 100% franked, meaning it carries a tax credit equal to the 30% corporate tax rate already paid on the underlying earnings.
The grossed-up yield, which accounts for these credits, is the figure that reflects the real economic return to an eligible Australian shareholder. Calculating it follows three steps:
The grossed-up yield on Australian bank shares is the figure that matters for comparing income returns across asset classes, and for pension-phase SMSF investors, the gap between the headline cash yield and the effective after-tax return is wider than almost any other investor cohort experiences with any comparable income security.
- Start with the cash dividend per share. For FY27, this is the forecast $5.45.
- Calculate the franking credit. Divide the cash dividend by (1 minus the corporate tax rate), then subtract the cash dividend. At a 30% tax rate, the franking credit on $5.45 is approximately $2.34.
- Add the franking credit to the cash dividend. The grossed-up dividend is approximately $7.79 per share, and the grossed-up yield rises accordingly.
On this basis, the FY26 grossed-up yield sits at approximately 4.5%, rising to roughly 4.8% for FY27. For an ordinary taxpayer, the franking credit offsets personal income tax owed. For investors in lower tax brackets, the credit may exceed the tax liability, producing a net benefit.
Why the SMSF pension phase benefit is in a category of its own
Self-managed superannuation funds (SMSFs) in pension phase pay zero tax on investment earnings. When a zero-tax entity receives a fully franked dividend, the entire franking credit becomes a cash refund from the Australian Taxation Office (ATO).
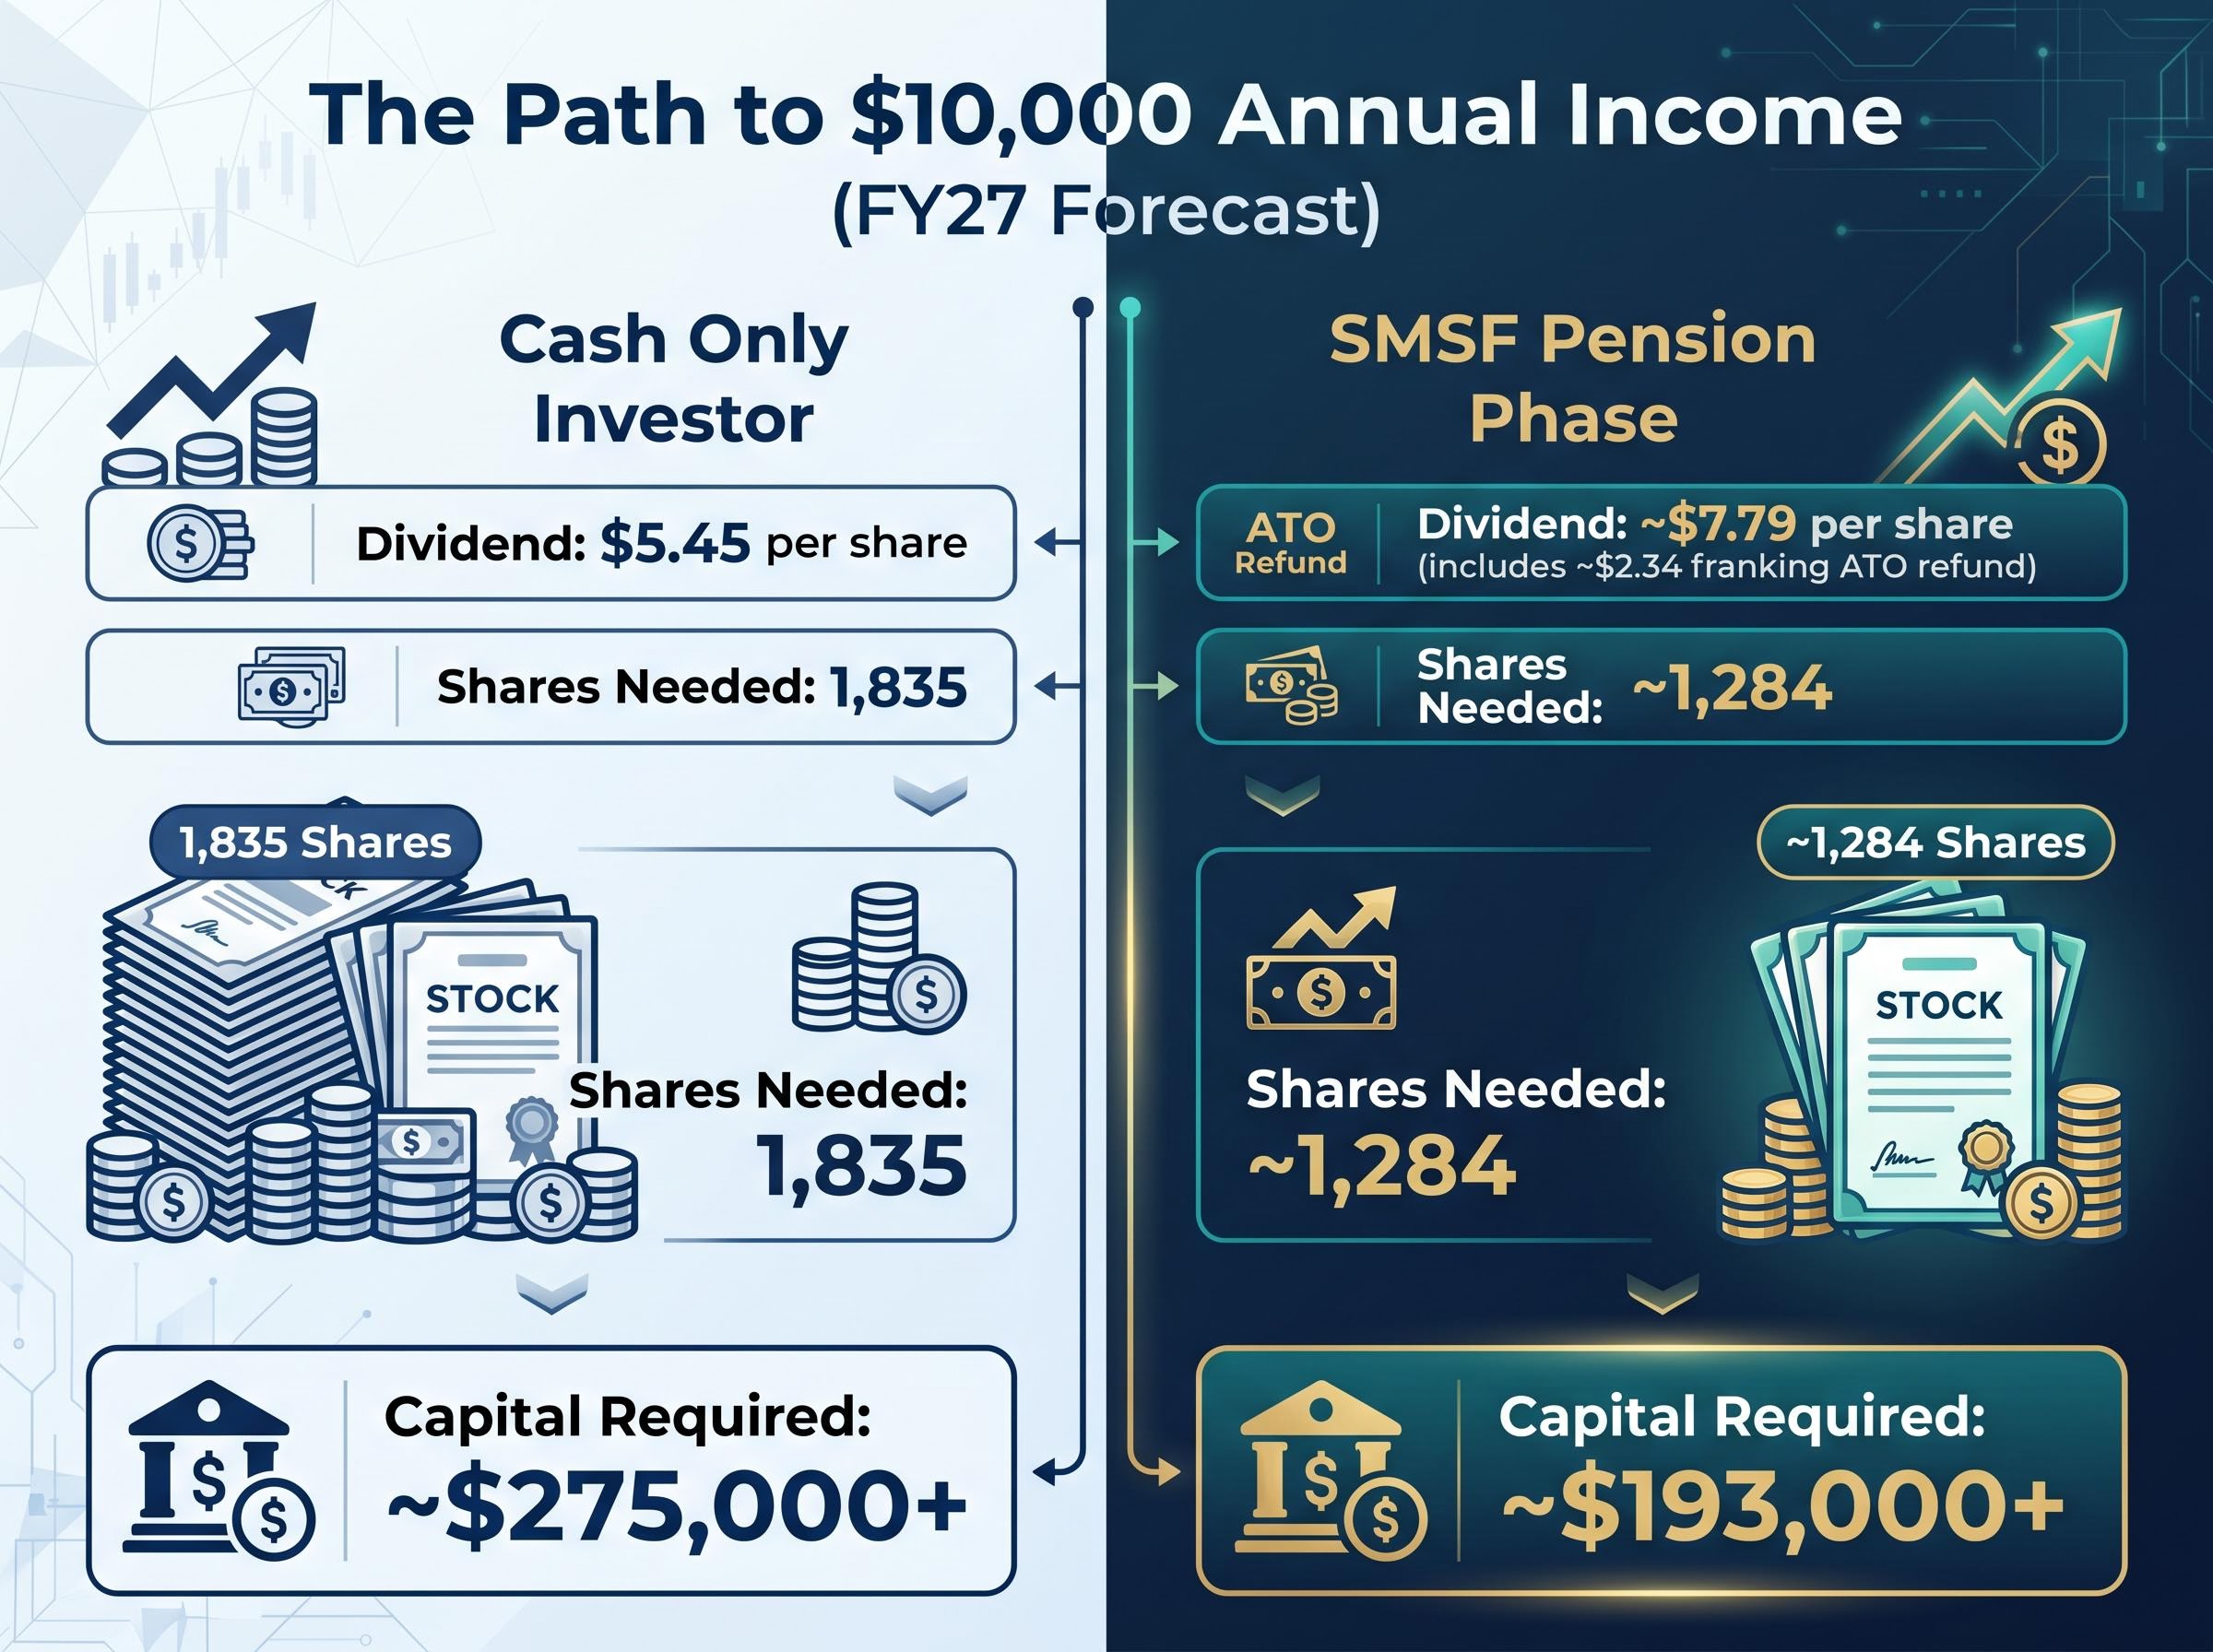
This means an SMSF in pension phase holding CBA receives the $5.45 cash dividend plus an ATO refund of approximately $2.34, lifting total cash income per share to roughly $7.79. No other investor cohort captures the full franking benefit in this way, which is why CBA’s fully franked status is most materially valuable for retirees drawing a pension from an SMSF.
Calculating the shareholding needed to reach $10,000 in annual income
The arithmetic is straightforward. Dividing the $10,000 income target by the forecast dividend per share produces the required shareholding.
At the FY26 forecast of $5.15 per share, an investor would need approximately 1,942 shares to generate $10,000 in cash dividends before franking. At the FY27 forecast of $5.45, that figure drops to approximately 1,835 shares, a reduction of over 100 shares driven entirely by the projected dividend growth between the two years.
FY27 target: approximately 1,835 CBA shares to generate $10,000 in annual cash dividend income.
Translating those share counts into capital cost gives the calculation real-world weight. With CBA trading above $150 at various points during the 2024-2025 period, acquiring 1,835 shares would require an outlay in the vicinity of $275,000 or more at those price levels. For the FY26 scenario, the capital required to purchase 1,942 shares would be proportionally higher.
| Scenario | Dividend Per Share | Shares Needed | Approx. Capital Required |
|---|---|---|---|
| FY26 (cash only) | $5.15 | 1,942 | ~$291,000+ |
| FY27 (cash only) | $5.45 | 1,835 | ~$275,000+ |
| FY27 (grossed-up, SMSF pension) | ~$7.79 | ~1,284 | ~$193,000+ |
The grossed-up row illustrates why the franking calculation matters: an SMSF in pension phase could reach the same $10,000 income target with roughly 550 fewer shares than an investor counting cash dividends alone. The capital difference at current price levels is substantial.
The analyst consensus that complicates the income story
The dividend trajectory is one half of the equation. The other half is the price an investor pays to access it.
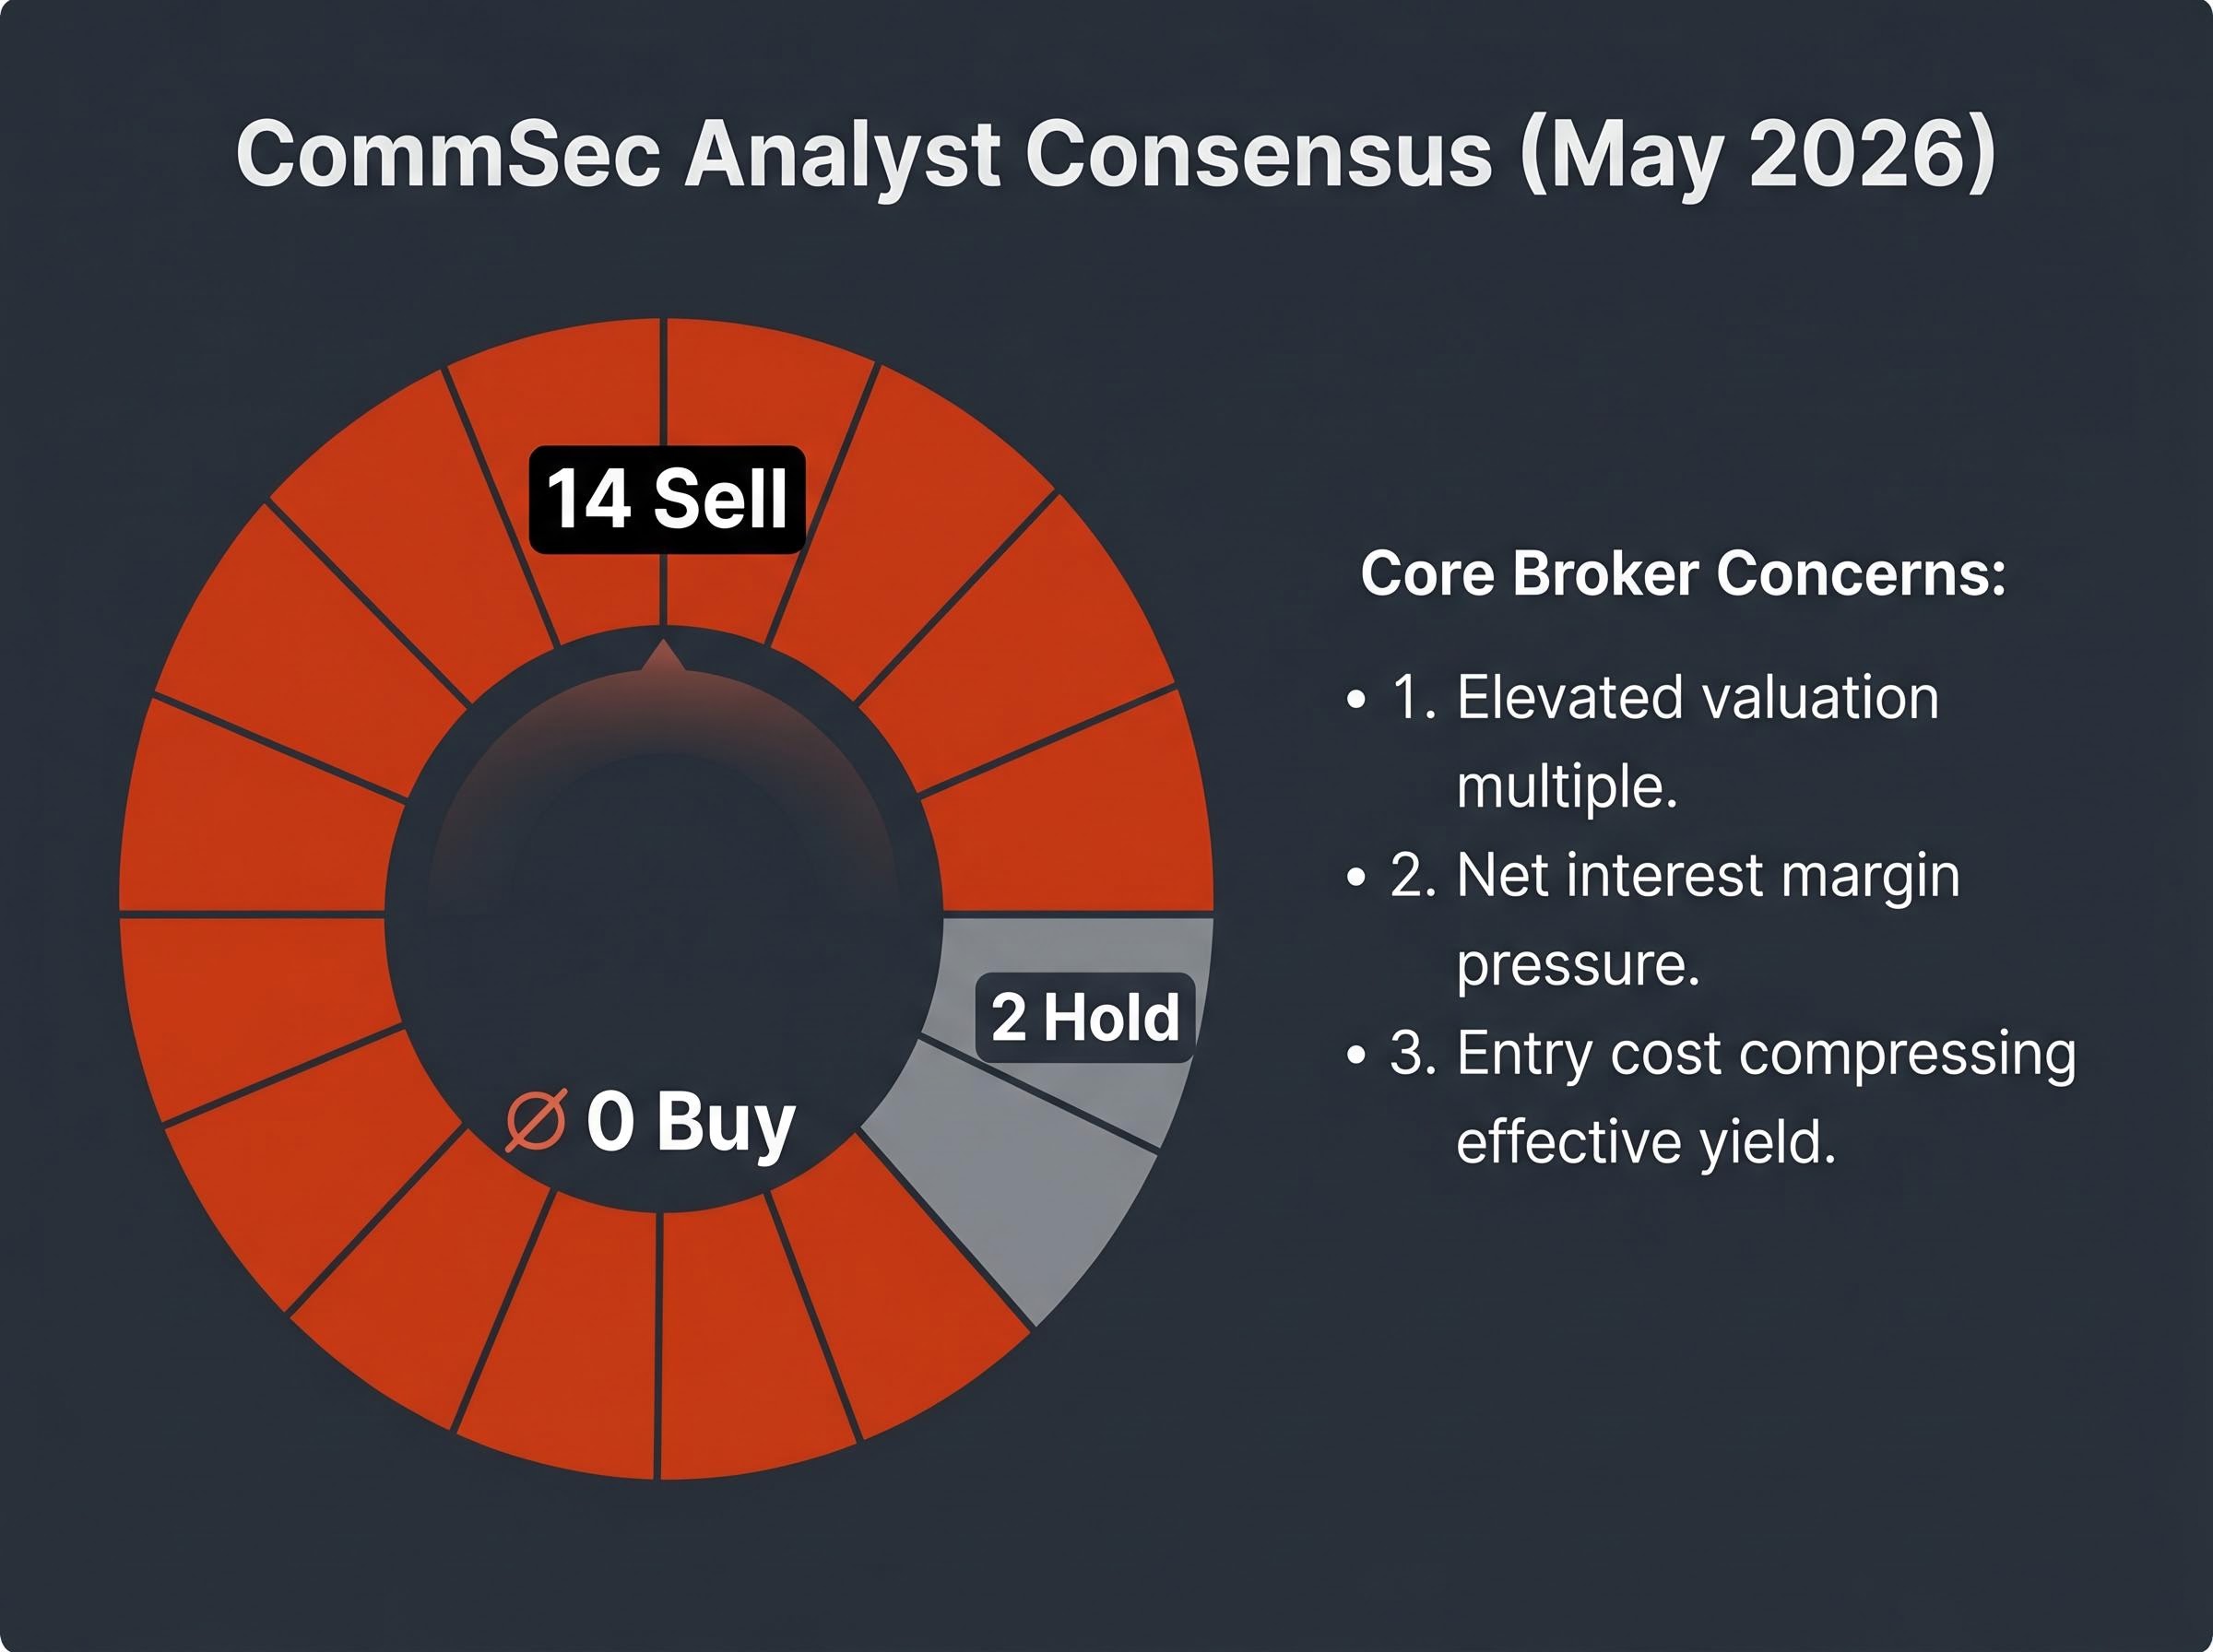
Of the 16 analyst ratings tracked by CommSec as of May 2026, 14 carry a sell designation. Two analysts rate CBA a hold. None rate it a buy.
14 of 16 analysts rate CBA a sell, with zero buy recommendations, according to CommSec-collated data as of May 2026.
That figure deserves to sit without qualification for a moment. It is not a marginal tilt; it is near-unanimity.
The analyst objection is not about the quality of CBA’s franchise or the sustainability of its dividends. Broker research consistently acknowledges CBA’s operational strength, its capital position (with a Common Equity Tier 1 ratio well above regulatory minimums), and its market leadership. The objection is about what investors are being asked to pay for those qualities. The three recurring concerns in broker research are:
APRA’s APS 110 capital adequacy standard sets a minimum Common Equity Tier 1 ratio of 4.5% for authorised deposit-taking institutions, the regulatory floor that CBA’s reported CET1 position comfortably exceeds and that underpins broker assessments of the bank’s balance sheet strength.
- Elevated valuation multiple. CBA’s price-to-earnings ratio has consistently traded at a premium to both domestic banking peers and global banking comparators, a gap several international brokers have flagged as difficult to justify on fundamentals alone.
- Net interest margin pressure. Competition in the Australian mortgage market and elevated funding costs are cited as headwinds to earnings growth, and by extension, to the pace of future dividend increases.
- Entry cost compressing effective yield. A share price trading at elevated multiples means the cash dividend yield is lower than it would be at a more moderate valuation, reducing the income return per dollar invested.
For an income investor, this creates a specific tension. The dividend growth trajectory is genuine, but an entry at current prices compresses the yield. And any mean-reversion in valuation, even with dividends continuing to grow, would affect the capital value of the holding.
Why CBA’s dividend record does not change the diversification argument
CBA’s roughly 30-year track record of generally increasing dividends is real and material for long-term holders. Some shareholders who accumulated positions over decades report receiving several thousand dollars annually in dividend income. That consistency has earned the stock its status as an anchor holding across Australian retail portfolios.
Total return compounding through franking has been a material driver of CBA’s outperformance for long-term holders, with a two-year investment from April 2024 producing an estimated 72% return once fully franked dividends were reinvested, against a 52.5% price-only gain over the same period.
None of that changes the risk of building an income portfolio too heavily around a single name. The $10,000 passive income scenario modelled above assumes, as the underlying source material explicitly states, that CBA represents only a modest portion of a broader portfolio. It is one income stream, not the entire strategy.
Concentration in any single large-cap, regardless of quality, exposes income investors to company-specific and sector-specific shocks. A regulatory change affecting the banking sector, a sustained compression of net interest margins, or an unexpected credit event would affect every dollar of income tied to that single holding. Four principles are worth considering for ASX dividend investors building for retirement:
- Spread holdings across multiple sectors rather than anchoring income to financials alone.
- Consider geographic exposure through international dividend payers or globally diversified funds.
- For SMSF trustees, optimise franking credit benefits across multiple fully franked stocks rather than concentrating in one.
- Avoid allowing any single large-cap dividend payer to dominate overall portfolio income, even when that stock is CBA.
For investors ready to move from single-stock income modelling to a full portfolio construction approach, our comprehensive walkthrough of building an ASX dividend portfolio covers sector diversification, payout ratio screening, ex-dividend date mechanics, and how DRP compounding interacts with fully franked dividends across a multi-holding income strategy.
CBA’s income case is real, but the entry price is the question to answer first
The two tracks of CBA’s dividend story run in parallel. The growth trajectory from $4.65 in FY2024 to a forecast $5.45 in FY27 is genuine, and the grossed-up yield for Australian shareholders, particularly SMSFs in pension phase, is meaningfully higher than the headline cash figure. The required shareholding to reach $10,000 in annual income declines from roughly 1,942 shares in FY26 to 1,835 in FY27, a tangible illustration of compounding dividend growth.
Against that sits a near-unanimous analyst view that the share price already reflects more than the fundamentals justify. The capital required to buy those 1,835 shares at current price levels is the variable that determines whether the income target is achievable at an acceptable yield on invested capital.
Investors comparing ASX dividends against term deposit rates face a materially different calculation in 2026 than in prior years, with major bank term deposits offering rates as high as 4.80% after the RBA’s three consecutive hikes, creating a genuine alternative income benchmark that income-focused shareholders should factor into their yield assessments.
Before acting, investors should verify the latest consensus dividend estimates through CBA’s investor relations page and ASX announcements, calculate the grossed-up yield specific to their own tax position, and assess their overall portfolio concentration in CBA. Consulting a financial adviser for personalised modelling is warranted, particularly for SMSF trustees where the franking credit refund mechanism has a material impact on the income outcome.
This article is for informational purposes only and should not be considered financial advice. Investors should conduct their own research and consult with financial professionals before making investment decisions. Past performance does not guarantee future results. Dividend forecasts are subject to change based on market conditions, earnings outcomes, and company decisions.