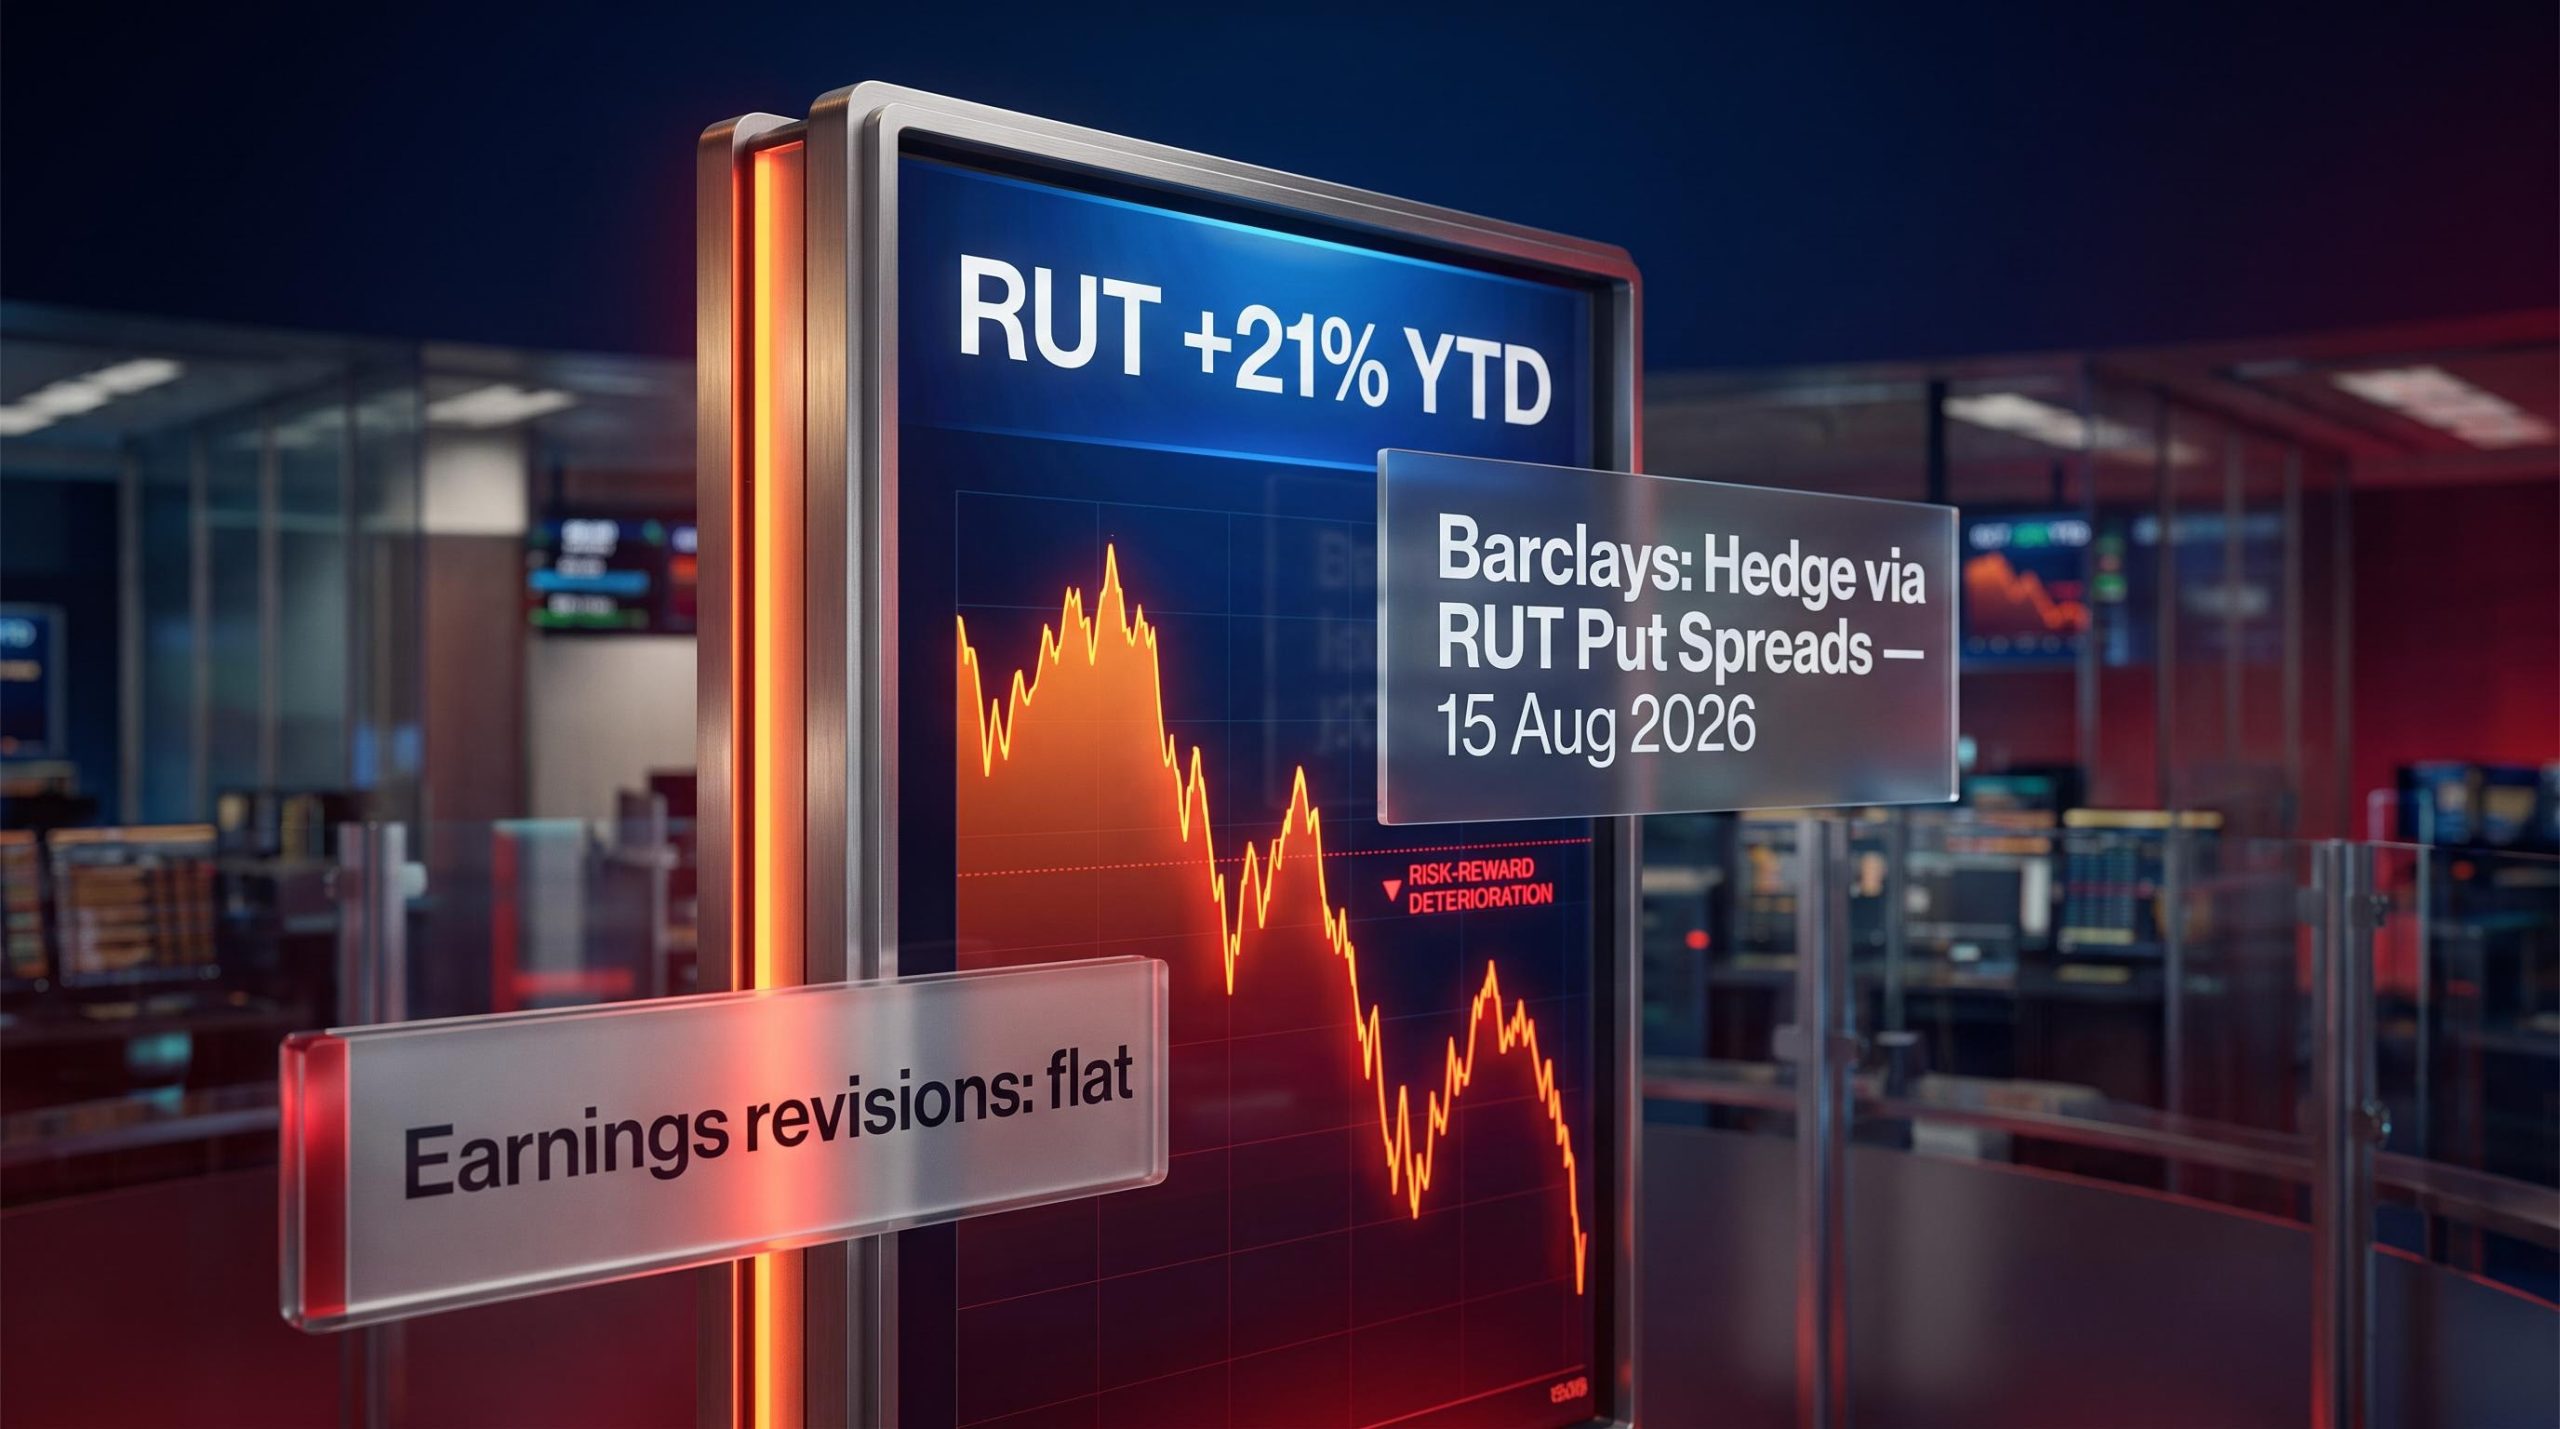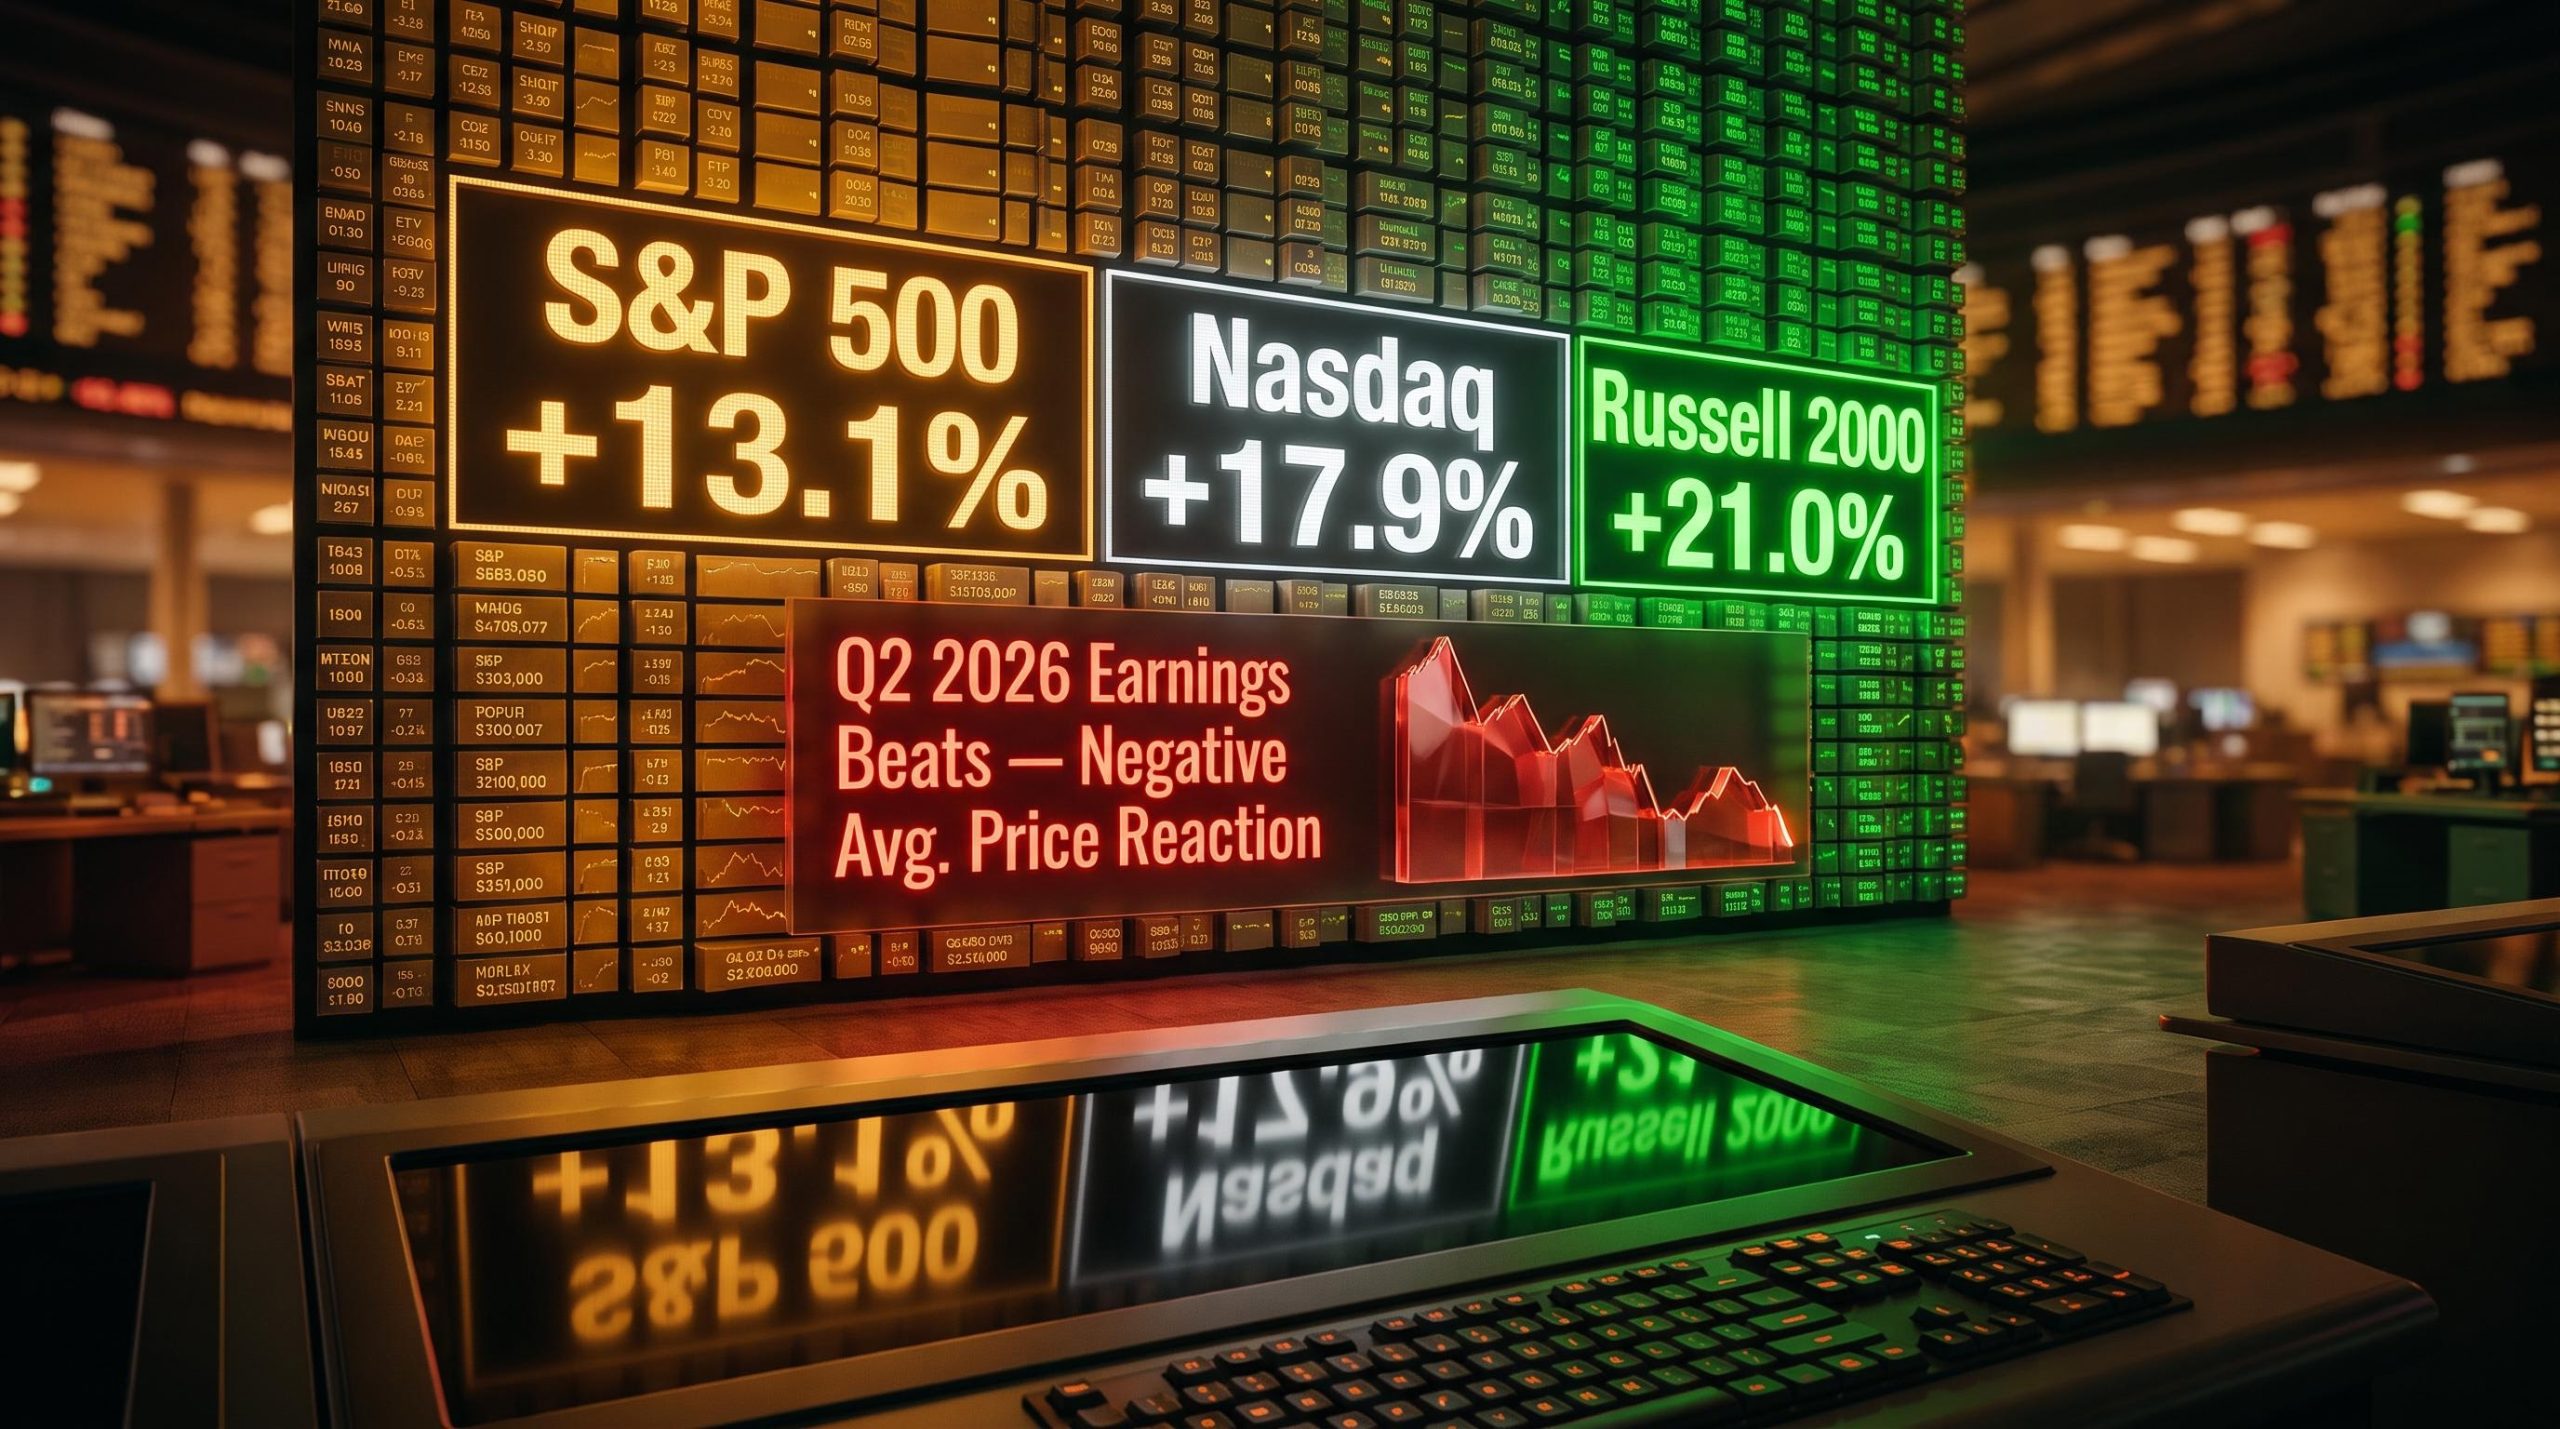
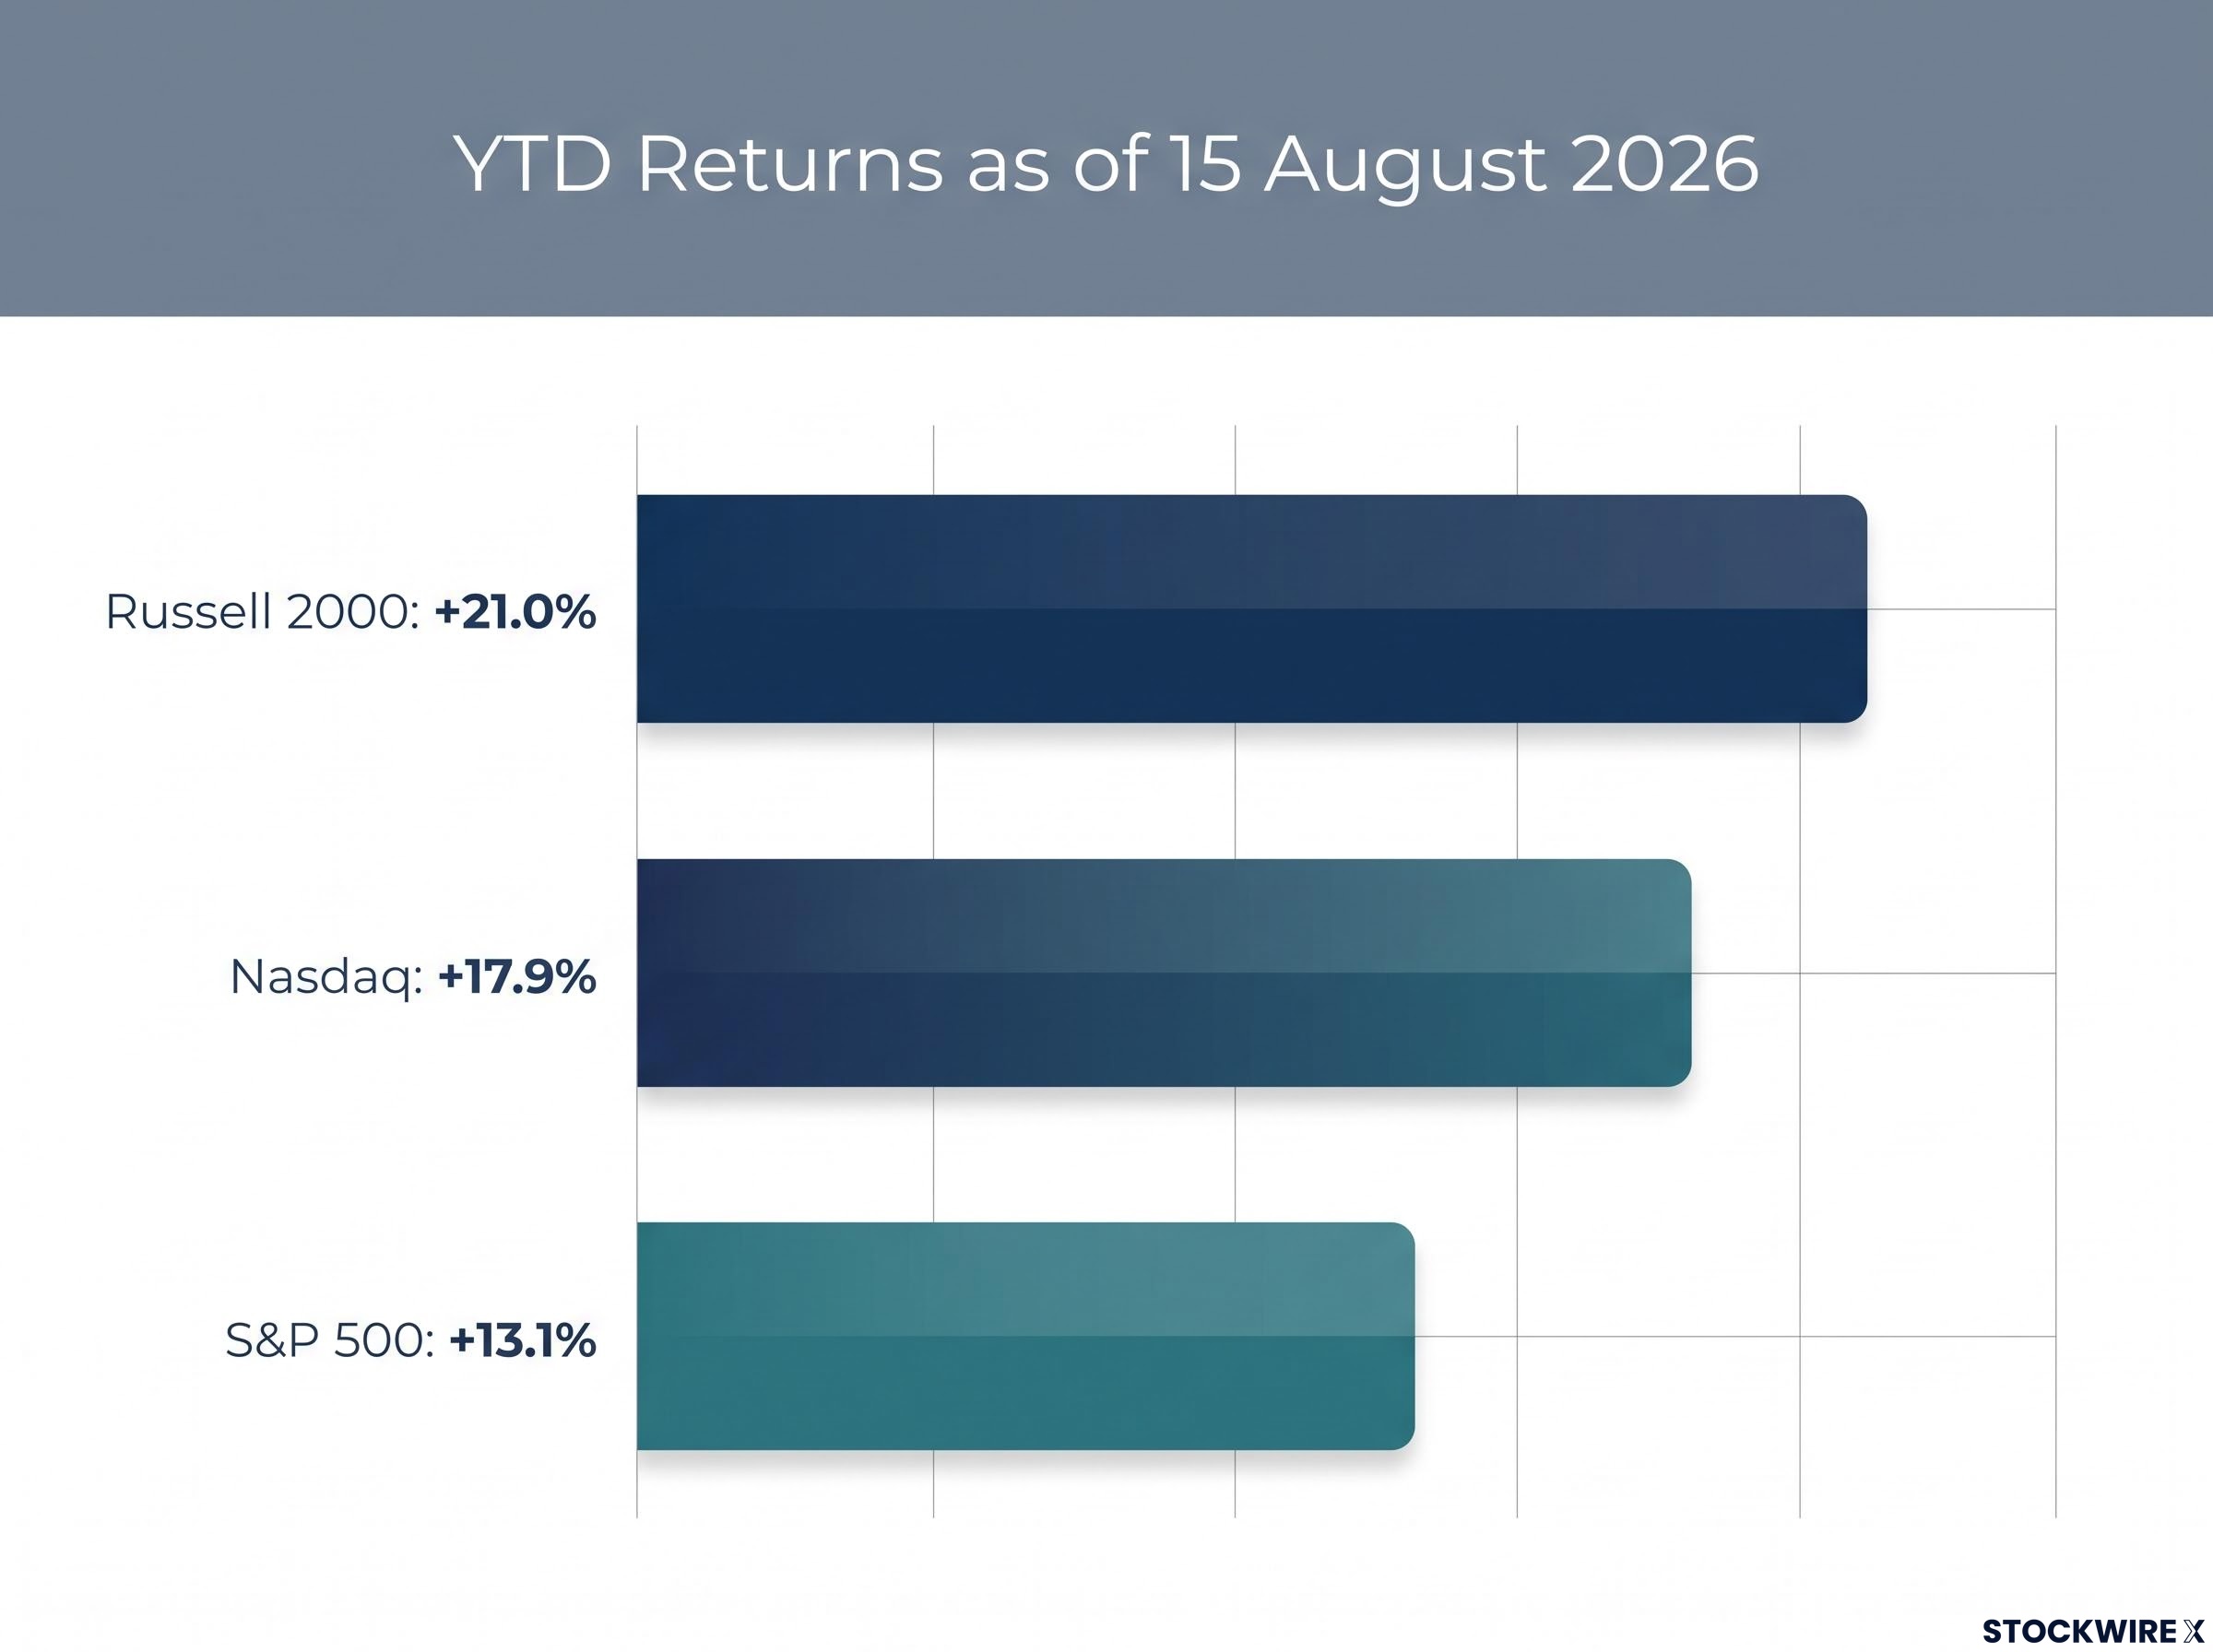
The S&P 500 has climbed 13.1% so far this year, while the Nasdaq is ahead by 17.9% and the Russell 2000 tops both with a 21.0% advance. As of 15 August 2026, all three major U.S. benchmarks are posting double-digit gains, and the rally has been broad enough to carry small caps to the front of the pack.
Those numbers look impressive until you ask what is actually doing the driving. Barclays’ equity derivatives team has raised a pointed question about market character: even as U.S. equities post strong returns, the bank’s analysts argue that investor demand and momentum-chasing are playing an expanding role, and that the central debate has moved on from market direction to whether the gains being logged rest on durable fundamental ground.
Here is the specific evidence Barclays cites, what other major institutions think about the same data, and what that combination means for anyone weighing a positioning decision right now.
The rally by the numbers: what investors are actually seeing in 2026
The scale of the 2026 advance is difficult to dismiss. All three major benchmarks are deep into double-digit territory, and the S&P 500 posted an eight-week winning streak earlier this year, the longest since late 2023.
| Index | YTD Return | Reference Date |
|---|---|---|
| S&P 500 | +13.1% | 15 August 2026 |
| Nasdaq | +17.9% | 15 August 2026 |
| Russell 2000 | +21.0% | 15 August 2026 |
Barclays describes the headline performance as “remarkable,” and the numbers justify the word. But the detail that should make you pause is the Russell 2000 leading the pack. The bank points out that small-cap gains of this scale are hard to reconcile with the segment’s weaker earnings-revision trajectory and its heightened exposure to interest-rate movements, making the outperformance difficult to explain on fundamentals alone.
When big ASX news breaks, our subscribers know first
What is genuinely driving the advance, and where the support ends
The bulls have real evidence. Barclays itself acknowledges three legitimate fundamental tailwinds supporting the broader move:
- Strong corporate earnings holding up across large-cap names
- Macroeconomic conditions that have continued to improve
- The stagflation threat tied to Iran-related tensions, which had weighed on sentiment earlier in the year, has largely receded
None of those are disputed. The question is whether they are sufficient to explain a 21% small-cap surge and an index-wide advance that has carried the S&P 500 through its longest winning streak in nearly three years.
Barclays’ equity derivatives team argues that the central question has shifted: the concern is not that fundamentals are absent, but that high investor demand and momentum-chasing behaviour are increasingly doing the incremental driving, particularly in segments where earnings revisions do not match the price action.
Small-cap earnings revisions have lagged their large-cap counterparts by a meaningful margin, and the Russell 2000 is more exposed to rate movements than the broader market. A 21% gain against that backdrop tells you the price story and the earnings story are not aligned, and that misalignment is where risk builds quietly for investors holding small-cap exposure.
What earnings season actually revealed about investor expectations
Q2 2026 earnings were strong by any reasonable measure. The vast majority of S&P 500 companies beat both earnings-per-share (EPS) and revenue estimates, with growth described as among the strongest since the post-pandemic surge of 2021.
The FactSet Q2 2026 earnings update recorded 86% of S&P 500 companies reporting actual EPS above estimates, with a blended earnings growth rate of 50.4%, data that confirms the headline strength of the earnings season while leaving the anomalous negative price reactions documented by Barclays unexplained.
Strong results, though, did not produce the reaction investors might expect.
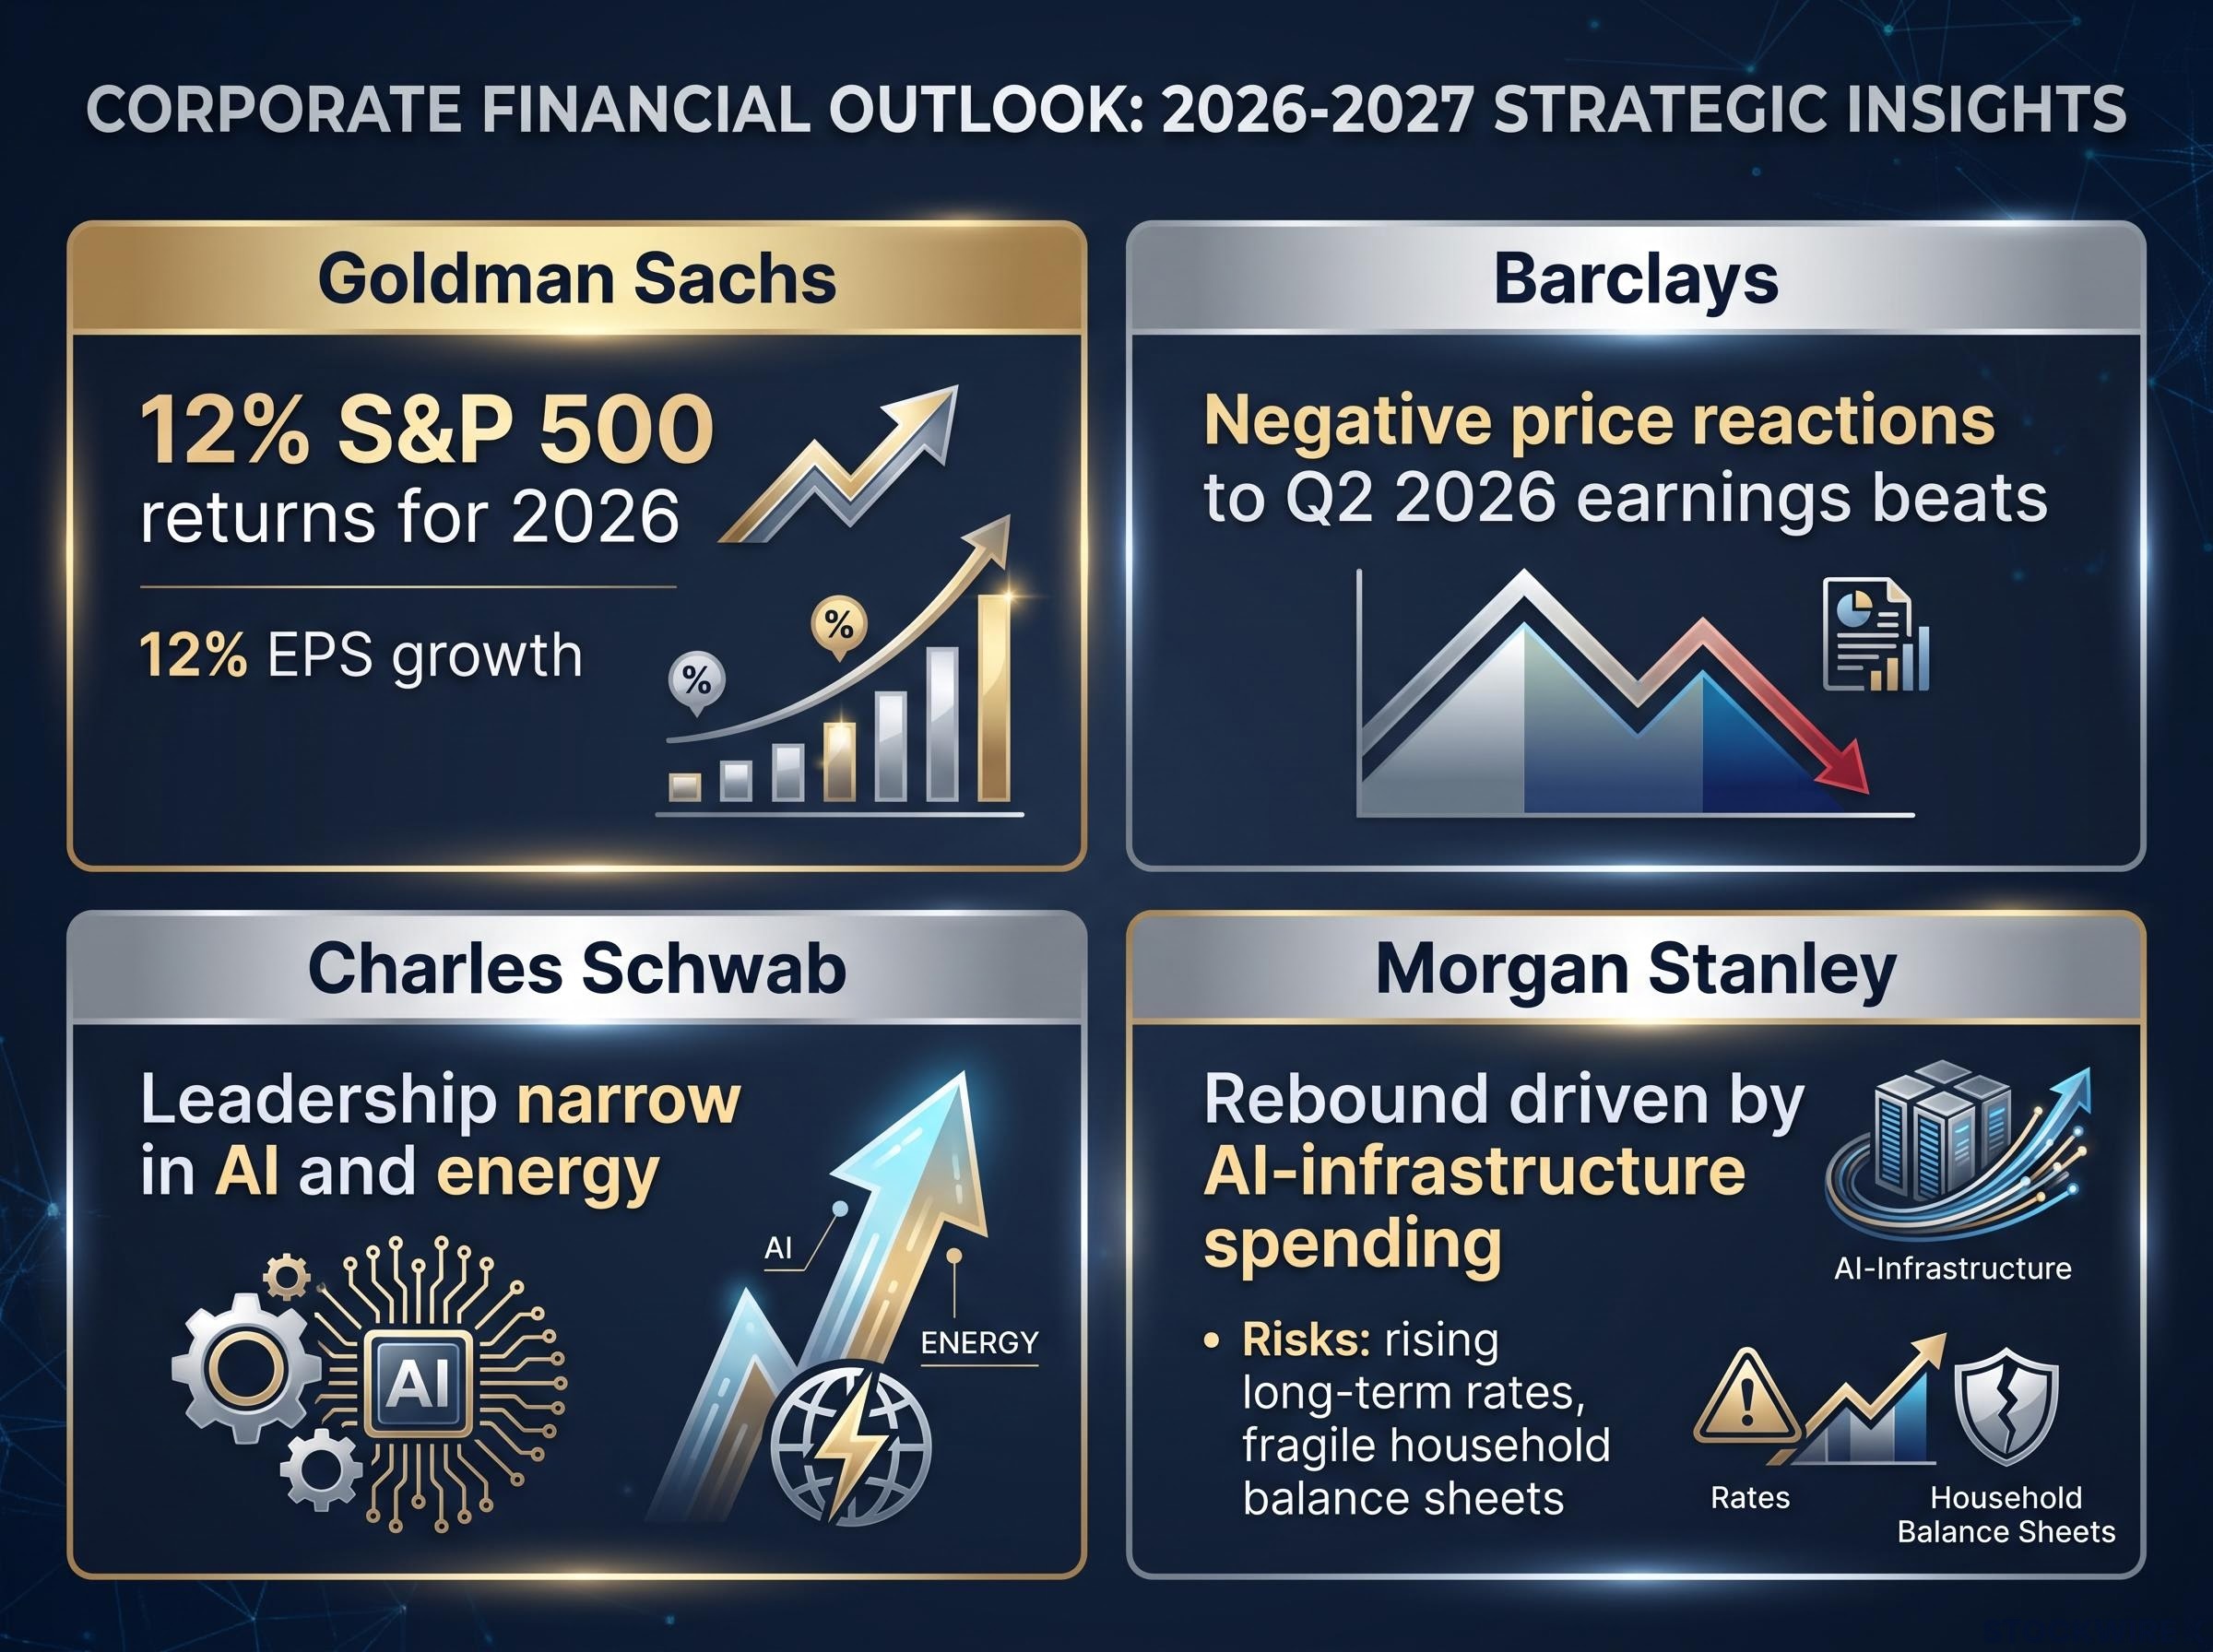
Barclays’ equity derivatives team identified an anomaly: both earnings beats and misses produced negative average share-price reactions, a pattern last observed in Q4 2024. Investors showed little tolerance for anything short of a clean beat accompanied by improved forward guidance.
Options markets reinforced the signal. Across most sectors, the price swings implied by options pricing ahead of earnings announcements ran ahead of the moves that actually materialised, with the gap most pronounced in technology and utilities. Barclays attributed this to a combination of crowded positioning and intensifying scrutiny of AI capital expenditure, which had lifted the bar for what counted as a satisfactory result.
When a company beats estimates and its stock still falls, the market is telling you the price already reflected the good news. The investor question shifts from “is this business performing?” to “is the stock still worth buying at this level?” That distinction matters more than the earnings headline.
The pattern of stocks falling on earnings beats is a symptom of elevated expectations, but identifying which companies are genuinely at risk requires looking past the EPS headline; earnings quality signals including the GAAP-to-non-GAAP gap, free cash flow alignment, and forward guidance language are the tools that separate manufactured results from durable performance.
How fundamentals-driven and momentum-driven rallies actually differ
This is the concept that underpins Barclays’ entire thesis, and it is worth understanding clearly because it applies to any market environment, not just this one.
A fundamentals-driven rally is one where price appreciation corresponds to measurable improvement in earnings, revenue, or cash flow. The stock goes up because the business has genuinely become more valuable. That kind of rally has a natural floor: if prices pull back, the underlying business value provides support.
A momentum-driven rally is one where price appreciation is sustained primarily by investor demand, trend-following behaviour, and narrative strength. Buying begets buying. The price rises because other people are buying, not because the business has improved. These moves can persist for extended periods, but they lack the same floor. When the narrative shifts or liquidity conditions change, the reversal can be sharp.
Goldman Sachs has catalogued momentum reversal episodes of comparable scale going back to 1980, identifying only 11 instances where AI-driven or theme-driven surges reached current intensity, each of which ultimately reversed within roughly one month of peaking.
| Characteristic | Fundamentals-Driven Rally | Momentum-Driven Rally |
|---|---|---|
| Primary driver | Earnings, revenue, cash-flow growth | Investor demand, trend-following, narrative |
| Typical price-reaction pattern | Stocks rise on beats, fall on misses | Stocks fall on beats (already priced in) |
| Risk profile | Natural floor from business value | Sharp reversal risk when conditions shift |
The Q2 earnings-reaction anomaly, where strong results produced negative price moves, is a practical example of a market that has transitioned toward the right-hand column. The AI infrastructure spending boom and narrow concentration of leadership, flagged independently by both Morgan Stanley and Charles Schwab, reinforce that characterisation. If you are currently holding positions because everyone else seems to be buying rather than because the underlying business has improved, this is the framework that should prompt a reassessment.
Where major institutions stand, and what their disagreements reveal
Barclays is not alone in flagging concerns, but neither is it unopposed. The institutional debate is more nuanced than “bears versus bulls,” and the nuance is itself informative.
- Goldman Sachs projects approximately 12% full-year S&P 500 returns for 2026, underpinned by roughly 12% EPS growth and support from Fed easing (these figures have not been independently verified against primary filings and should be treated as directional).
- Charles Schwab argues earnings remain the primary bull market driver, though leadership is narrow and concentrated in AI and energy-related sectors.
- Morgan Stanley points to a sharp rebound driven by heavy AI-infrastructure spending and rising earnings expectations, but warns that gains are concentrated in a relatively small group of stocks, with rising long-term rates and fragile household balance sheets posing meaningful risks.
The narrow leadership flagged by Morgan Stanley and Charles Schwab is not a new concern for 2026; index concentration risk has been building since the post-pandemic cycle, with five mega-cap names controlling roughly 23% of the broad market and amplifying both the upside and the downside of any factor rotation.
Investors cite a “powerful corporate profit engine” and still-reasonable valuations as key supports for further gains, according to Reuters. However, higher earnings expectations raise the performance bar, making disappointments more consequential.
The signal is in what all four share, not where they diverge. Even the most optimistic forecasters acknowledge narrow leadership and rising expectations. When institutions that disagree on the headline conclusion share the same underlying concerns about concentration and valuation stretch, the risk-reward calculus for new buyers at current index levels is more nuanced than the year-to-date return numbers suggest.
What the disconnect means for investors weighing positions right now
This is a shrinking margin-for-error story, not an imminent crash warning. The appropriate response is heightened scrutiny, not wholesale exit. Four tests are worth running on your current holdings:
- Assess each position individually, not by index strength. A 13.1% S&P 500 gain can mask wide dispersion underneath. Evaluate whether each holding’s price move is matched by its earnings, cash-flow, and balance-sheet progress.
- Watch how stocks react to good news. A strong earnings report that produces a flat or negative price reaction is a signal that expectations are already elevated. Further upside from that holding may be limited even if the business continues to perform.
- Distinguish trend participation from late-stage momentum chasing. Ask whether you are entering an established trend at a reasonable price or chasing a move where the disappointment risk is asymmetrically larger on the downside.
- Align equity exposure with your personal volatility tolerance. In an environment of elevated valuations and narrowing margin for error, a negative surprise carries a larger downside than it did at the start of this cycle. Position sizing should reflect that asymmetry.
The full set of warning indicators, negative reactions to earnings beats, narrow AI-concentrated leadership, the Russell 2000 earnings-revision gap, and options overpricing in technology and utilities, does not guarantee a correction. Markets can remain disconnected from fundamentals for extended periods when liquidity, macro conditions, and narrative strength remain supportive. But the cost of ignoring the disconnect is an asymmetrically worse outcome when those conditions shift, and that asymmetry is the concrete reason to re-examine positioning rather than simply ride index momentum.
This article is for informational purposes only and should not be considered financial advice. Investors should conduct their own research and consult with financial professionals before making investment decisions.
Strong gains, shifting odds: where the rally stands and what to watch next
The 2026 rally is not a fiction. Corporate earnings are genuinely strong, macroeconomic conditions have improved, and the AI spending cycle has provided a legitimate catalyst. But the character of what is driving prices higher has shifted. Momentum, concentrated positioning, and elevated expectations are doing more of the work than they were six months ago, and that changes the risk profile at current levels.
Whether the disconnect narrows or widens depends on three things worth monitoring over the months ahead: whether earnings breadth improves in Q3 2026 beyond the current narrow leadership, how stocks react to forward guidance rather than backward-looking beats, and whether the liquidity and macro conditions currently supporting momentum remain intact. Those are the variables that will determine if fundamentals catch up to prices, or if prices eventually come back to fundamentals.
For readers wanting to map the specific macro conditions that could shift the liquidity and narrative environment the current rally depends on, our full explainer on macro risks beneath the S&P’s record run examines the oil supply disruption, Fed rate path uncertainty, and Treasury yield signals that the equity market has not yet fully priced.
Past performance does not guarantee future results. Financial projections are subject to market conditions and various risk factors.