
The 10-year Treasury yield is sitting near 4.70%, but Bank of America’s rates team is looking lower. That gap between where yields trade today and where a major Wall Street firm thinks they are heading is where the most consequential macro positioning call of the quarter lives.
Two incoming data releases, one on the labour market and one on core PCE inflation (the Federal Reserve’s preferred measure of underlying price pressures), are set to determine whether the last two years of elevated real yields represented a peak or a plateau. If you are trying to position around that outcome, you are making a bond yield forecast of your own, whether you frame it that way or not.
Here is what the data actually tells you: the specific numbers BofA is watching, where their yield call sits relative to the broader forecaster consensus, and which sector tilts follow logically from that view regardless of whether the exact July prints are confirmed. The framework matters as much as the numbers, because the same analytical chain applies to every data cycle ahead.
What the July macro data is actually telling us
Bank of America’s economics team put July 2026 U.S. nonfarm payrolls at a contraction of 23,000. Once downward revisions to prior months were folded in, the three-month average rate of job gains collapsed from 111,000 in June to roughly 20,000. That is not a soft patch. That is a contraction narrative.
Then the bank’s own Institute data, drawn from customer deposit account flows, told a different story. BofA Institute estimated July payroll growth at 2.0% year-over-year, up from 1.7% in June. That is acceleration, not contraction.
These two readings come from the same institution, and they point in opposite directions. The economics team’s figure is a model-based forecast. The Institute data reflects observed deposit activity across millions of consumer accounts. Neither has been confirmed by official Bureau of Labor Statistics (BLS) data.
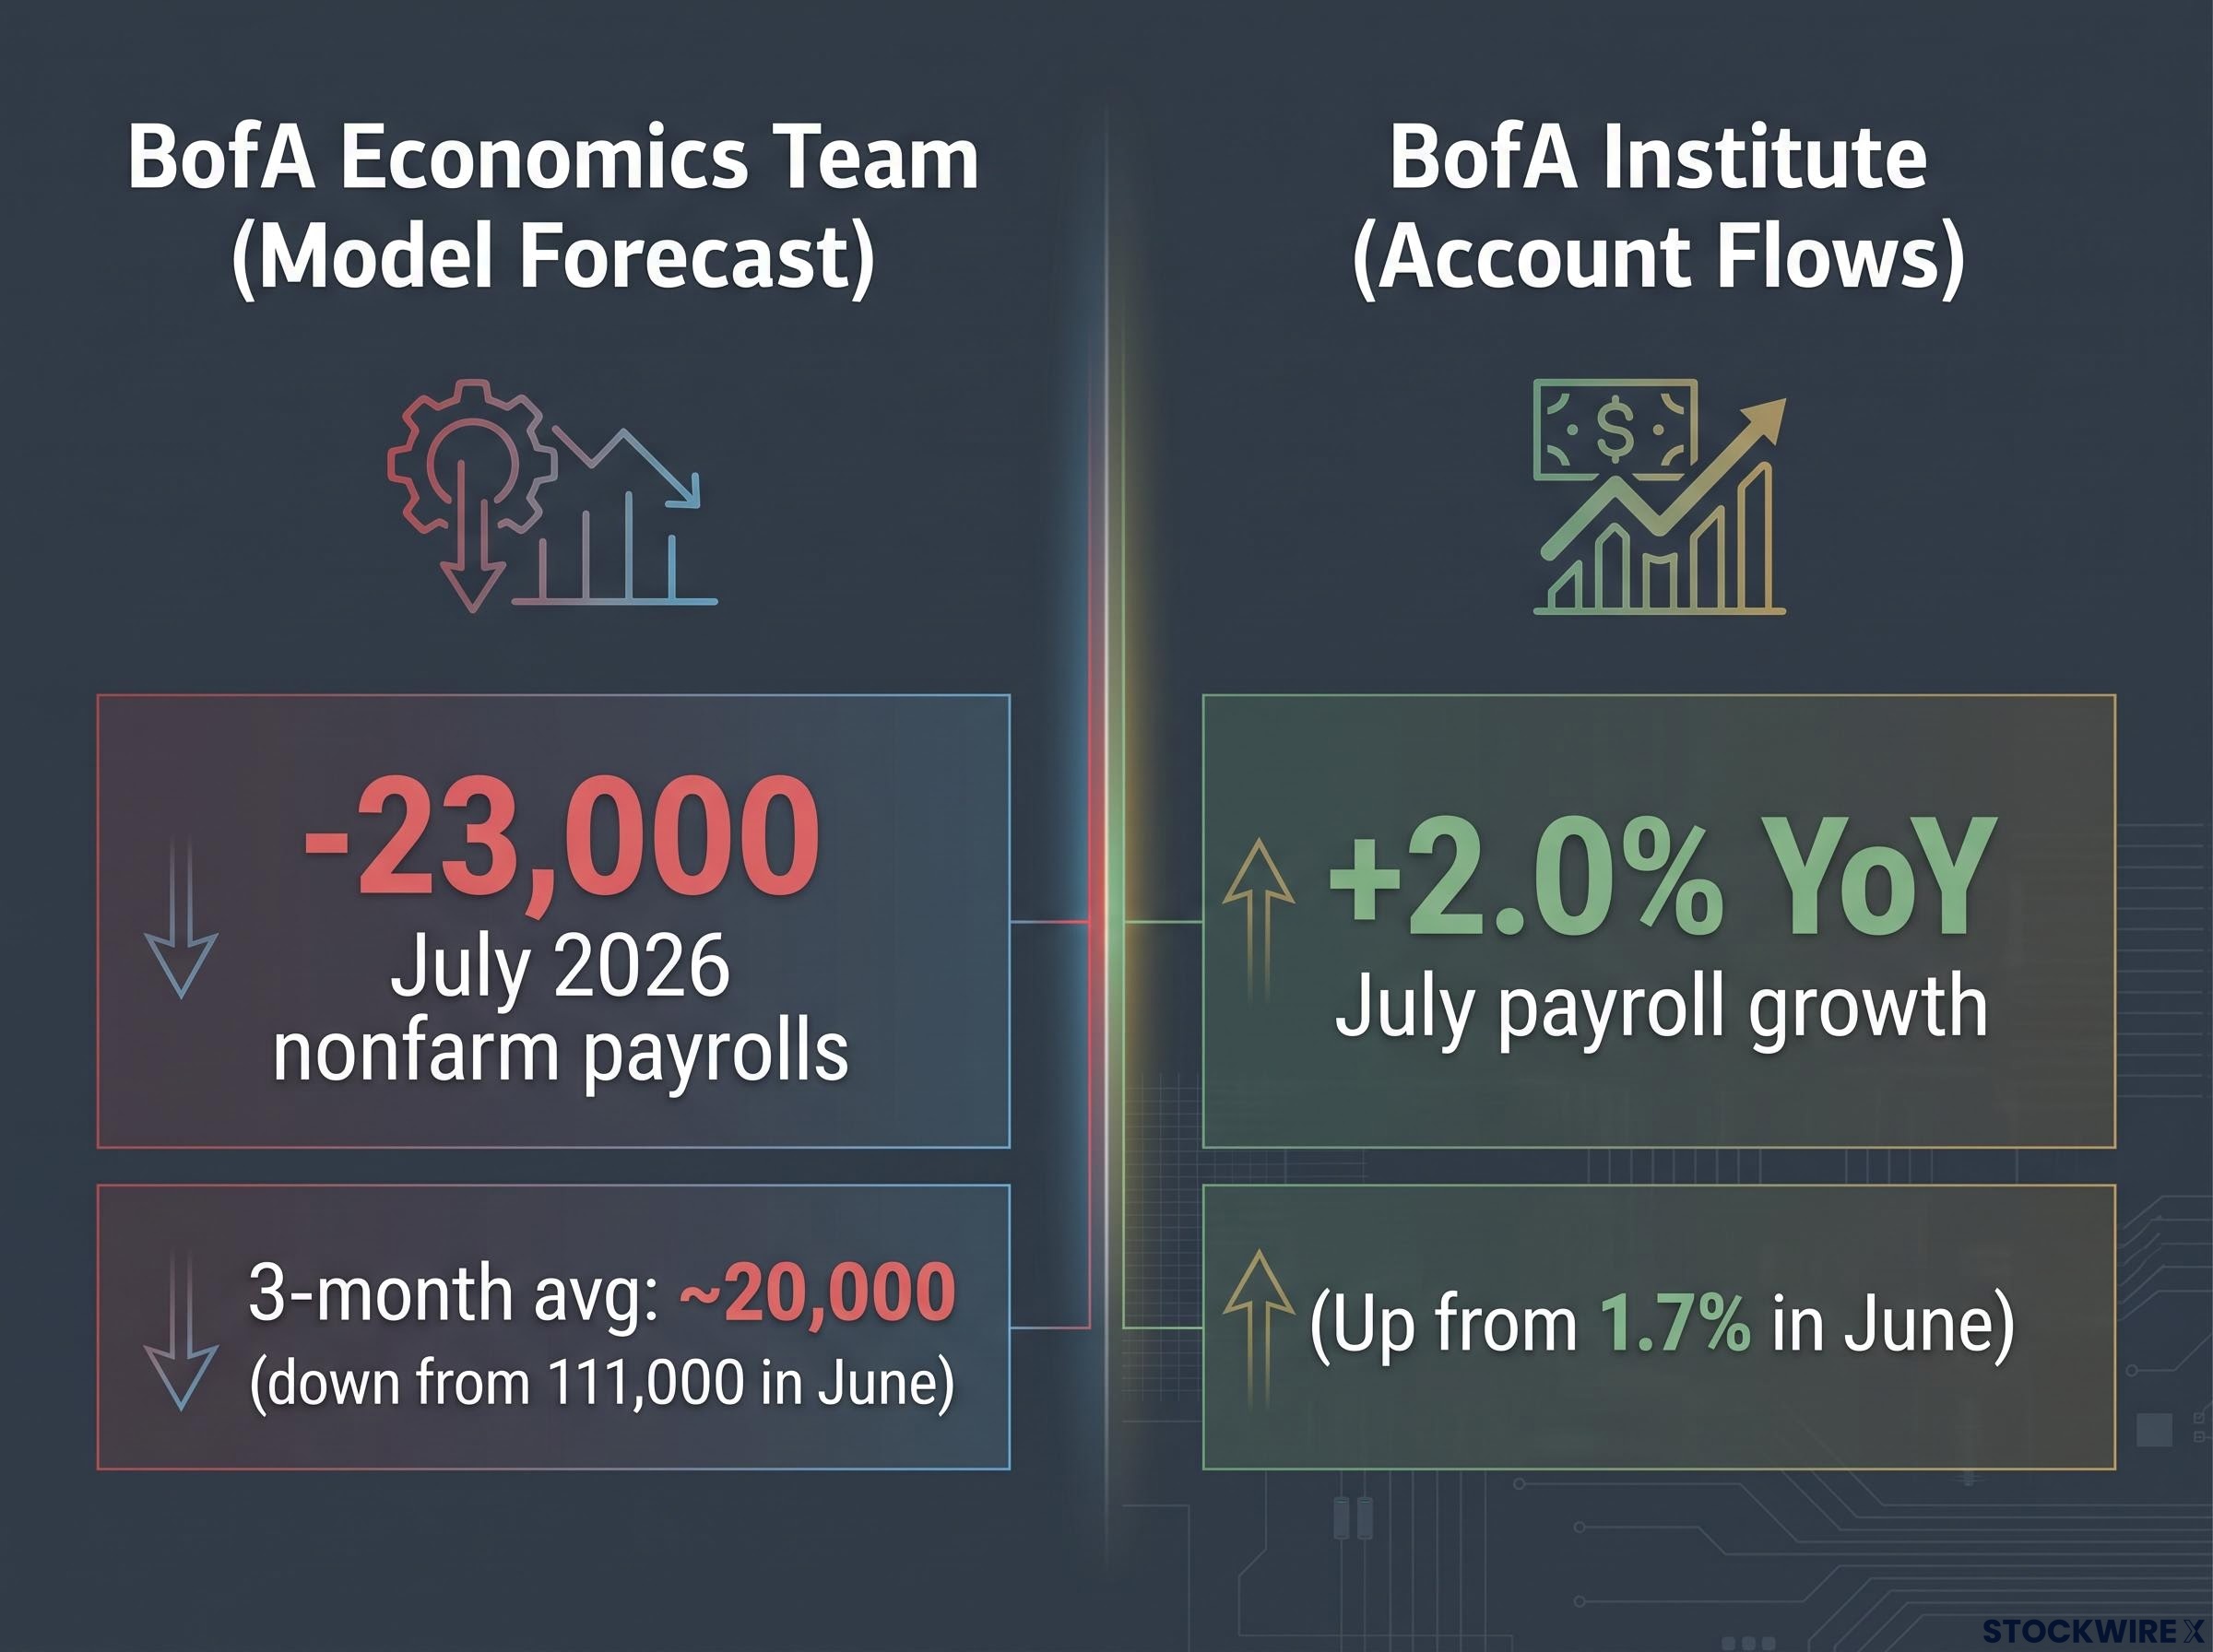
| Metric | BofA economics claim | Verified status | Official release |
|---|---|---|---|
| July 2026 nonfarm payrolls | -23,000 | Conflicts with BofA Institute (+2.0% YoY) | BLS data pending |
| 3-month avg. job creation | ~20,000 (down from 111,000) | Unconfirmed | BLS data pending |
| July 2026 core PCE (MoM) | 0.19% tracking estimate | June 2026 core PCE confirmed at 3.3% YoY | ~26 August 2026 |
What this means if you are considering acting on the contraction narrative: you are trading on a forecast, not a confirmed fact. The official BLS release has not landed. Until it does, the labour picture carries a genuine internal contradiction from the same firm making the yield call.
June payroll weakness had already signalled a deteriorating trend before BofA’s July estimates landed: the June 2026 report came in at 57,000 nonfarm payrolls, roughly half the consensus forecast, with downward revisions to April and May adding to a three-month picture that was consistently softer than real-time data had suggested.
The inflation read and why it amplifies the labour signal
The BofA economics team has a monthly core PCE inflation tracking estimate of 0.19% for July 2026. The most recent confirmed reading is for June 2026, where core PCE (which strips out food and energy to measure underlying price pressures) stood at 3.3% year-over-year.
Should the Bureau of Economic Analysis (BEA) confirm the 0.19% estimate when it publishes official data around 26 August 2026, the two-month annualised pace of core inflation would recede to around 2.0%, marking its softest reading since the prior April.
BofA is reading these two signals together: softer payrolls and a potential two-year low in annualised inflation pace as a coherent regime shift, not two isolated prints. That combined reading is the foundation for everything that follows, from the yield target to the sector rotation. The strength of that foundation depends entirely on whether the July data confirm or contradict the tracking estimates.
When big ASX news breaks, our subscribers know first
How the bond market is priced versus where BofA thinks it goes
The 10-year Treasury yield is trading near 4.70% as of mid-August 2026. That is the anchor.
The BofA rates team sees the 10-year nominal yield moving lower to 4.50% and has paired that view with a long position in inflation swaps, a combination the bank says points to scope for real yields to decline. A 20 basis point move lower may sound modest, but in a $27 trillion Treasury market, the portfolio implications of getting the direction right, or wrong, are material.
Where does this call sit relative to everyone else? Closer to consensus than you might expect.
| Institution | 3-month target | 12-month target |
|---|---|---|
| Bank of America | ~4.50% | Not specified |
| Reuters poll (August 2026) | 4.50% | 4.34% |
| Trading Economics | 4.67% | 4.46% |
| Deutsche Bank | 4.70-4.80% | 4.70-4.80% |
BofA’s 4.50% target is actually the midpoint of the mainstream consensus range. The Reuters poll and Trading Economics models broadly agree that yields drift lower over the next year. That makes this a consensus-aligned call, not a contrarian one.
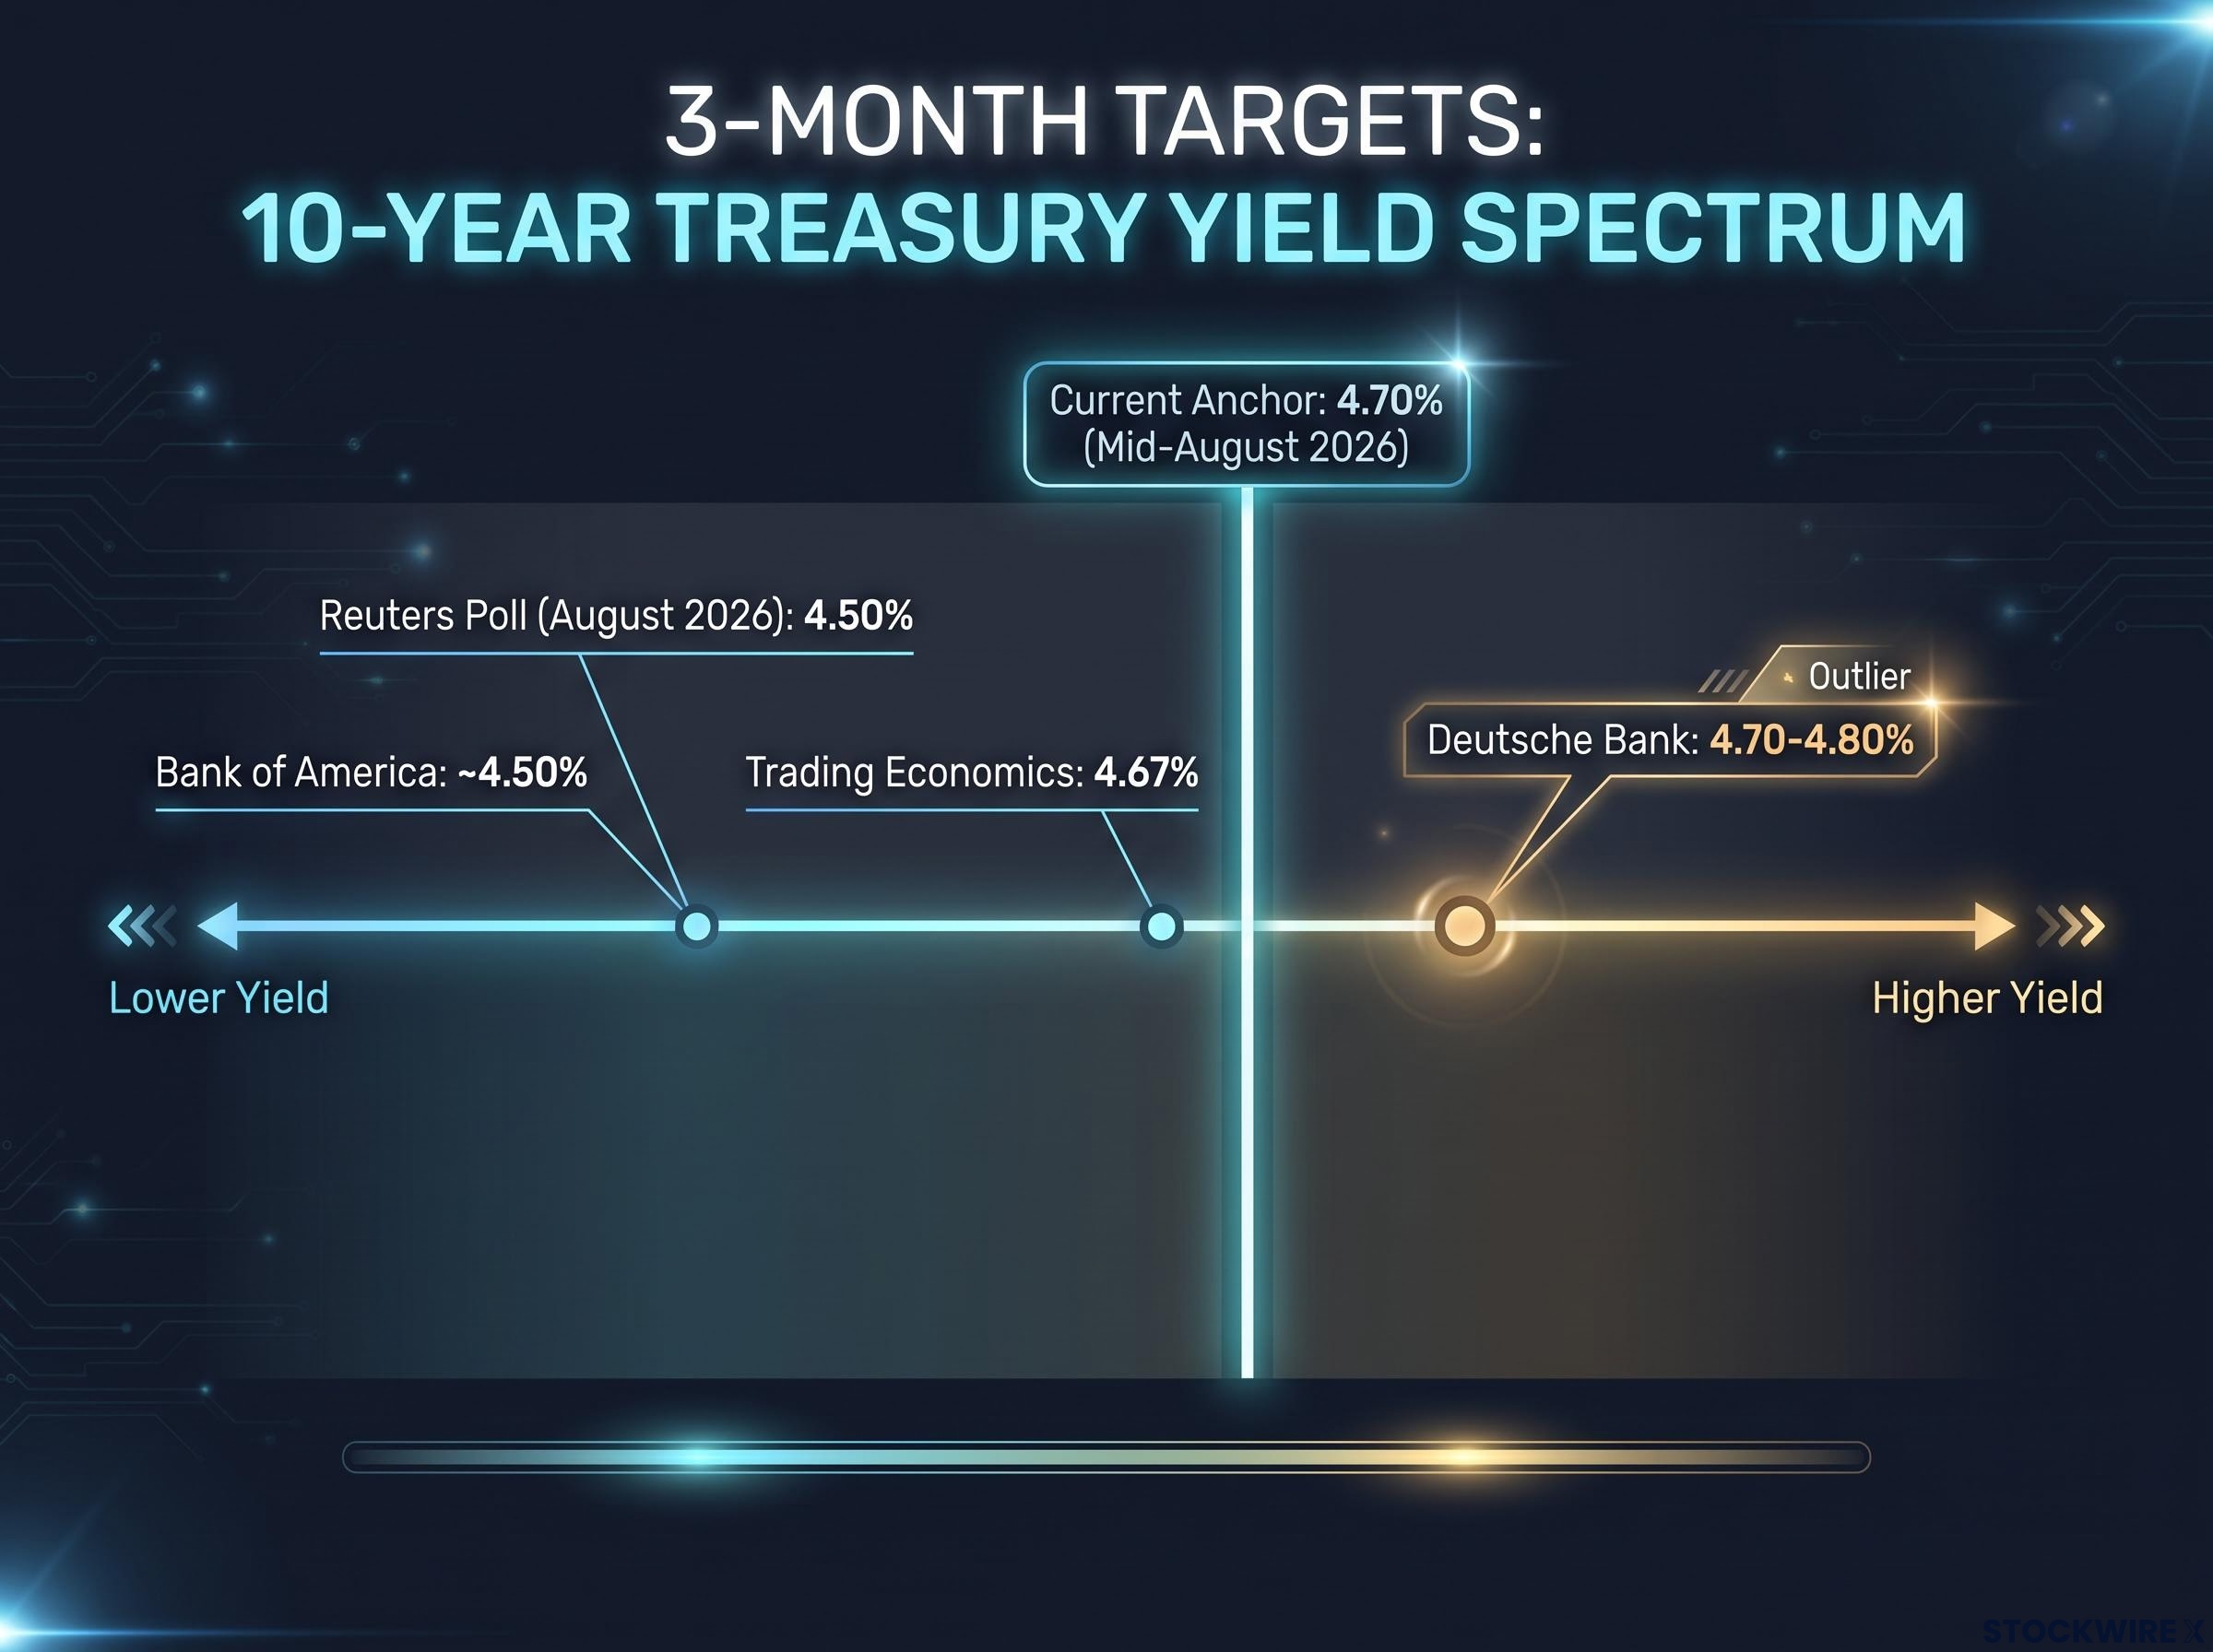
The outlier is Deutsche Bank, which projects levels near or above 4.70-4.80% by late 2026. Their view implies term premium or renewed inflation pressure could cap any bond rally, even if the directional thesis is correct.
The read for you: BofA’s call is not a rogue prediction, but the fact that Deutsche Bank sees yields staying flat or rising means the downside case is not universally priced in. Sizing any duration trade accordingly matters.
Why yields behave differently in a slowing-growth regime
The logic connecting softer macro data to lower bond yields runs through three channels, and understanding them determines whether you treat duration as a trade or a hedge.
When growth expectations soften, demand for safe assets rises. Investors rotate capital into Treasuries, pushing bond prices up and yields down. Simultaneously, weaker growth can compress inflation expectations. Since the real yield on a bond equals its nominal yield minus expected inflation, both forces push nominal yields lower when they operate together.
That is the core mechanic BofA is betting on. Their rates team sees room for real yields to compress as inflation tracking estimates cool and the labour market softens.
The transmission from softer payrolls to lower Treasury yields operates through bond yield mechanics that are worth internalising: falling growth expectations lift demand for safe assets, push bond prices higher, and mathematically compress yields, while cooler inflation expectations reduce the real yield investors demand as compensation.
Three conditions can stall a bond rally even when the directional thesis is correct:
- Term premium expansion: investors demanding extra compensation for holding long-dated bonds, often driven by fiscal supply concerns or Treasury auction dynamics
- Sticky services inflation: core services prices that refuse to cool even as goods and headline inflation moderate
- Fiscal supply pressure: heavy government bond issuance that absorbs demand and keeps yields elevated
Any of these can cap the move lower, even if growth genuinely slows. That is why the yield forecast is a probability-weighted view, not a certainty.
Duration as hedge, not just direction
BofA’s global strategists position duration (the sensitivity of a bond portfolio to interest rate changes) as serving two functions at once. It captures yield downside if the macro thesis plays out. It also acts as a buffer against weaker-than-expected risk asset performance, particularly if the market’s optimistic assumptions around AI capital expenditure growth or broader economic resilience turn out to be too generous.
This framing matters if you hold equities. Duration is not just for bond traders. In a cross-asset portfolio, extending duration acts as insurance against a growth disappointment that would hit your equity allocation. That dual function changes how much conviction you need before adding: the hedge value exists even if the directional call is only partially right.
Which sectors benefit and which face headwinds
The yield direction feeds directly into sector performance, and BofA’s sector map follows a consistent rate-sensitivity logic. Before the specific calls, three cross-cutting style tilts frame the positioning:
- Defensives over cyclicals: when bond yields fall, BofA expects defensive sectors to outpace cyclicals, as earnings stability commands a premium during periods of softening growth
- Growth over value: lower discount rates mechanically lift the present value of long-duration cash flows
- Quality over deep value: strong balance sheets and predictable earnings outperform when macro uncertainty rises
| Sector | BofA stance | Rate sensitivity rationale | Key risk |
|---|---|---|---|
| Consumer staples | Favoured | Stable earnings benefit from lower discount rates | Sticky input costs compress margins |
| Pharmaceuticals | Favoured | Long-duration cash flows re-rate higher as yields fall | Regulatory or pipeline setbacks |
| Real estate | Favoured | Income streams more attractive vs. bonds as 10-year drops toward 4.0-4.5% | Occupancy and refinancing risk |
| Financials | Underweight (downgraded) | Net interest margins compress as yields fall | Yields stay elevated (upside risk) |
The financials downgrade is worth pausing on. Following a recent rally in the sector, BofA revised its financial services positioning from market-weight to underweight. Banks and broader financials typically benefit from higher rates through wider net interest margins (the gap between what a bank earns on loans and what it pays on deposits). When yields fall, that margin compresses. Historical data consistently show financials outperforming in rising-yield, strong-growth environments and underperforming when yields decline.
Cross-firm sector positioning in mid-2026 is not uniform: JPMorgan’s July note assigned banks an overweight on valuation grounds at the same time BofA was downgrading financials to underweight on rate-compression logic, a divergence that reflects genuinely different macro assumptions rather than noise and is worth mapping before committing to either view.
For you, the sector map implies a specific portfolio audit. If financials rallied into your portfolio at larger-than-intended weight, the rate-sensitivity logic says trim. If your defensive allocation is light heading into a potential lower-yield environment, the same logic says reassess.
The data uncertainty that changes how you act on this view
The directional thesis is coherent. The question is how much of it rests on data that has not been confirmed.
What is confirmed: June 2026 core PCE at 3.3% year-over-year. The 10-year yield near 4.70% as of mid-August 2026. BofA’s financials downgrade and sector positioning.
What is not confirmed: the July payroll contraction of -23,000. The three-month average collapse to approximately 20,000. The July core PCE tracking estimate of 0.19%. All of these remain forecasts or internal estimates.
Key uncertainty: BofA’s own Institute data, based on consumer deposit account flows, shows July payroll growth accelerating to 2.0% year-over-year from 1.7% in June. This directly conflicts with the economics team’s contraction estimate. The two readings have not been reconciled.
That conflict creates two legitimate implementation postures:
- Assess your current financial sector weight after the recent rally. The downgrade logic holds whether the exact July data confirm or not, because the rally itself created a valuation question.
- Review your duration positioning. Even a partial move toward 4.50% has portfolio implications. Duration’s hedge function exists independent of the precise payroll number.
- Flag 26 August 2026 as a decision checkpoint. The official July PCE release will either validate the two-month annualised pace dropping to 2.0% or reset the thesis. Have your decision framework ready before the number lands.
- Identify specific defensive names or ETFs already in your portfolio. The sector rotation does not require new positions if you already hold consumer staples, pharma, or real estate exposure at reasonable weight.
The sector tilts have historical backing that makes them directionally sound even if the specific July data are revised. Defensives outperforming cyclicals when yields fall is not a one-month phenomenon; it is a pattern that holds across multiple rate cycles. But the pace and size of any position changes should track data confirmation, not get ahead of it.
For investors wanting to translate BofA’s duration thesis into specific portfolio decisions, our dedicated guide to bond investing strategy covers how to evaluate selling versus shortening duration, the role of bond ladders, and how current yield levels compare to historical forward return profiles.
Positioning before the 26 August inflection point
BofA’s thesis has two parts: softer macro data as the input, lower yields and defensive sector outperformance as the output. The chain of reasoning is sound, grounded in rate-sensitivity mechanics that have held across historical cycles. Where the chain is still provisional is in its starting link: the July labour and inflation numbers that have not yet been officially confirmed.
The 26 August PCE release functions as a near-term verdict. A confirmed 0.19% monthly core PCE reading would validate the turning-point narrative and reinforce the case for duration and defensive positioning. A hotter print would reset both the yield target and the sector calls, potentially reviving the Deutsche Bank scenario where yields hold near 4.70-4.80%.
The broader principle is transferable beyond this single data cycle. Macro data feeds yield direction. Yield direction feeds sector rotation. That analytical chain applies every time a payroll or inflation release reshapes the rate outlook. Building the framework now means you are not starting from zero when the next inflection point arrives.
This article is for informational purposes only and should not be considered financial advice. Investors should conduct their own research and consult with financial professionals before making investment decisions. Financial projections discussed in this article are subject to market conditions and various risk factors. Past performance does not guarantee future results.