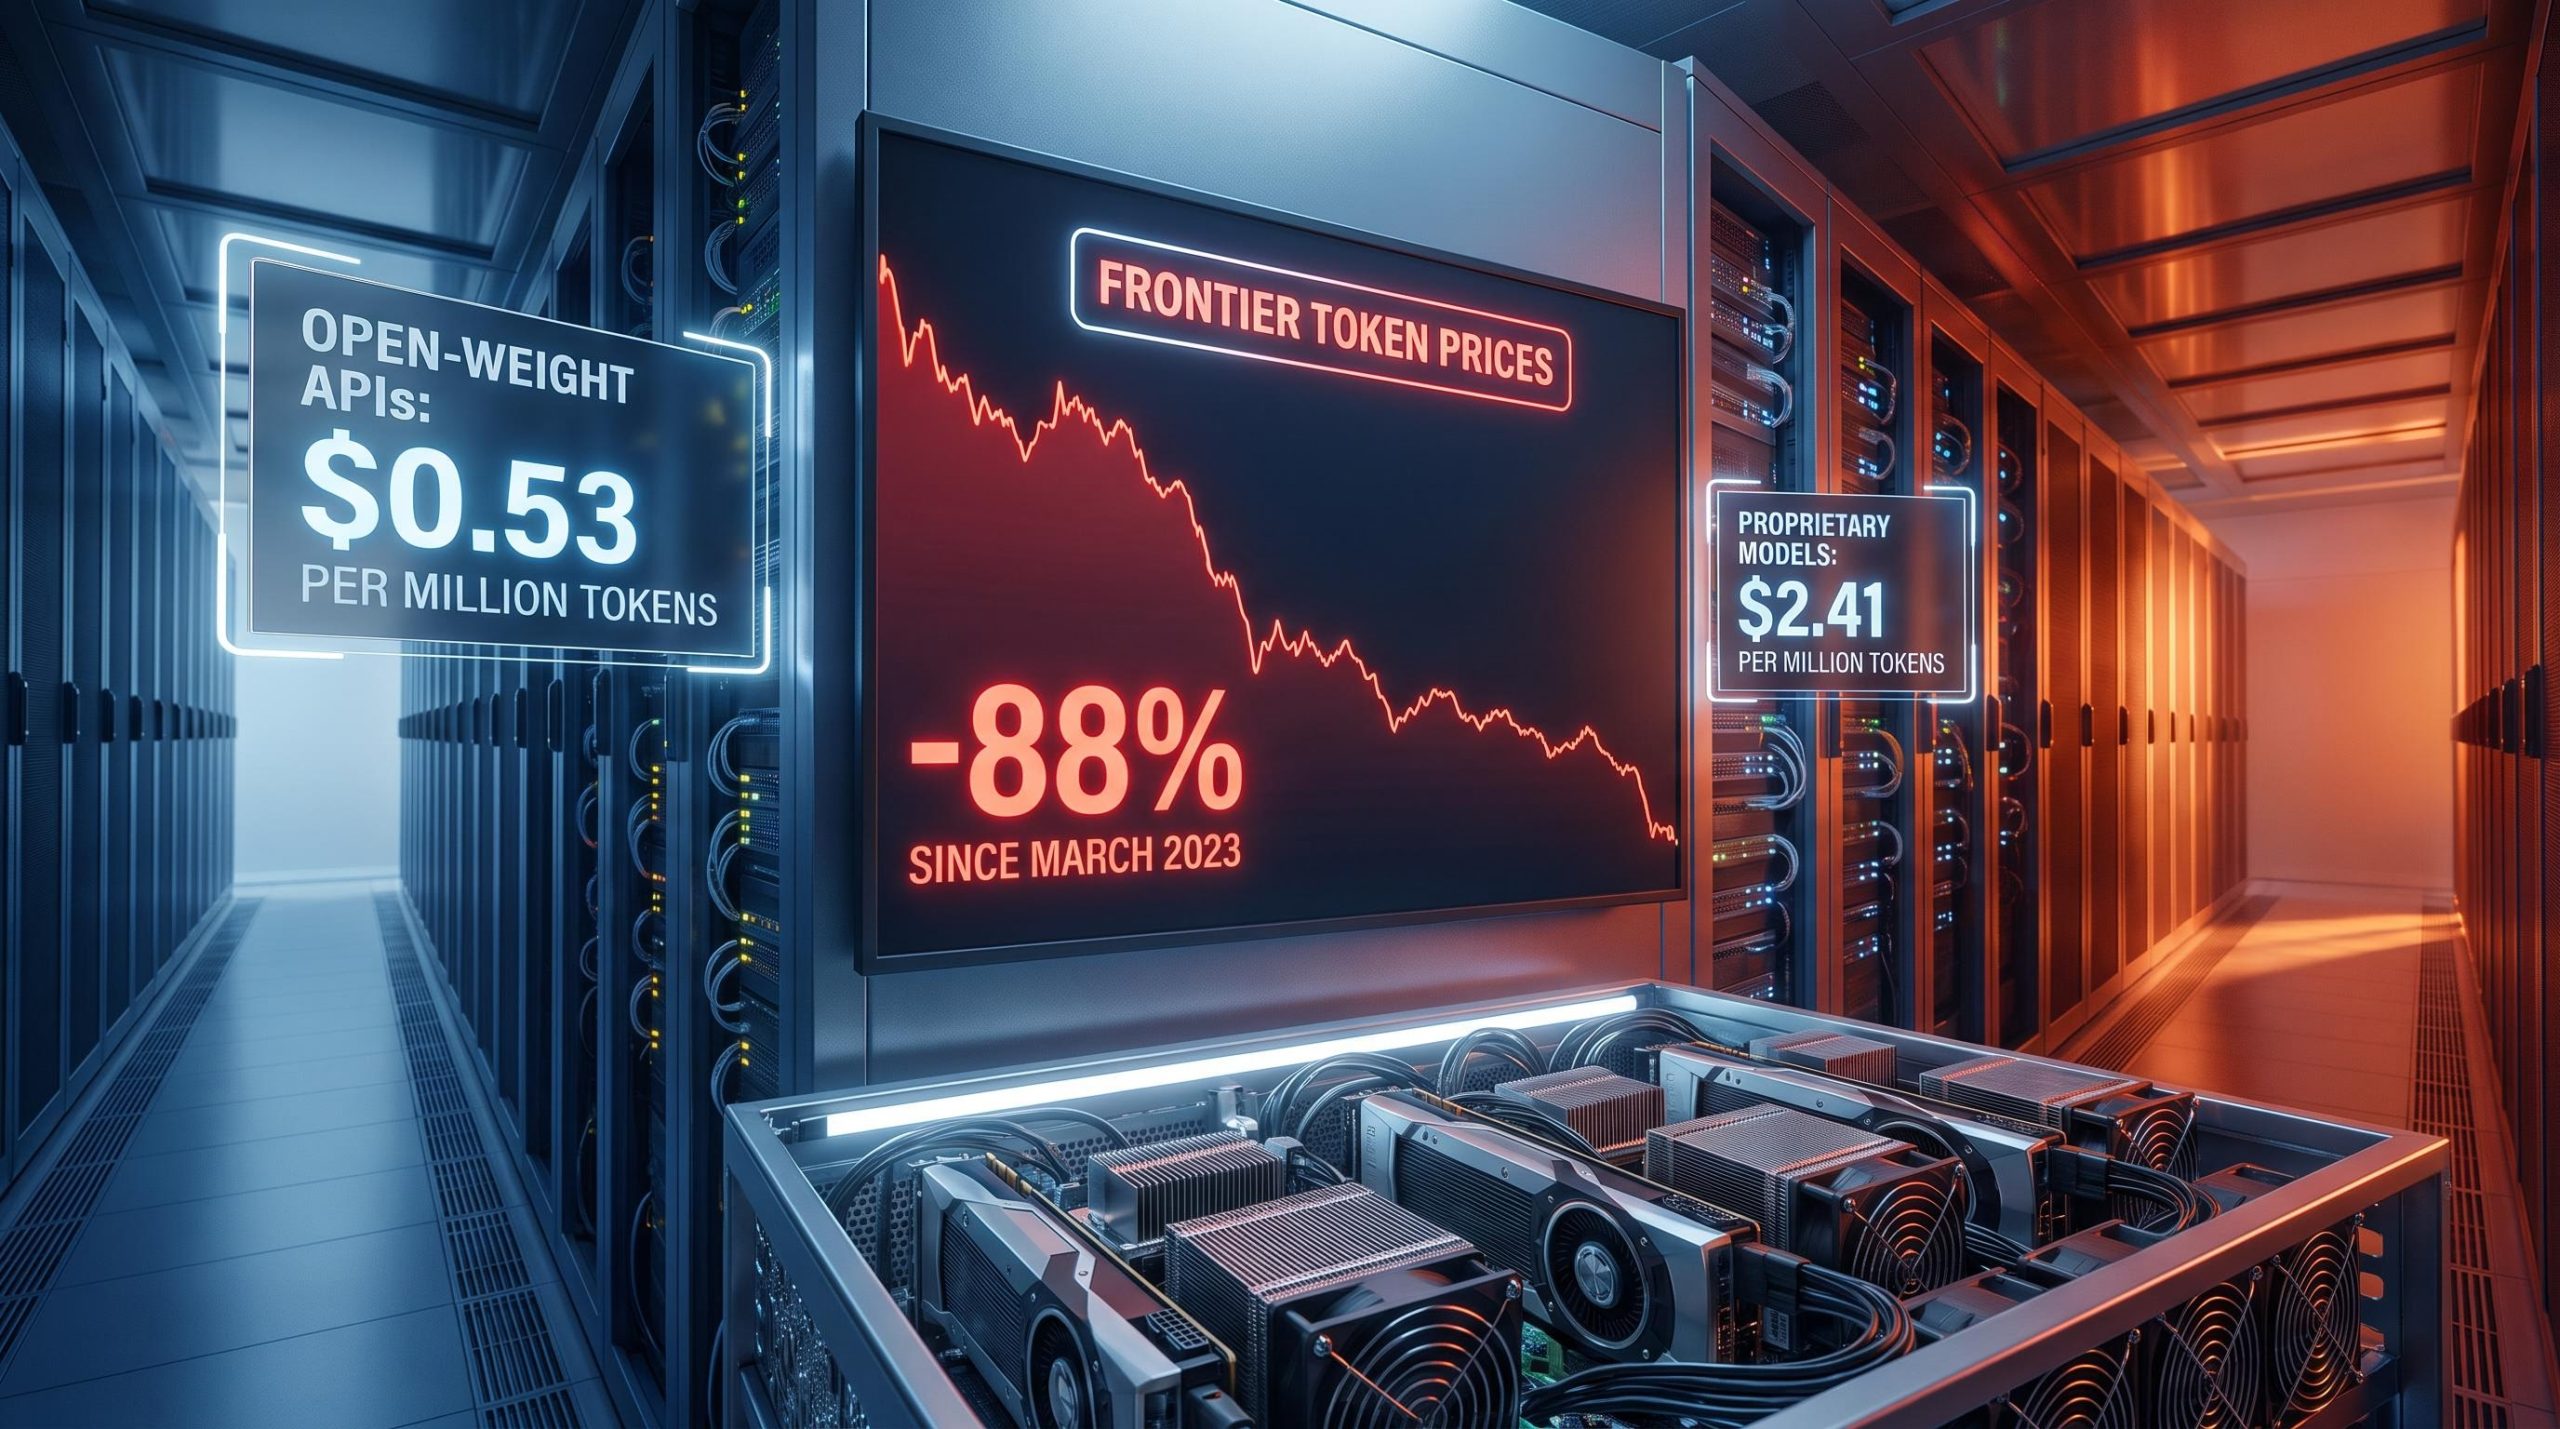
Frontier token prices have fallen roughly 88% from their March 2023 level. That single number should frame every conversation about where returns in model-layer AI actually sit.
The decline is not a pricing war that ends when one lab blinks. It is a structural consequence of open-weight AI models giving enterprises a credible, permanent alternative to proprietary API access. Enterprises now have leverage they did not have two years ago, and they are using it. The result is that enormous capital commitments are being locked into GPU infrastructure at the exact moment per-unit economics are compressing quarter by quarter.
What follows is a framework for separating the AI investments where returns can hold from the ones where they probably cannot. Morgan Stanley’s ROIC modelling, published yesterday, provides the quantitative scaffolding. The structural divide between model-layer and infrastructure-layer economics provides the lens. Together, they give you a specific set of questions to apply to any AI position in your portfolio.
What open-weight models actually change about enterprise economics
The substitution logic is straightforward once you see it from the enterprise side. An open-weight model makes its parameters (the trained “weights” that define how the model behaves) publicly available for download and deployment. That changes the enterprise procurement calculation in three steps:
- Download the model weights onto hardware you control
- Lease GPUs from a cloud provider or deploy on-premises infrastructure
- Convert what was a variable per-token API cost into a more controllable infrastructure and operations expense
The financial comparison is stark. According to BenchLM data (which has not been independently verified), open-weight APIs carry a median price of approximately $0.53 per million tokens, compared with roughly $2.41 for proprietary models at a blended 3:1 input-to-output ratio.
Median pricing gap: Open-weight APIs cost approximately $0.53 per million tokens versus $2.41 for proprietary models, a roughly 78% discount. (BenchLM data; not independently verified.)
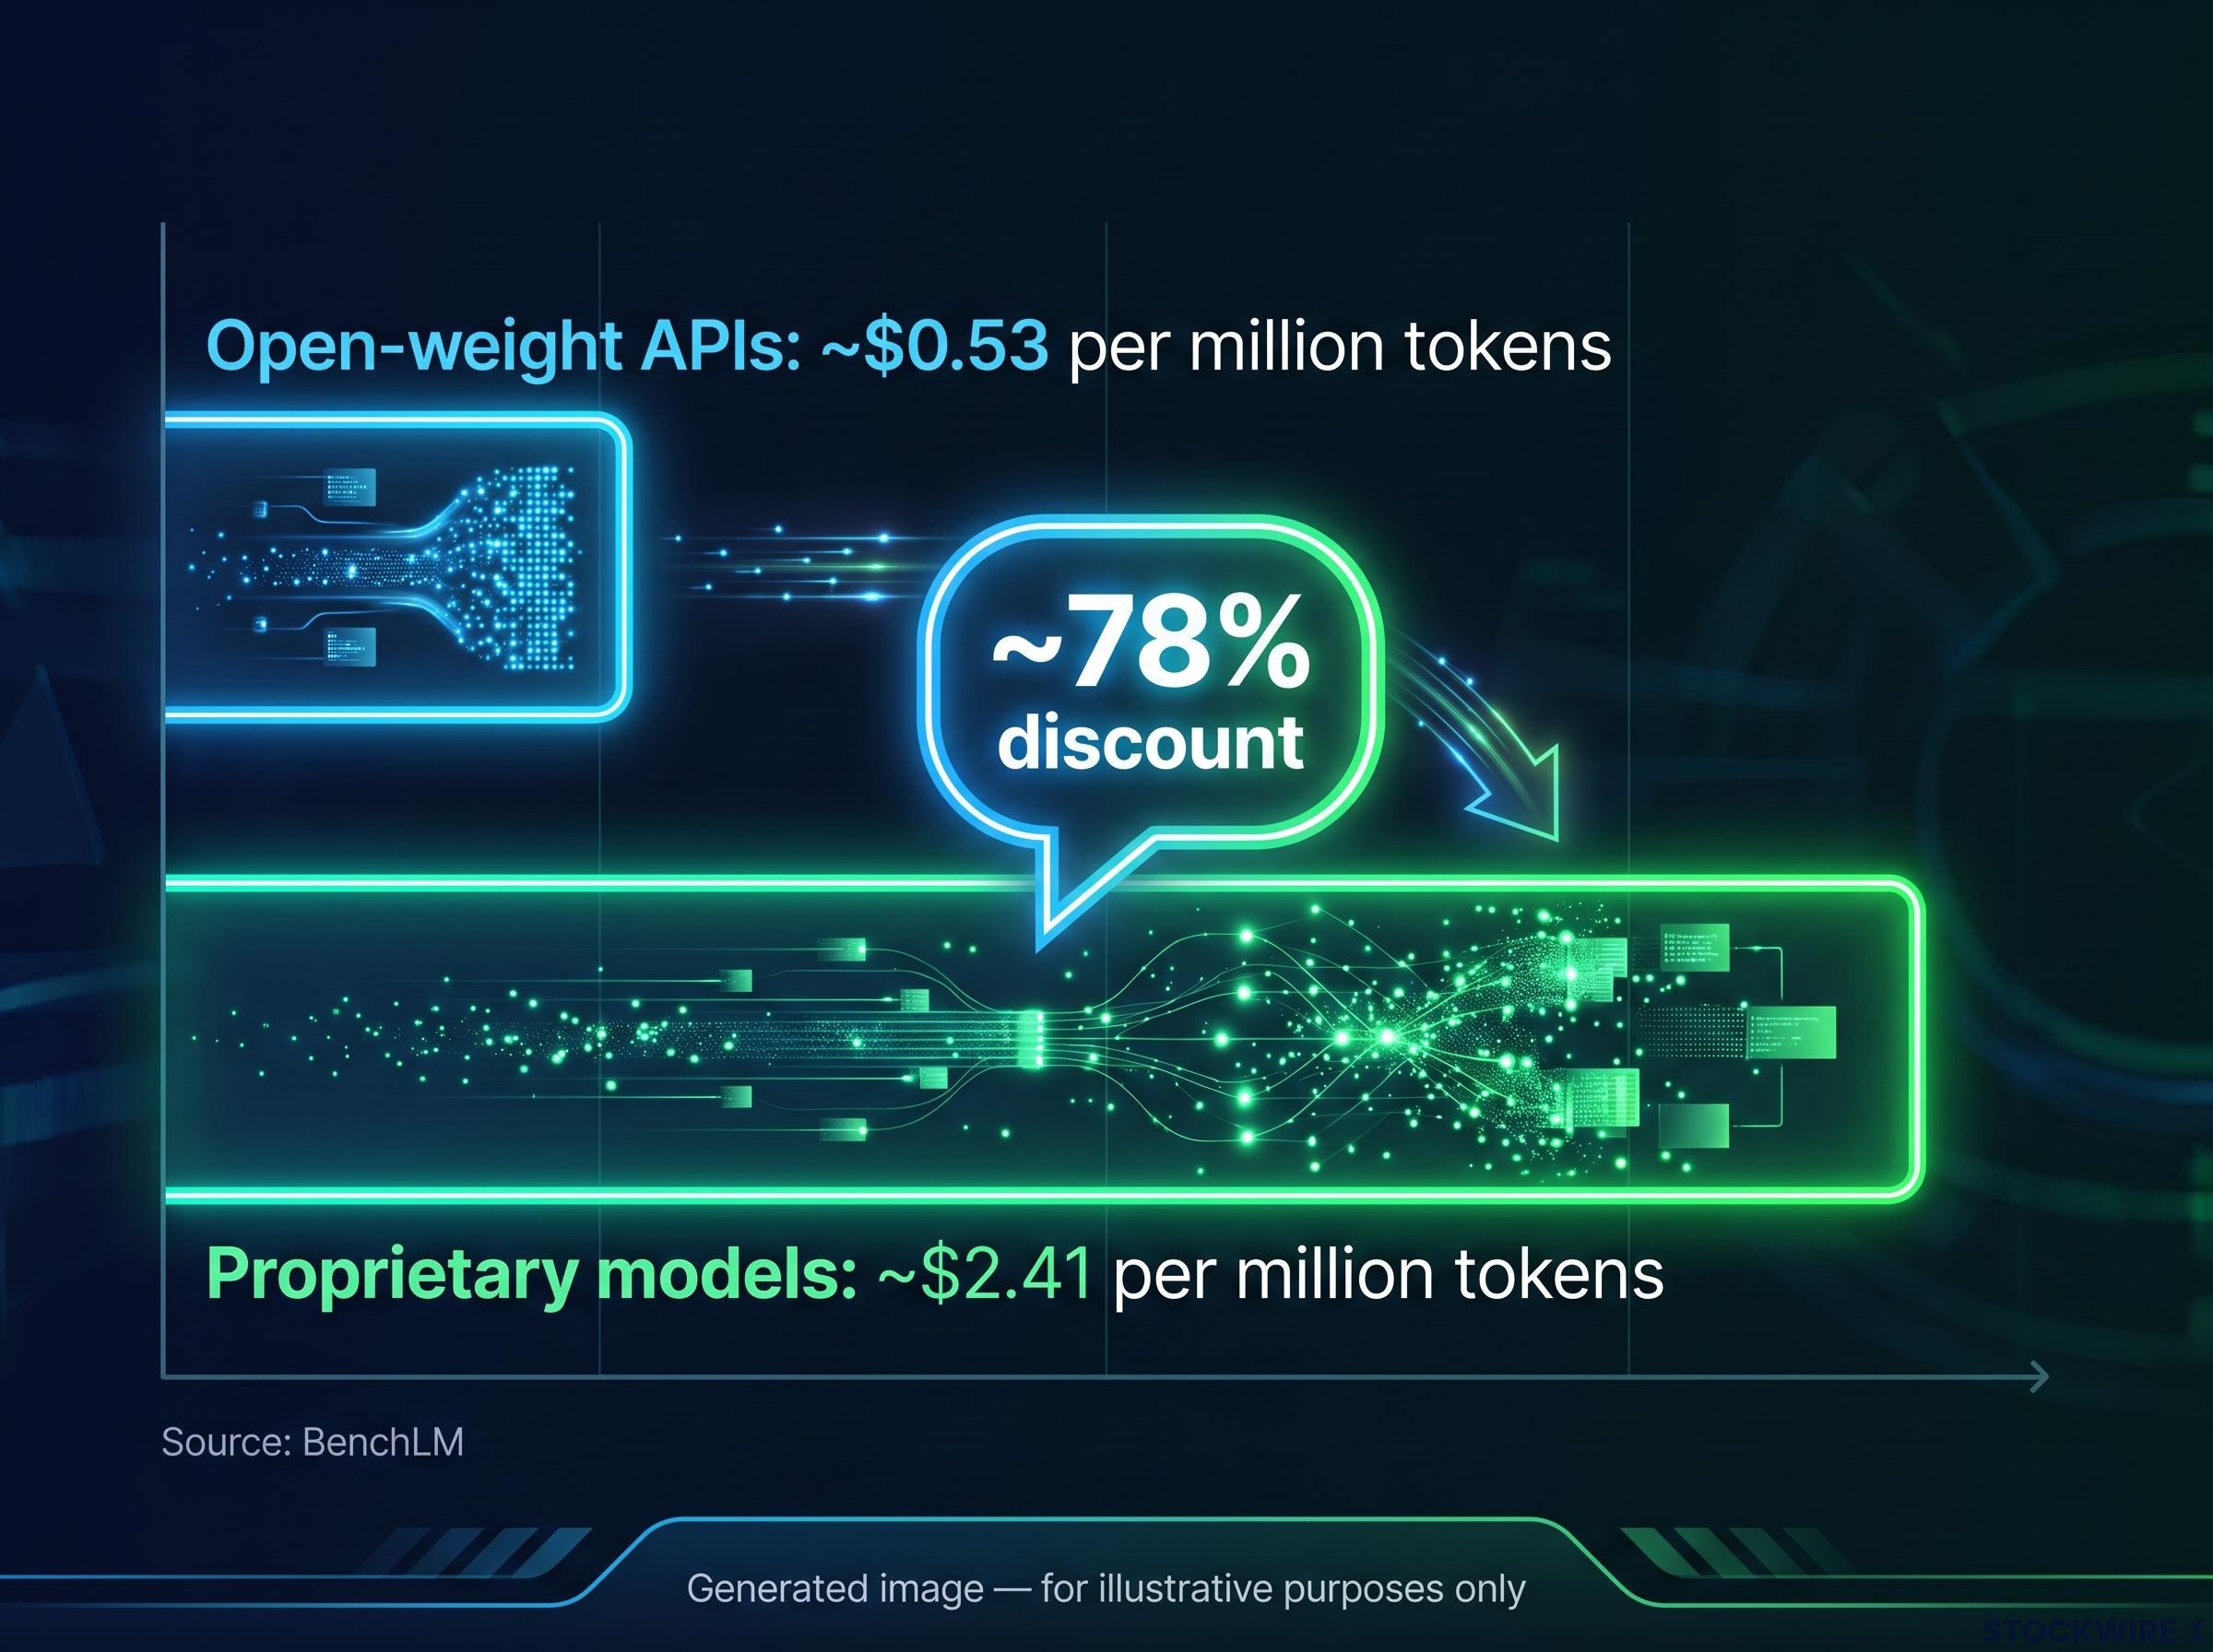
That gap does not just benefit enterprises that switch to open-weight models. It gives every enterprise negotiating leverage against proprietary vendors, whether or not they ultimately self-host. The floor price set by open-weight alternatives pulls market-wide pricing downward as an arithmetic consequence. Production-grade models are now available at a few cents per million tokens on the low end; most frontier proprietary models cluster in the $1-$15 per million input token range. The pricing ceiling is falling toward a floor that proprietary labs did not set and cannot control.
Frontier lab valuations built on pricing-premium assumptions face a compounding pressure that extends beyond domestic open-weight alternatives; Kimi K3 from Moonshot AI scores within half a percentage point of OpenAI’s flagship on Terminal-Bench 2.1 while its full model weights are scheduled for free public release, converting a pricing competitor into a zero-cost self-hosting option.
When big ASX news breaks, our subscribers know first
The open-weight model explained: weights, flexibility, and why this matters now
An open-weight model is one whose parameters, the numerical values the model learned during training, are made publicly available. Anyone with suitable hardware can download those weights, run the model, fine-tune it on their own data, and deploy it inside their own security perimeter. No vendor API required. No per-token fee to a third party.
The contrast with proprietary models is structural. When you use a proprietary API, the vendor controls the model, sets the price, handles the compute, and retains the ability to change terms. When you deploy an open-weight model, you control the model and the compute stack. You can adapt it for domain-specific tasks, run it inside regulated environments, and operate without vendor dependency.
Morgan Stanley’s framework captures the downstream consequence directly: open-weight proliferation is projected to accelerate GenAI enterprise adoption while simultaneously compressing token pricing for proprietary labs. The overall AI market expands. But the economics redistribute. Aggregate adoption metrics can look strong even as model-layer margins compress, which is the nuance that headline AI revenue figures often obscure.
Why timing and enterprise readiness matter
Three developments have converged to make self-hosting viable at lower scale thresholds than in 2023. The quality gap between leading open-weight and proprietary models has narrowed measurably across standard benchmarks. Tooling for deploying, monitoring, and fine-tuning open-weight models in production has matured. And cumulative GPU cost reductions have brought the breakeven point for self-hosting within reach for mid-sized enterprises, not just hyperscalers and large tech companies.
Epoch AI research tracking open and closed model capability convergence shows the quality gap narrowing measurably across standard benchmarks over the 2023-2025 period, providing quantitative grounding for why self-hosting thresholds have shifted for mid-sized enterprises.
The result is that the addressable pool of enterprises with a credible self-hosting option is growing each quarter, which compounds the pricing pressure on proprietary labs regardless of any individual model’s technical superiority.
Morgan Stanley’s ROIC model: what the numbers actually say
Morgan Stanley (published 15 August 2026): Base-case ROIC for a model provider owning 1 GW of Nvidia GB300-class infrastructure ranges from approximately 20% to 60%, depending on token pricing and throughput assumptions. All projections are forward-looking.
That range looks attractive until you examine what drives the spread. Two variables dominate: how much the lab earns per token, and how many tokens each GPU can serve per second. The base-case assumes token pricing of approximately $1.75 per million tokens and inference throughput of 2,000-3,500 tokens per second per GPU. Move either variable and the outcome shifts materially.
| Token price (per million) | 2,000 tok/s per GPU | 2,750 tok/s per GPU | 3,500 tok/s per GPU |
|---|---|---|---|
| ~$1.75 | Low-to-mid range | Mid range | Upper range (~60%) |
| ~$1.25 | Low range (~20%) | Low-to-mid range | Mid range |
| ~$1.00 | Below base case | Low range | Low-to-mid range |
The risk sits in the asymmetry between what is fixed and what is variable. Capital commitments, hundreds of thousands of GB300 GPUs, 1 GW of data centre capacity, are already being made. Those costs are locked. The pricing and throughput variables that determine whether the return is 20% or 60% are not within the lab’s unilateral control. Market pricing depends on competitive dynamics the lab cannot dictate. Throughput depends on engineering execution that must be sustained quarter after quarter.
A 20%-to-60% ROIC range is not a comfortable band to underwrite. It is a signal that the investment outcome depends almost entirely on execution and pricing dynamics the lab does not fully control, a categorically different risk profile from infrastructure-layer returns.
Why hyperscalers are structurally better insulated than model labs
The same Morgan Stanley framework models hyperscaler returns on a 1 GW data centre with approximately 410,000 GB300 GPUs at roughly 75% utilisation and GPU lease rates of $7-$10 per hour. The resulting ROIC range: approximately 23%-39%.
That is a narrower band. And narrower, in this context, is the point.
- Model lab ROIC: 20%-60%; driven by token pricing and throughput per GPU; directly exposed to open-weight pricing pressure
- Hyperscaler ROIC: 23%-39%; driven by GPU utilisation and lease rates; agnostic to which model the customer runs
- Sensitivity to open-weight proliferation: Model labs face direct margin compression; hyperscalers benefit from increased compute demand regardless of model choice
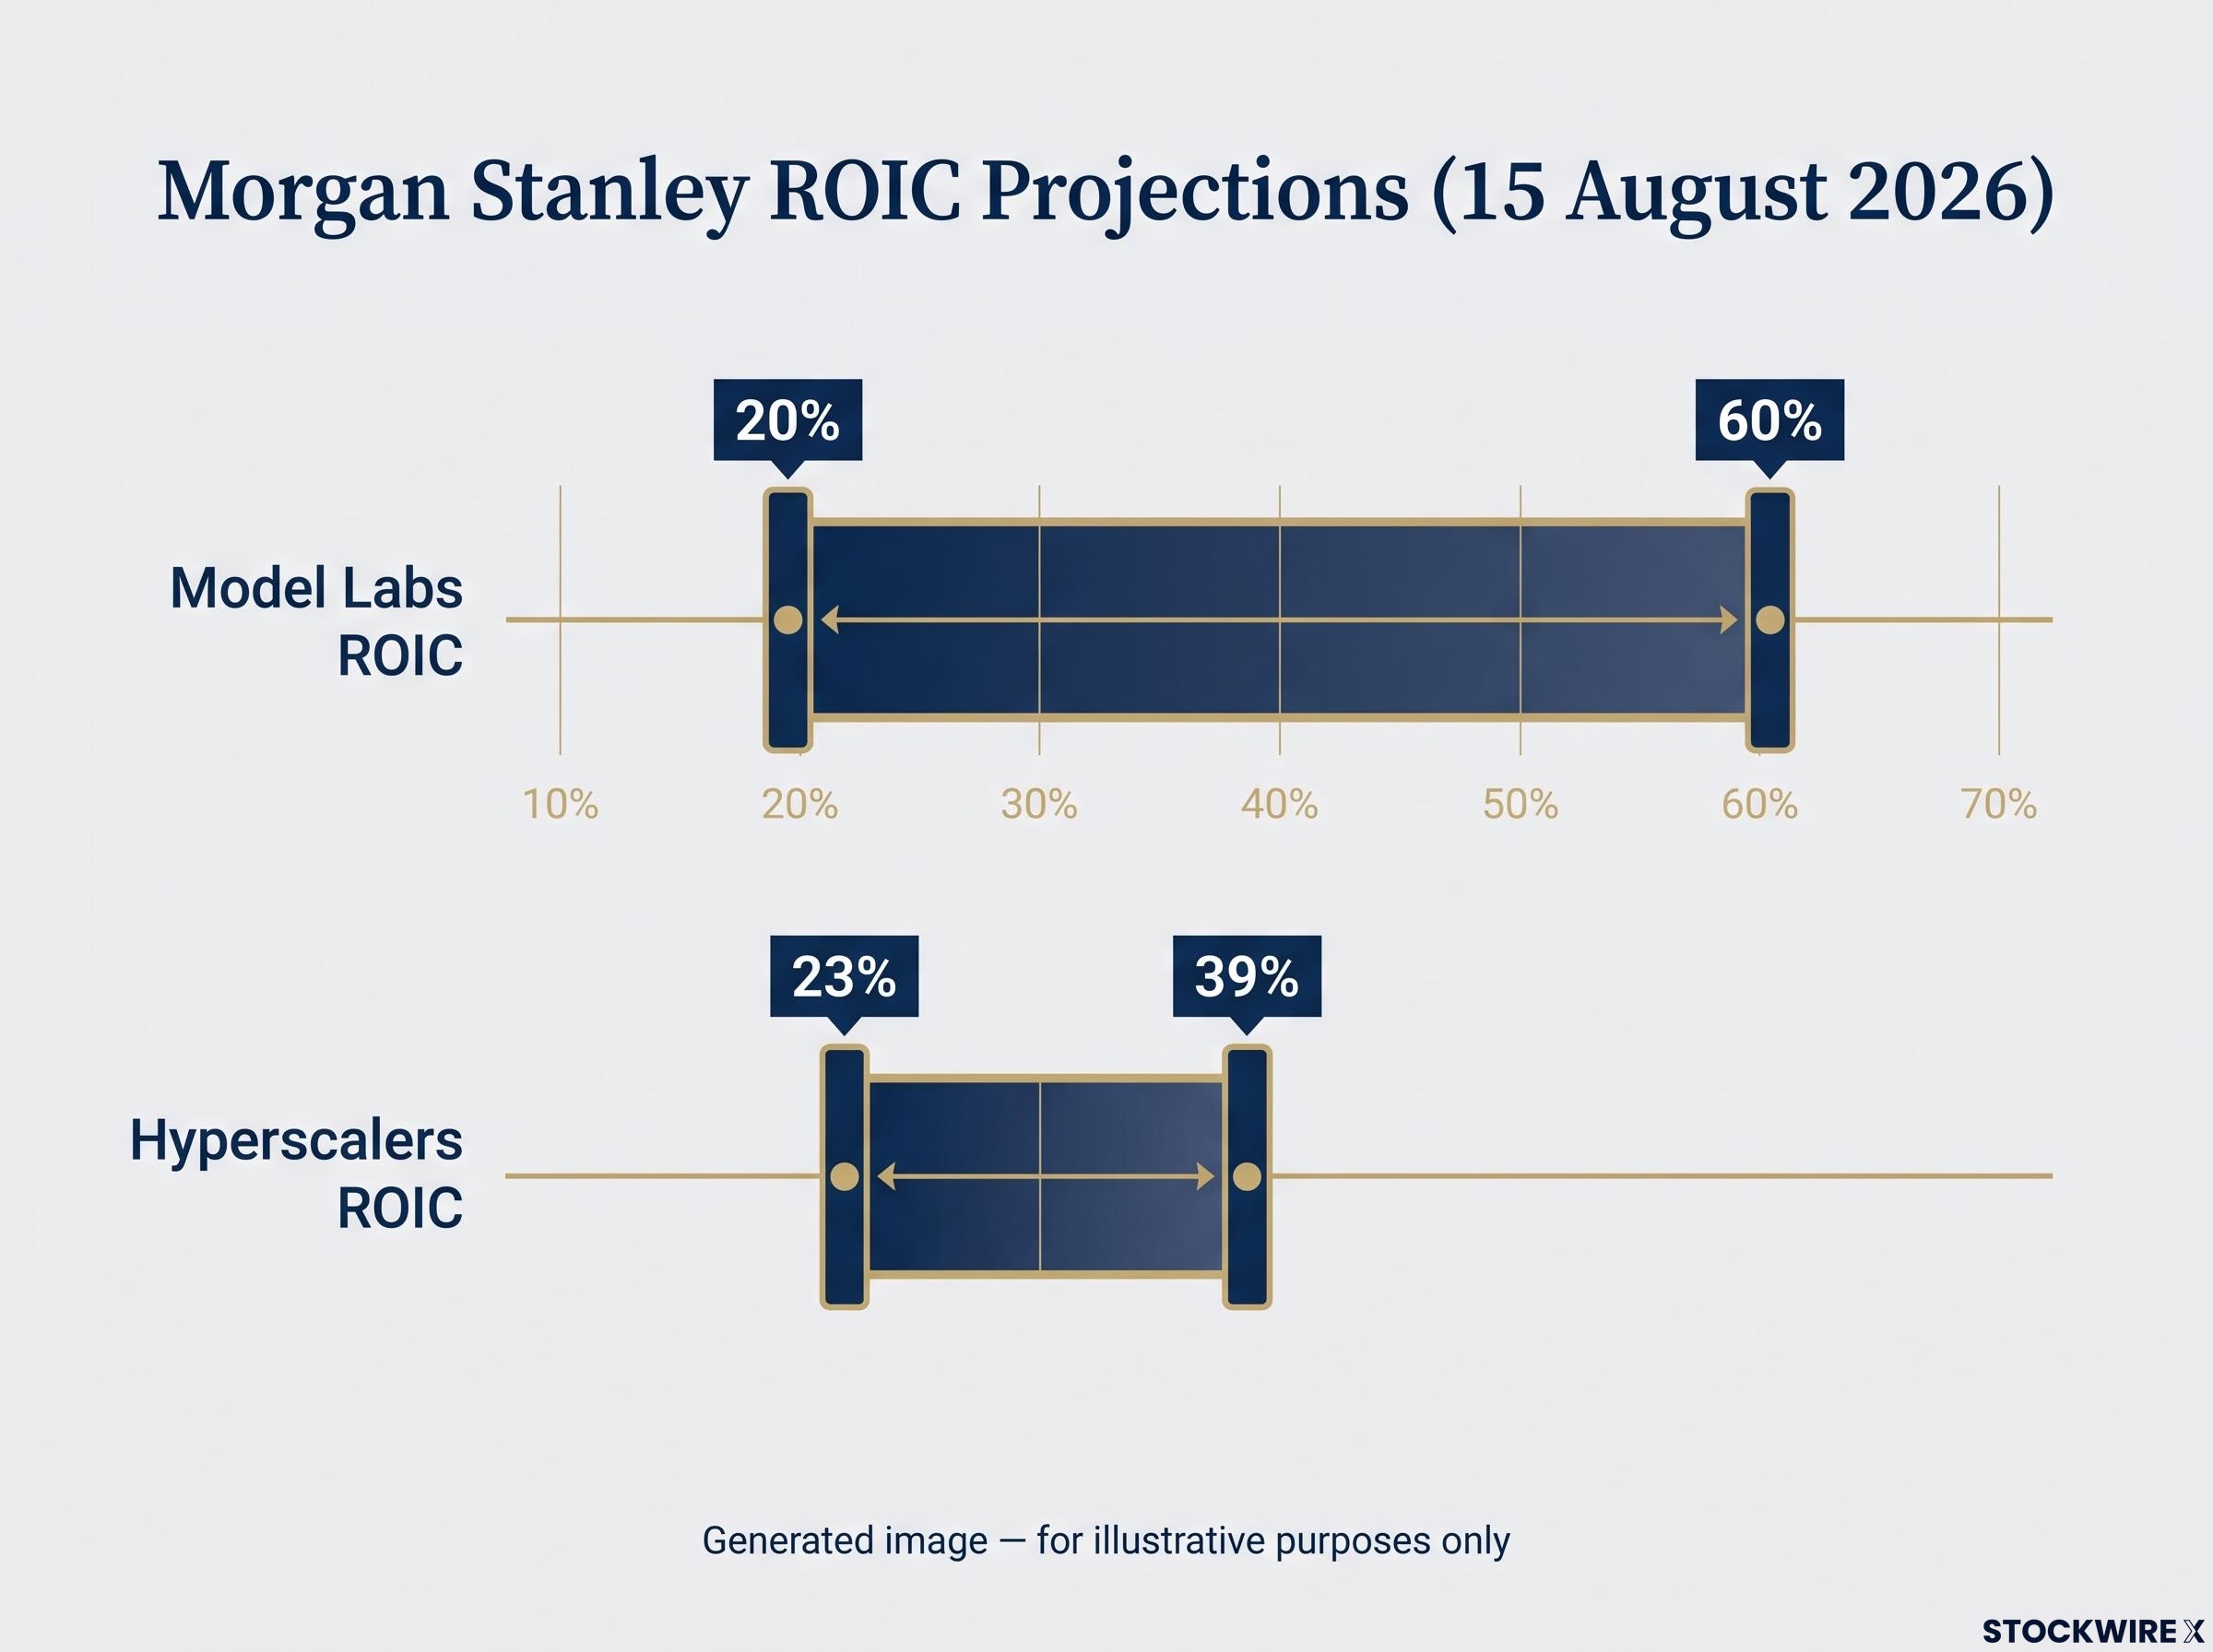
The structural difference is that hyperscalers earn on GPU hours, not on specific model tokens. Their returns are independent of whether any given enterprise uses a proprietary or open-weight model. An enterprise that migrates from a proprietary API to a self-hosted open-weight alternative still consumes GPU hours, and often more of them as AI diffuses across additional workflows.
AI supply chain investing maps the distribution of that capex across semiconductors, foundries, cloud operators, and software, revealing that profit concentration follows infrastructure economics rather than model-layer narrative, consistent with the ROIC divergence Morgan Stanley models between labs and hyperscalers.
The Jevons paradox and what it means for compute demand
The Jevons paradox describes a pattern where making a resource cheaper and more efficient leads to greater total consumption of that resource, not less. In AI, the dynamic works like this: as compute becomes cheaper and more accessible (partly because open-weight models lower the barrier to adoption), total demand for compute expands rather than contracts.
Enterprises that adopt open-weight models for cost reasons still run those models on cloud GPU infrastructure. As AI diffuses across more workflows within each organisation, aggregate GPU hours demanded increase even as per-token prices fall. Utilisation rates hold or improve under this dynamic, which is precisely what supports the hyperscaler return profile. Morgan Stanley explicitly invokes this Jevons-paradox framing in its analysis, positioning infrastructure providers as beneficiaries of the same trend that compresses model-layer margins.
For you as an investor, the distinction matters: infrastructure-layer exposure offers a more predictable return range precisely because it is agnostic to which model wins. That is a materially different risk proposition than backing a specific lab’s pricing and throughput execution.
The two levers model labs must pull to defend returns
Model labs face structural price compression. Two levers remain for defending the upper end of the ROIC range, and neither is optional.
Lever 1: Throughput optimisation. Higher tokens per second per GPU spread fixed capex and opex across more billable usage, directly improving capital efficiency. This is a margin-defence imperative, not a discretionary engineering project. The priorities are sequential:
- Inference stack optimisation at the software layer
- Batching and routing efficiency to maximise GPU utilisation per request
- Networking and scheduling improvements to reduce idle time across the fleet
Hitting the top of Morgan Stanley’s 2,000-3,500 tokens per second range requires deep, sustained execution across all three. The difference between 2,000 and 3,500 can move a lab from a low-twenties economic profile toward the upper range, but staying there demands continuous engineering investment.
Lever 2: Differentiation beyond benchmark performance. Open-weight alternatives can be fine-tuned to competitive benchmark scores rapidly, which makes raw model capability a fragile moat. More defensible differentiation must come from sources that are harder to replicate with a bare open-weight checkpoint:
Enterprise workflow integration represents one of the more durable sources of pricing premium precisely because incumbent platforms carry embedded compliance context, multi-year configurations, and system-of-record status that a bare open-weight checkpoint cannot replicate regardless of benchmark performance.
- Safety, alignment, and compliance certifications for regulated industries
- Deep integration into enterprise data governance, workflow automation, and tooling
- Auditable SLAs, monitoring, and enterprise-grade support
- Ecosystem offerings such as agents, plugins, and proprietary data services
These elements can justify a pricing premium even versus open-weight APIs that sit roughly 78% below proprietary median prices (per unverified BenchLM data). But they require sustained investment beyond the model itself.
The tension is real: labs must fund both throughput engineering and differentiated enterprise offerings simultaneously, while managing the timing risk of hardware commitments made into a falling-price environment. A lab that excels at inference optimisation but fails to build enterprise stickiness is still exposed to the pricing floor set by open-weight alternatives. Both levers need to work together for the ROIC protection to hold.
What the ROIC framework changes about how to assess AI investment risk
The structural argument lands in one sentence: open-weight models are simultaneously expanding total AI adoption and compressing the per-unit economics that model labs depend on. That makes aggregate AI adoption metrics an unreliable signal of model-layer returns.
BCA Research’s Peter Berezin frames the same structural trap through what he calls airline-like economics: massive capital intensity combined with interchangeable, commoditised output, a combination that has historically destroyed equity returns even as the underlying industry grows.
The capital-timing risk sharpens the problem. Large hardware commitments are being made into a market where per-token prices have fallen approximately 88% since March 2023 (unverified) and show no sign of stabilising. The timing of contract structures, utilisation ramp velocity, and throughput optimisation cadence will materially affect realised ROIC in ways that headline revenue figures do not capture.
The practical takeaway is a set of underwriting questions, not a verdict. When evaluating any model-lab investment, ask:
- Is the lab demonstrating throughput in the upper portion of the 2,000-3,500 tokens per second per GPU range, or is it stuck closer to the floor?
- Does the differentiation premium rest on benchmark scores (fragile) or on compliance, integration depth, and ecosystem stickiness (more durable)?
- What is the utilisation ramp timeline, and how quickly is the GPU fleet generating billable token volume?
- Do contract structures protect against further pricing erosion, or is the lab exposed to spot-market dynamics?
- Can the lab fund both throughput engineering and enterprise differentiation simultaneously at the required scale?
The hyperscaler thesis, by contrast, is underwritten on infrastructure economics that are more insulated from model-layer competitive dynamics. A 23%-39% ROIC range built on GPU hours and utilisation rates is narrower than the model-lab’s 20%-60%, but narrower here means more predictable. In a capital-intensive, fixed-cost-heavy business, a high ROIC ceiling is not a reason to favour the thesis; it is a signal of variance. And variance, when the costs are locked and the revenue variables are not, is a risk descriptor, not a reward descriptor.
This article is for informational purposes only and should not be considered financial advice. Investors should conduct their own research and consult with financial professionals before making investment decisions. All Morgan Stanley ROIC projections cited are forward-looking and subject to change based on market developments and company performance. Pricing data attributed to BenchLM has not been independently verified.