
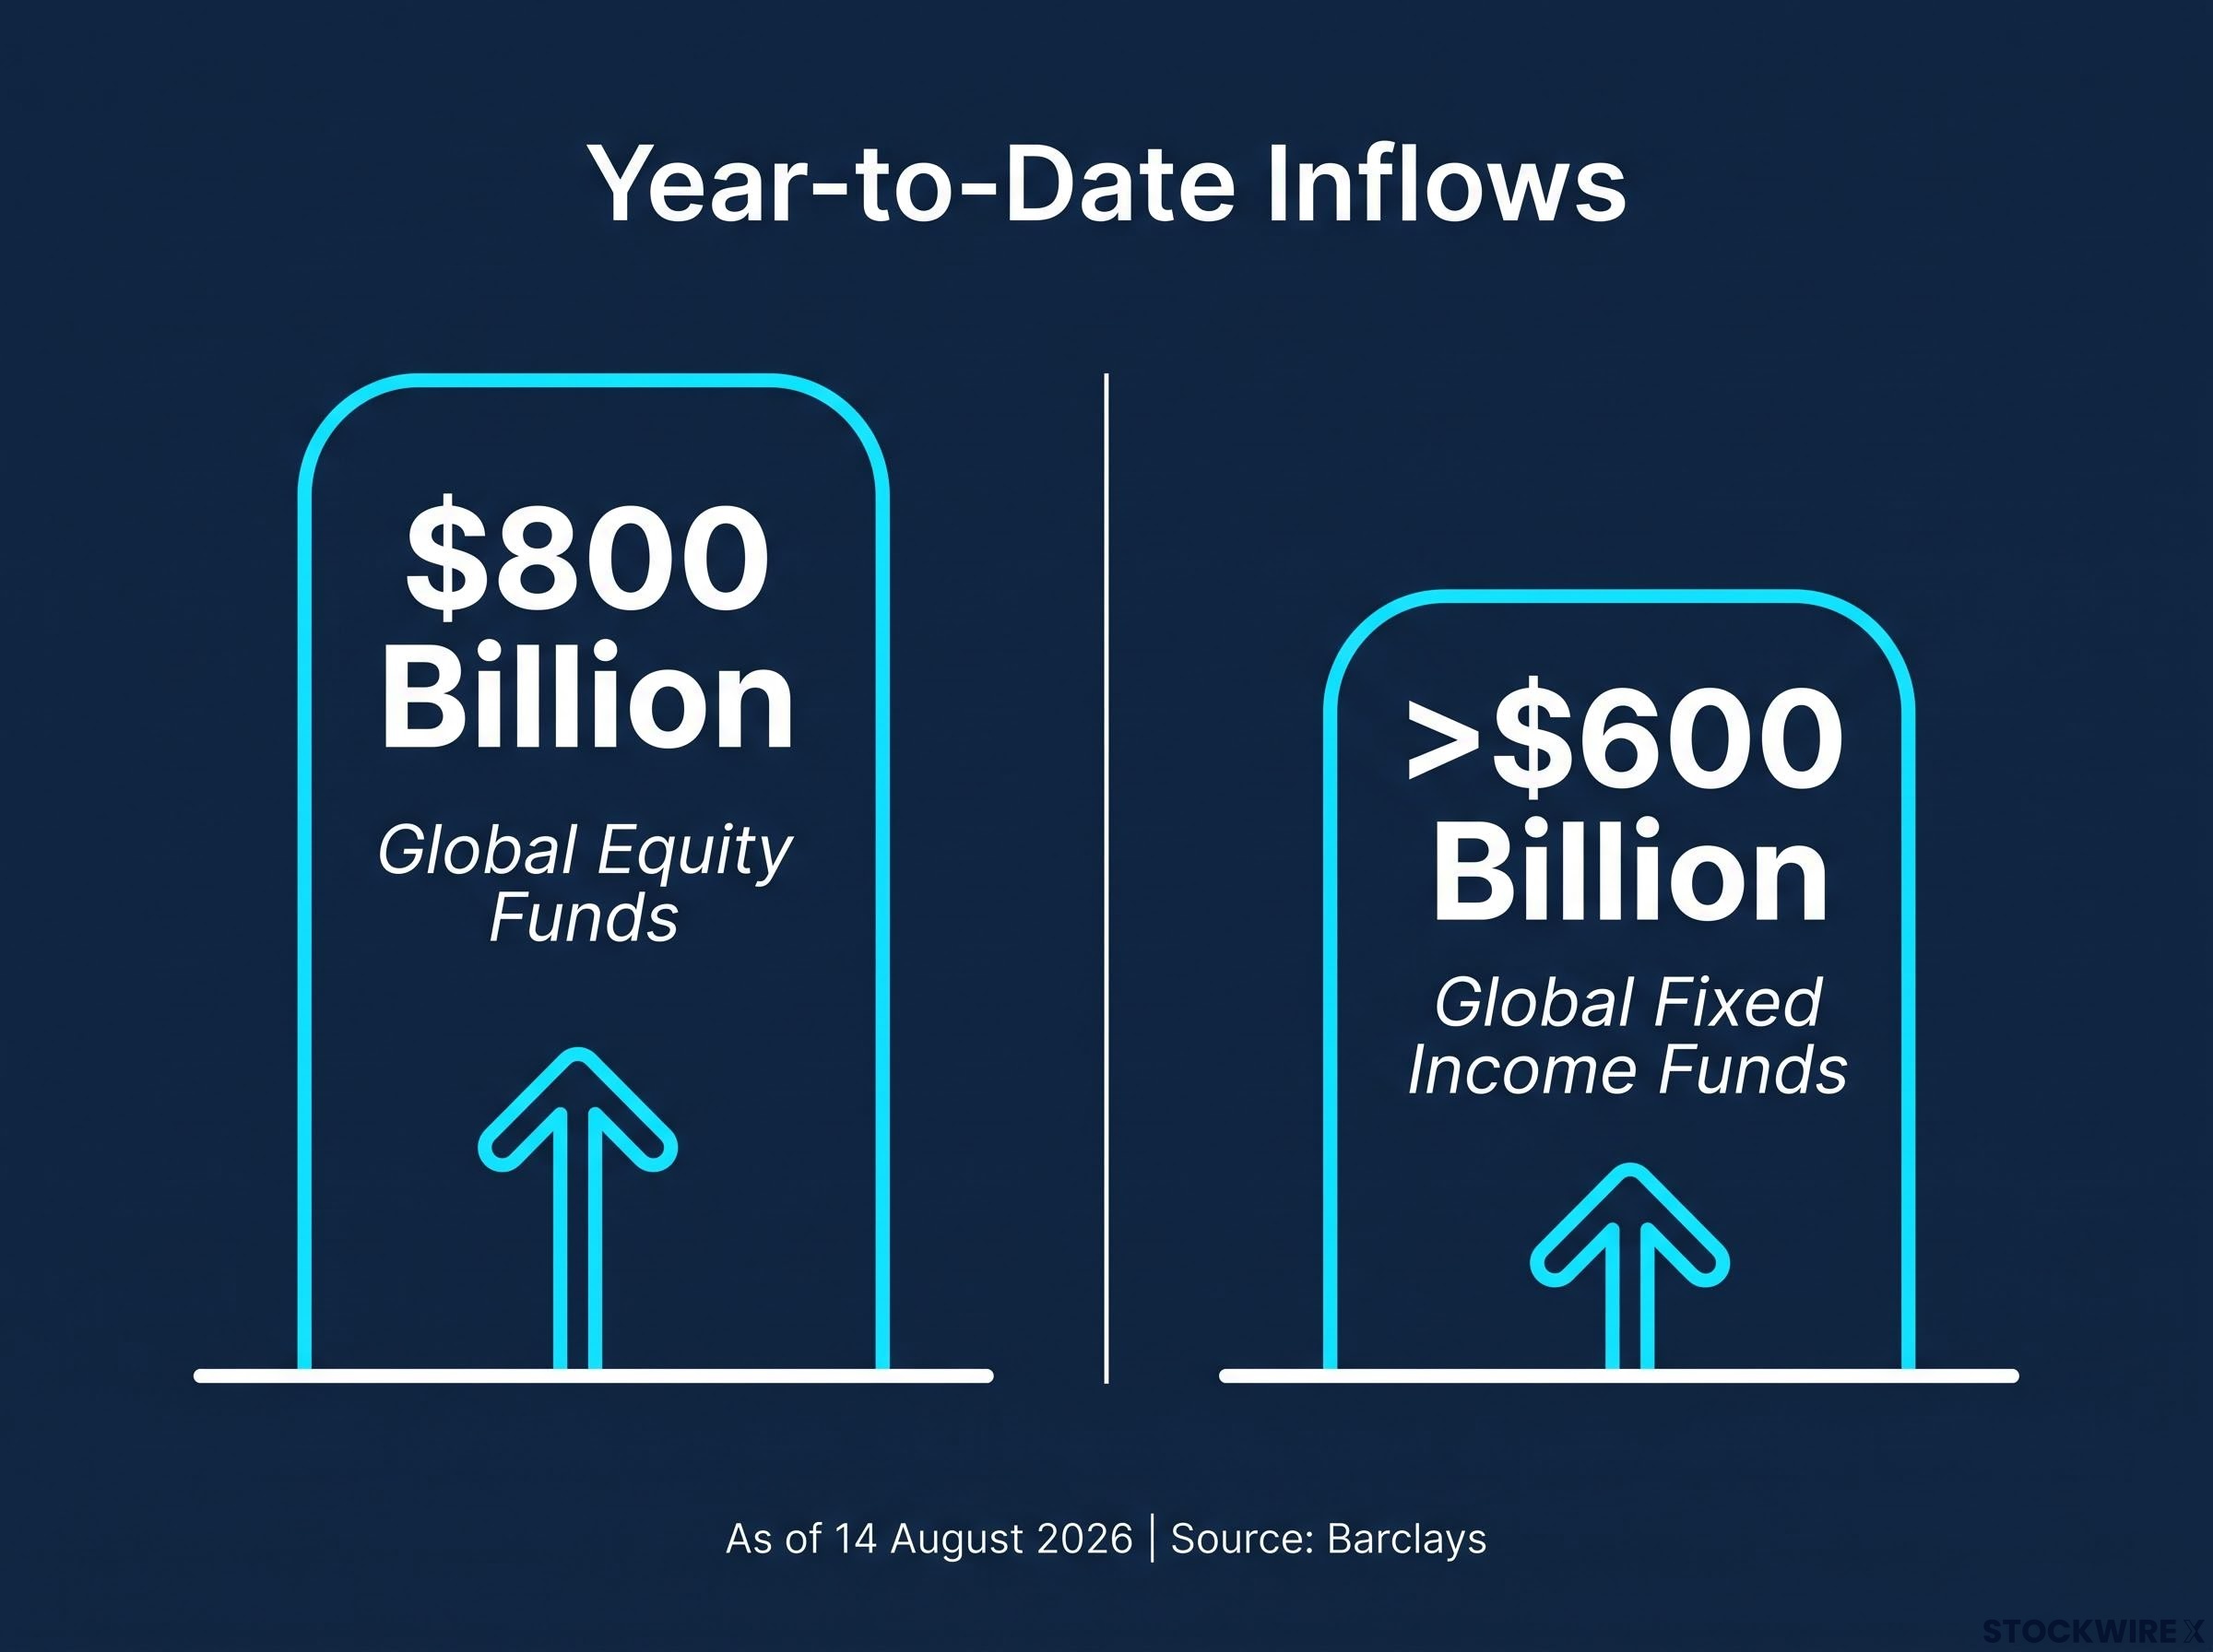
Nearly $800 billion has flowed into global equity funds since January, and the year still has four months to run. That figure, drawn from a Barclays research note dated 14 August 2026, is not a projection or a modelled estimate. It is money that has already moved.
What makes the number harder to dismiss as simple euphoria is what is happening alongside it. Bond funds globally have taken in well over $600 billion across the same timeframe. Investors are not dumping bonds to buy stocks. They are buying both, simultaneously, at a pace that has no clean precedent in modern fund flow records.
Here is the framework for reading what that dual signal actually means: how to interpret fund flow data as a sentiment tool, what macro conditions are sustaining these flows, where the capital is landing geographically, and how to build a personal watch-list for the variables that will determine whether 2026 finishes as a record year or reverses sharply.
The numbers behind a potential record year for equity flows
Start with the headline figure. As of the week ending approximately 14 August 2026, Barclays counted a sixth straight week of net inflows into equity funds globally, with cumulative year-to-date flows reaching approximately $800 billion. Reuters, drawing on a broader dataset, counts twelve consecutive weeks of inflows. The gap is methodological, not contradictory: Barclays tracks a specific fund universe, while Reuters captures a wider sample. Both point in the same direction.
Barclays described the pace of inflows as “on track for a record annual total” in its 14 August 2026 research note.
Separately, ETF-level data adds further context. ETFGI reported that year-to-date ETF inflows across all asset classes reached a reported $1.33 trillion by June 2026, with approximately $542 billion attributed to equity ETFs (both figures are unverified beyond ETFGI reporting and should be treated as directional rather than confirmed).
| Asset Class | YTD Inflow | Source | Verification Status |
|---|---|---|---|
| Global equity funds | ~$800 billion | Barclays | Confirmed |
| Global fixed income funds | >$600 billion | Barclays | Confirmed |
| Equity ETFs (to June) | ~$542 billion | ETFGI | Unverified |
| All ETFs (to June) | $1.33 trillion | ETFGI | Unverified |
The sheer simultaneity of equity and fixed income inflows at this scale is the analytical signal that matters most. This is not a rotation trade, where one asset class drains to feed another. It is a broad deployment of capital that was sitting in cash and ultra-short instruments. That distinction changes how you interpret the momentum behind both markets.
When big ASX news breaks, our subscribers know first
What fund flow data actually tells you about market sentiment
Fund flow data is one of the most widely cited and most frequently misread indicators in financial markets. Understanding what it can and cannot do separates a useful signal from a misleading one.
Where flows are useful
Sustained net inflows into equity funds indicate something specific: capital previously held in cash, money market funds, or short-duration instruments is being actively redeployed into risk assets. That is a direct behavioural signal. It tells you what a broad population of investors, both institutional and retail, is actually doing with their money rather than what they are saying in surveys or interviews.
Fund flows serve three distinct purposes as a sentiment tool:
- Confirming broad directional sentiment: Persistent inflows confirm that risk appetite is expanding, not contracting. The current dual-flow dynamic (equities plus bonds simultaneously) confirms that this expansion is broad, not narrow.
- Monitoring sector-level positioning shifts: Flows into or out of specific segments, such as technology, consumer staples, or precious-metal-related funds, reveal where investors are adding or trimming conviction.
- Detecting early reversal signals: Decelerating inflows, sudden sector-specific outflows, or a visible return to cash accumulation are early-warning patterns worth monitoring before they appear in price.
The primary institutional services tracking these flows, including EPFR, Bank of America, and LSEG Lipper, publish weekly data with a short lag.
Where flows mislead
Fund flows confirm the direction of sentiment, but they typically lag prices and cannot reliably predict inflection points. By the time inflows are running at record pace, prices have usually already moved significantly. Using flows as a timing tool, buying because inflows are strong, is working with a rearview mirror.
There is also a crowding risk. Technology and momentum segments illustrate this clearly: heavy inflows in prior periods built up concentrated positioning that then amplified a steep decline over two months. Strong flows are not a safety signal; they can be the precondition for a sharp reversal.
Earlier in the 2026 cycle, contrarian sell signals generated by the Bank of America Bull and Bear Indicator reached 8.0 during a single-week technology surge in May, a reminder that record inflows into specific segments have historically preceded short-term consolidation rather than sustained breakouts.
The practical shift this should create in how you use market news: instead of asking “should I buy now because flows are strong,” the better question is “what would a reversal in flows look like, and am I positioned to notice it?”
The macro backdrop: why a Fed pause is the engine underneath these flows
The flow data does not exist in a vacuum. Beneath the numbers sits a specific, identifiable macro signal that is driving the deployment: a Federal Reserve that appears content to pause.
Two recent U.S. data prints anchored the pause narrative. Payrolls came in below expectations, pointing to a labour market that is losing momentum, while CPI and PPI figures indicated that price pressures have stopped building. Taken together, these releases reduced the case for the Fed to act further and locked in market expectations of an extended pause as of August 2026.
The Fed pause narrative is not a settled consensus: when the FOMC held at 3.50%-3.75% on 17 June 2026, the dot plot split exactly nine to nine between officials favouring further hikes and those favouring no change or a cut, revealing a committee that is unified on the current rate but divided on every subsequent decision.
Barclays identifies two transmission channels flowing from this pause:
- Lower or stable Treasury yields: As rate-hike odds fall, yields stabilise or drift lower. That reduces the relative appeal of cash and very short-duration bonds, making equities and longer-duration fixed income more attractive by comparison.
- A softer or capped U.S. dollar: Diminished rate-hike expectations relieve upward pressure on the dollar. A weaker dollar boosts USD-denominated returns from foreign assets and eases stress on emerging markets carrying dollar-denominated debt.
- Anchored rate expectations: With the market pricing no further hikes, the uncertainty premium that had weighed on both equity valuations and bond duration unwinds.
- Improved relative equity attractiveness: The opportunity cost of holding cash compresses as short-term rates stabilise, pushing capital toward equities.
- Duration extension: Lower expected rates make longer-dated bonds more appealing, explaining the simultaneous fixed income inflows.
Barclays expects capped Treasury yields to help stabilise momentum and technology equity segments following their steep two-month decline.
Historical easing and pause cycles have often been followed by double-digit equity gains globally across U.S., European, Japanese, and emerging markets. However, episode-to-episode variation is high and outcomes are not guaranteed. Past performance is not a contract for the future.
For the reader, the Fed pause is not a macro footnote. It is the single most consequential variable in the current flow story. Any shift from pause to renewed tightening, or even to outright easing, would reprice the entire thesis driving these inflows. Understanding that dependency is the difference between a position and a bet.
Where the money is going: a rotation toward international markets
The aggregate inflow figure tells you capital is moving. The geographic breakdown tells you where, and the answer may surprise investors whose portfolios are concentrated in U.S. equities.
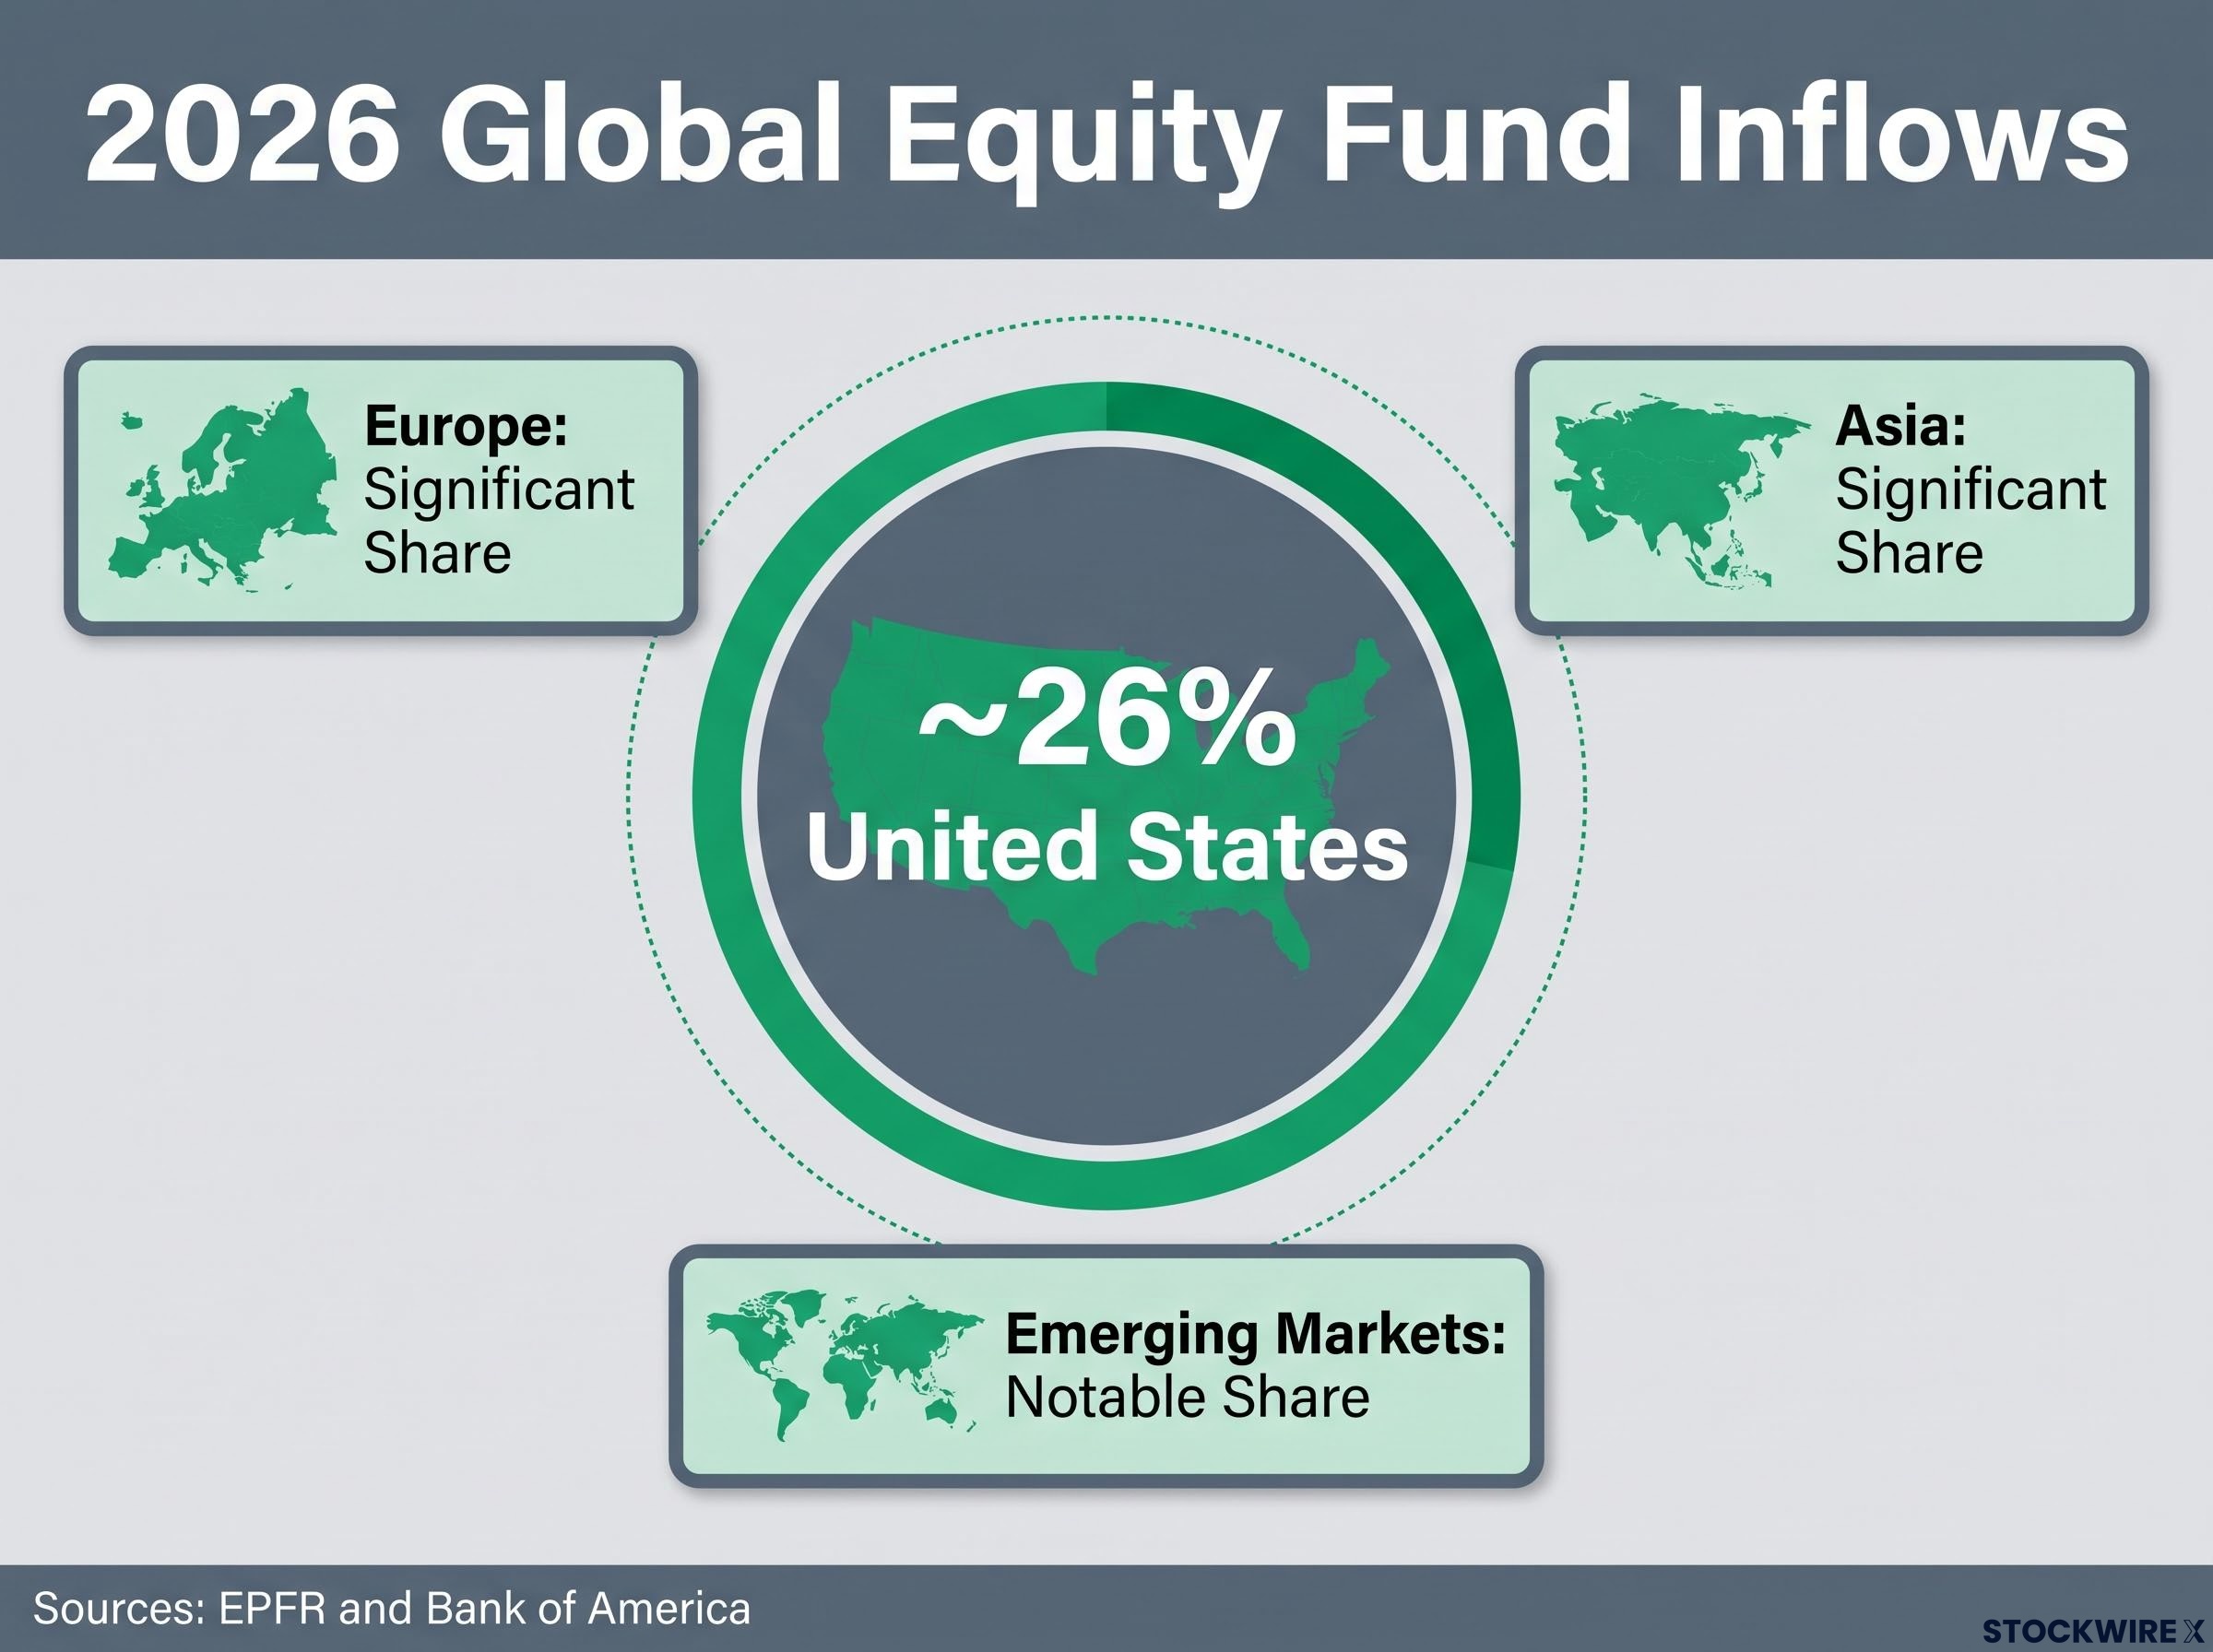
Analysis using EPFR and Bank of America data indicates that only approximately 26% of 2026 global equity fund inflows have gone into U.S. stocks (this figure is unverified beyond those sources but directionally notable). The majority has been directed toward Europe, Asia, and emerging markets.
The selective nature of that emerging market positioning is supported by recent flow data: emerging market fund flows in July 2026 showed a notable return of foreign investors to the asset class after a period of sustained outflows, with Asia recording the most significant improvements.
| Region | Approximate Share of Inflows | Directional Trend |
|---|---|---|
| United States | ~26% | Moderate, below historical share |
| Europe | Significant share | Increasing |
| Asia (developed) | Significant share | Increasing |
| Emerging markets | Notable share | Selective, supported by softer dollar |
That geographic distribution reframes the narrative. This is not a story of American investors buying American stocks. It is a genuinely global capital reallocation, and the softer dollar, discussed in the previous section, is part of what is making non-U.S. assets more attractive in dollar terms.
European structural headwinds, including sluggish eurozone growth, elevated energy costs, and an ECB holding rates with no near-term stimulus catalyst, sit beneath the headline inflow figures for the region, which means the aggregate European share of global flows in 2026 masks significant variation in sector-level and country-level conviction.
At the sector level, the positioning is more nuanced than the headlines suggest:
- Segments seeing trimming or outflows: Technology and momentum funds have experienced drawdowns and, in some weeks, net outflows even as broad equity inflows persisted.
- Segments seeing additions: Consumer staples and precious-metal-related funds have attracted inflows in select weeks, suggesting pockets of defensive positioning within the broader risk-on trend.
If your portfolio is concentrated in U.S. equities, the geographic distribution of these flows is a direct audit question. Your allocation may be structurally misaligned with where global capital is actually moving in 2026. That does not mean you should sell everything and buy European funds tomorrow. It means the flow data is telling you something about where the marginal dollar of conviction is being deployed, and it is worth checking whether your positioning reflects or ignores that signal.
The fixed income signal that most equity investors are missing
Most investors follow the equity flow headlines and treat bond flows as background noise. In this cycle, that is a mistake. The bond signal may be the more diagnostic one.
More than $600 billion flowing into fixed income funds at the same time as $800 billion flowing into equities is not a rotation signal. In a standard risk-on environment, bonds typically lose flows as capital moves into stocks. What is happening in 2026 is something different: a dual-deployment pattern where money is extending into both asset classes simultaneously.
The simultaneous accumulation of large inflows into both equities and fixed income funds is a dual-deployment signal, not a rotation signal. Capital that was parked in cash and ultra-short instruments is extending duration and adding equity at the same time.
What this tells you about the source of capital is specific. Money that was sitting in ultra-short instruments and cash equivalents is now extending duration and adding equity exposure together. The implication: the opportunity cost of staying short has become too high for a broad cross-section of investors. Institutional allocators and retail investors alike are concluding that the yields available on cash will compress further if the Fed pauses, and that waiting carries its own risk.
What dual inflows mean for investors in cash and short-duration instruments
If you are currently sitting in cash or very short-duration instruments, the institutional capital extending duration right now is sending you a signal. The window for locking in yields while equities still have upside may not stay open indefinitely. That does not mean you should chase. It means the pressure you are feeling, yields compressing while equity markets climb, is structural, not temporary.
A laddered or barbell approach, combining intermediate or long-duration bonds with equities, is one structurally sound response to this environment. It allows you to capture yield on the fixed income side while maintaining equity exposure, without concentrating your entire portfolio into a single risk profile.
This is for informational purposes only and should not be considered financial advice. Investors should conduct their own research and consult with financial professionals before making investment decisions.
Four variables that will determine whether 2026 finishes as a record year
The current flow environment is a conditional record. It holds if the following variables remain supportive; it breaks if any of them shift materially. Rather than abstract macro risks, these are observable, trackable data points you can monitor in the weeks and months ahead:
- Fed communications: Any shift from pause to renewed tightening or outright easing reprices the entire thesis. Watch the language in FOMC statements and press conferences for changes in tone around inflation persistence or labour market slack.
- U.S. inflation and labour data: CPI, PPI, and monthly payrolls are the two direct inputs into rate expectations and Treasury yields. These releases are the earliest hard data that could confirm or undermine the pause narrative.
- Corporate earnings resilience: Earnings must hold up against a softer macro backdrop to justify continued equity inflows at this pace. Watch for margin compression and forward guidance revisions in upcoming quarterly reports.
- Weekly and monthly flow data itself: Decelerating inflows, sector-specific outflows, or a visible return to cash accumulation are the earliest observable signals of a sentiment shift. Services like EPFR and LSEG Lipper publish these weekly.
The portfolio type most exposed to a reversal is one concentrated in recent momentum and technology winners, where strong prior inflows created positioning that amplifies both upside and downside once flows turn.
Foreign ownership of U.S. equities reached approximately $16.9 trillion as of mid-2024, and the amplifier risk embedded in that position is now structurally larger than at any prior point in the cycle: the composition of foreign portfolios has flipped from 23% equities in 2009 to 55% equities today, meaning any sentiment shift hits prices faster and harder than historical analogues would suggest.
This is your personal surveillance checklist. The ability to define in advance what would change your view is what distinguishes a considered investment position from a trend-following one. If these four variables hold, the record-year thesis remains intact. If any of them break, you will see it in the data before you see it in the headlines.
Past performance does not guarantee future results. Financial projections are subject to market conditions and various risk factors.
Positioned for the record, or just along for the ride?
The 2026 inflow surge is real, globally distributed, and macro-supported. Nearly $800 billion in equity flows and more than $600 billion in fixed income flows are not noise. They represent a broad, measurable deployment of capital out of cash and into risk, underpinned by a Fed pause that has reduced the opportunity cost of being invested.
But the record is conditional, not guaranteed. The same macro architecture that is sustaining these flows, capped yields, a softer dollar, moderating inflation, can shift if any of the four variables above moves against the thesis. The investor who understands the flow signal and holds a deliberately calibrated, geographically diversified position is in a fundamentally different situation from the investor who is simply riding momentum without a framework for knowing when to reassess.
The data is public. The watch-list is specific. Whether 2026 finishes as a record year is something you can monitor in real time, not something you need to wait for someone else to tell you.