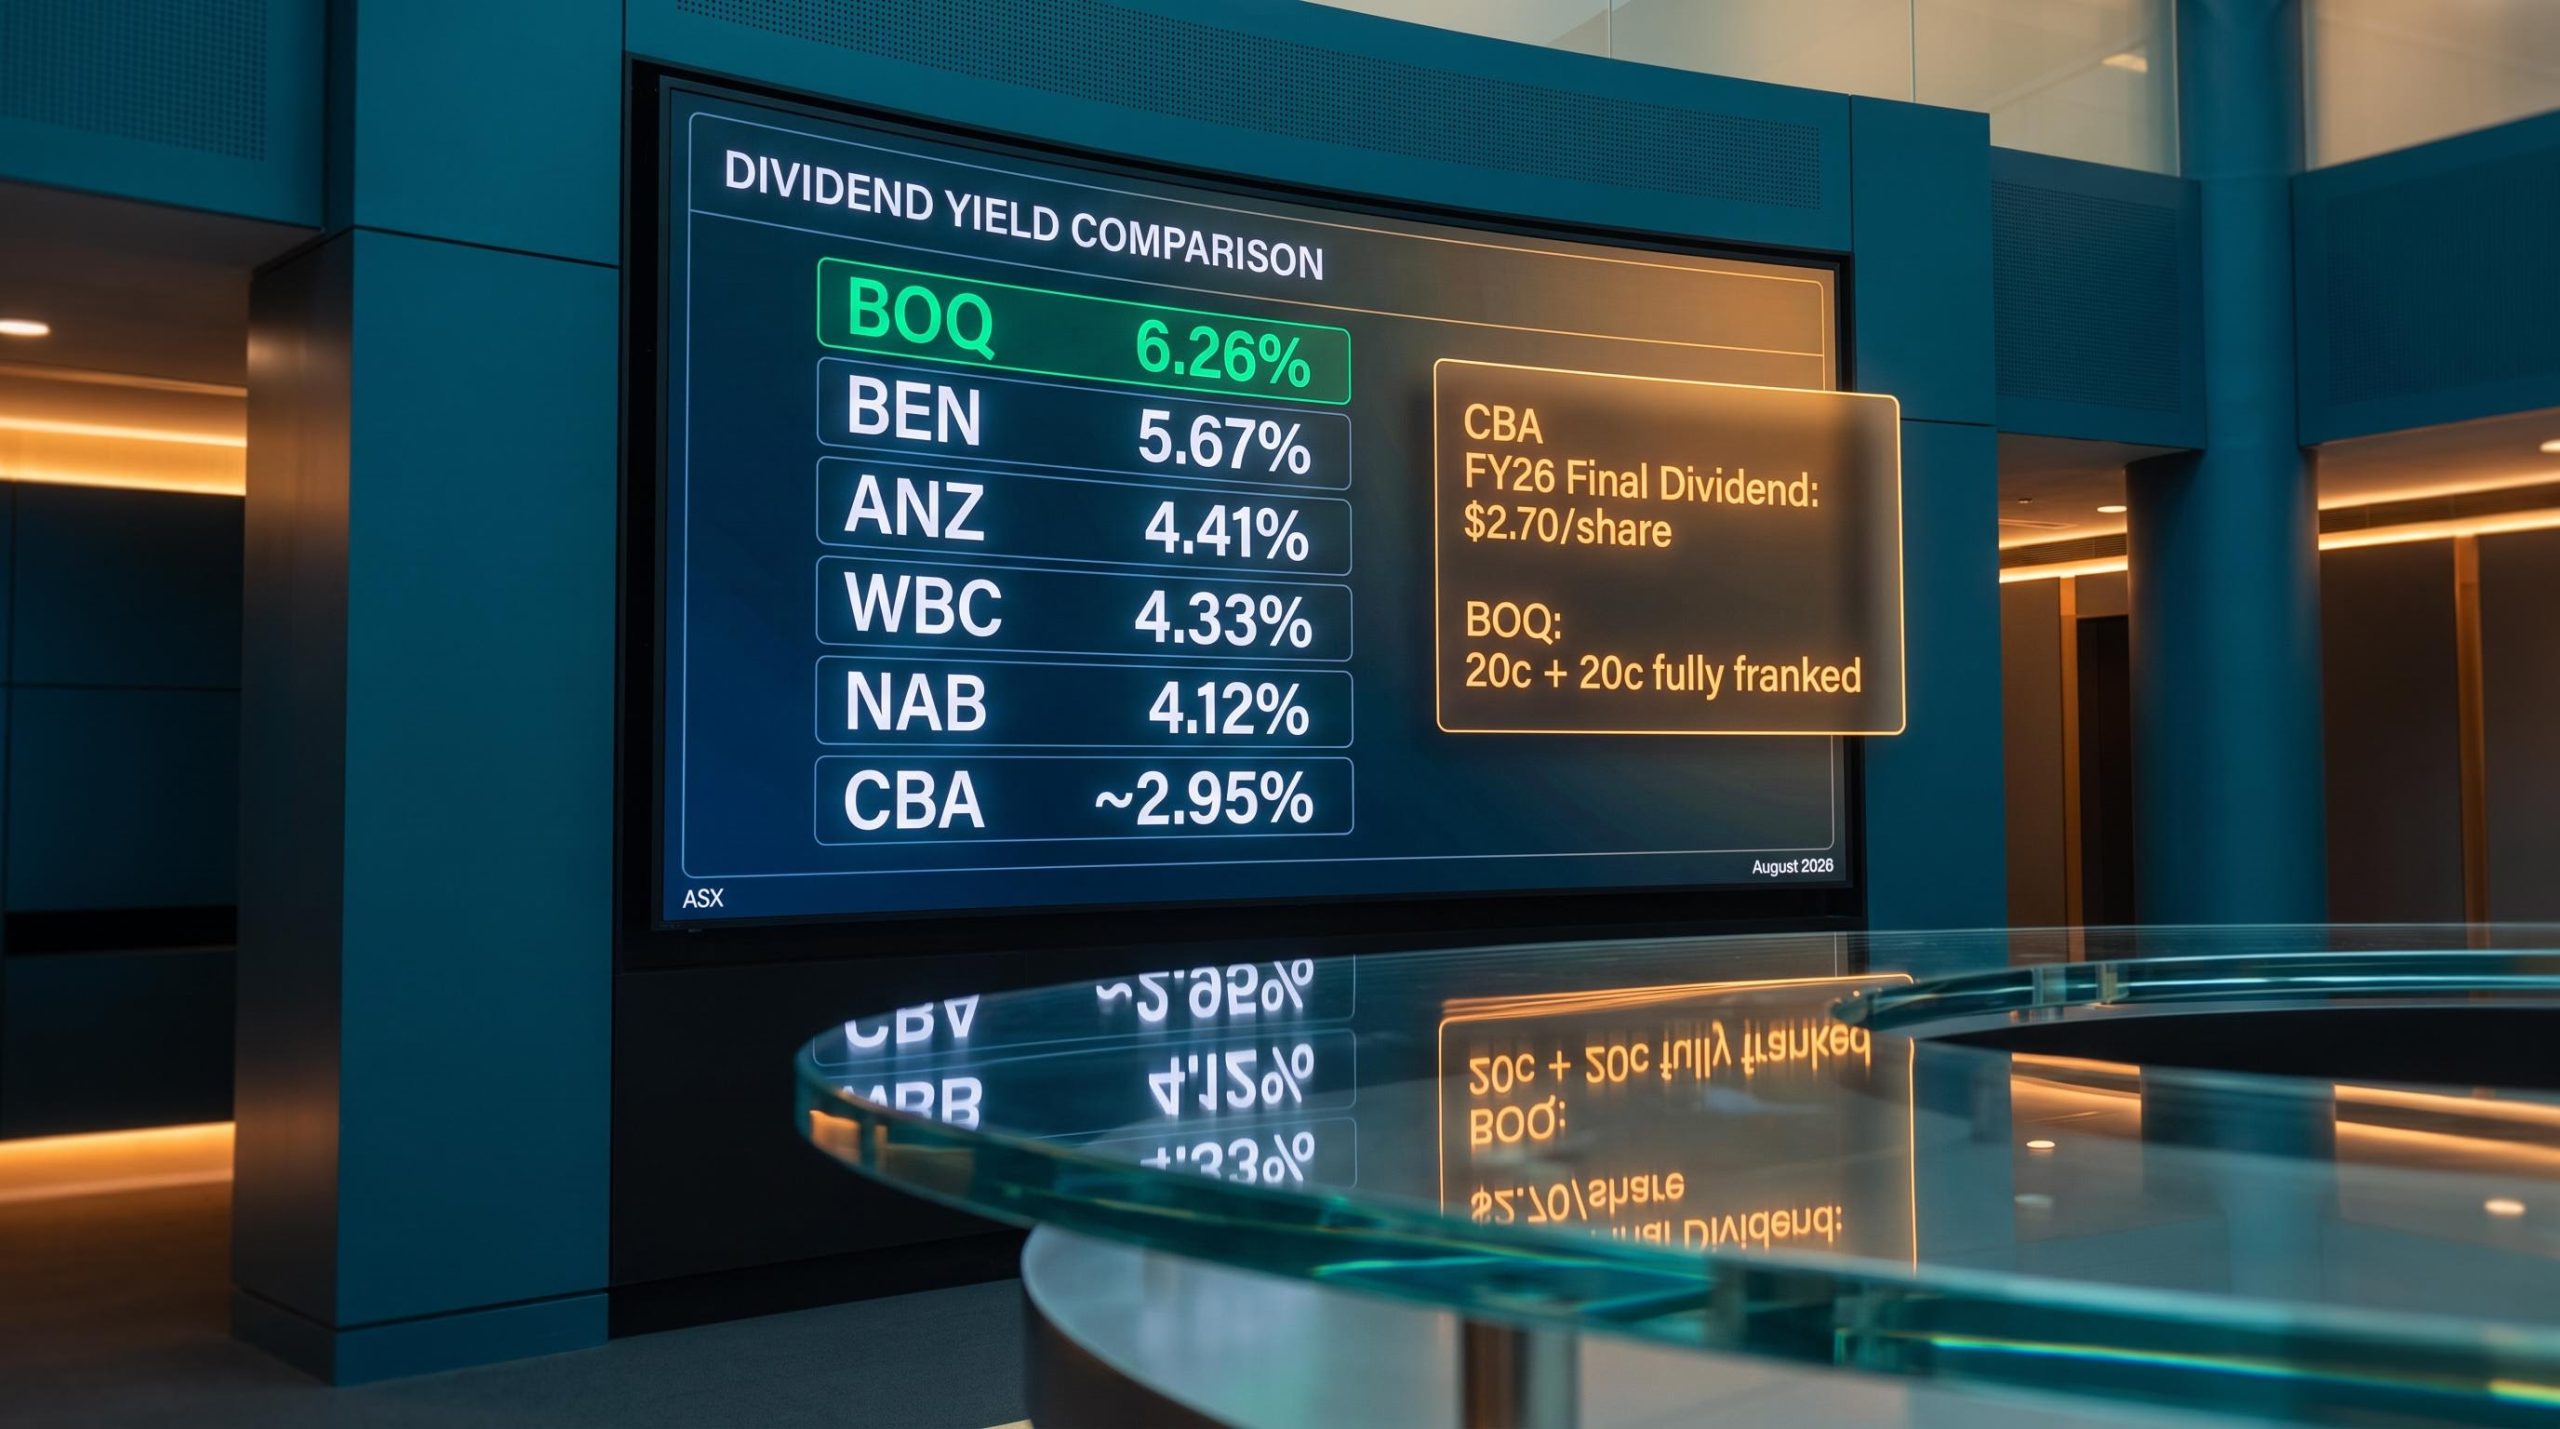
A 6.26% trailing dividend yield and a 2.95% trailing dividend yield sit inside the same sector, on the same exchange, right now. Both are ASX-listed banks. Both pay dividends twice a year. They are not interchangeable, and the gap between them is not a simple invitation to reach for the higher number.
August 2026 is an unusually well-evidenced moment to compare ASX bank dividend yields. CBA has just declared its FY26 final dividend, the earnings season is delivering fresh, verified figures across all six institutions, and the data is current rather than stale. That convergence makes this the right time to benchmark properly.
Here is the framework for understanding which tier of bank dividend each stock belongs to, why franking changes the real-money comparison, and what kind of investor each yield actually suits. The goal is a practical filter you can apply to your own income strategy, not a generic sector overview.
The current yield spread across ASX bank stocks
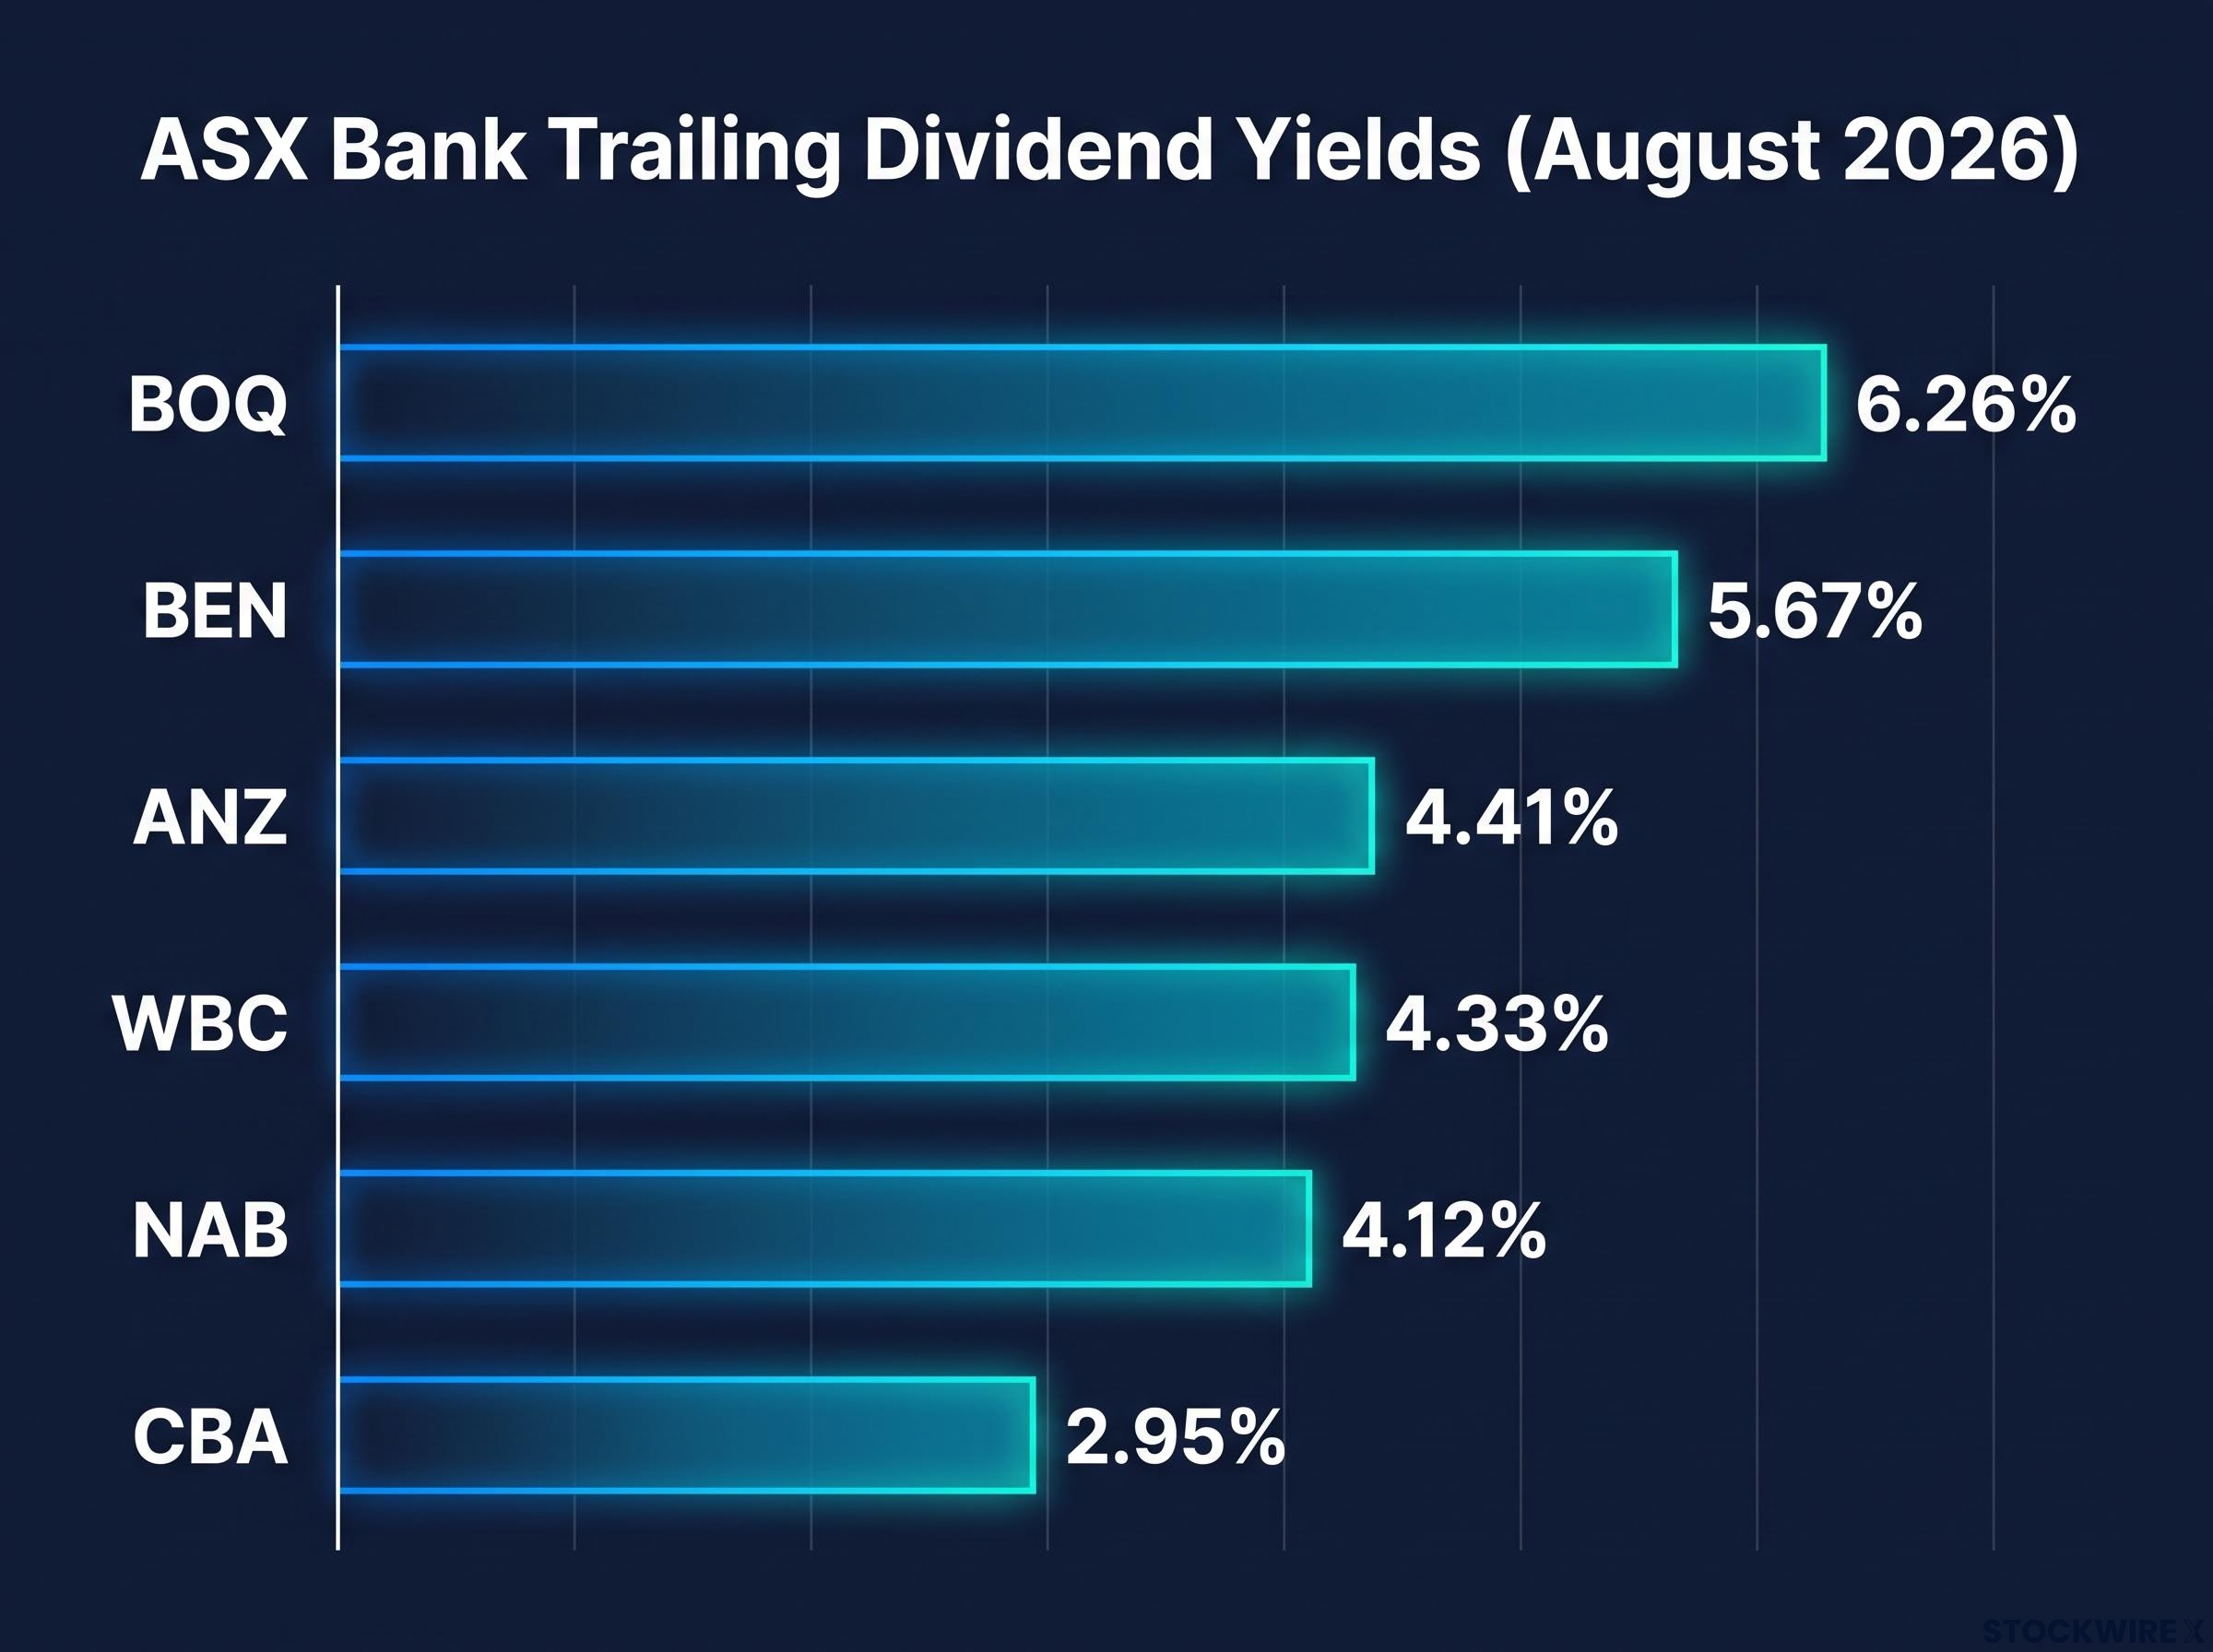
The spread across ASX bank dividends is wider than most investors assume. At the top, BOQ sits at 6.26%. At the bottom, CBA sits at approximately 2.95%. That is more than three percentage points of difference inside a single sector.
BOQ’s 6.26% trailing yield puts it ahead of every other ASX-listed bank stock on dividend yield as of August 2026.
Between those extremes, four banks fill the middle ground: ANZ at 4.41%, Westpac at 4.33%, NAB at 4.12%, and Bendigo and Adelaide Bank at 5.67%. Every regional bank in this group yields more than every major. That pattern is consistent and structural, not coincidental.
| Bank | Most recent dividends | Franking | Trailing yield (Aug 2026) |
|---|---|---|---|
| CBA | $2.70/share final (FY26) | 100% | ~2.95% |
| NAB | 85c interim (Jul 2026); $1.70 total over 12 months | 100% | 4.12% |
| WBC | 77c interim (Jun 2026) + 77c final (Dec 2025) | 100% | 4.33% |
| ANZ | 83c interim (Jul 2026, 75%) + 83c final (Dec 2025, 70%) | 70-75% | 4.41% |
| BEN | 33c + 30c (both fully franked) | 100% | 5.67% |
| BOQ | 20c + 20c (both fully franked) | 100% | 6.26% |
The three-percentage-point gap between CBA and BOQ tells you something important: these are not comparable income instruments, even though both are ASX-listed bank stocks. The size of that gap is a signal about what you are accepting at each end. Yield ranking alone does not tell you which bank delivers the best income, and the rest of this analysis explains why.
When big ASX news breaks, our subscribers know first
Why franking changes the real comparison for Australian investors
Franking credits are tax credits attached to dividends. When an Australian company pays tax on its profits before distributing them as dividends, it can pass those tax credits to shareholders. A fully franked dividend means the company has already paid the full 30% corporate tax rate on the underlying profit, and the shareholder receives a credit for that amount. For investors on lower marginal tax rates, that credit reduces their tax bill. For self-managed super funds (SMSFs) in pension phase, which pay 0% tax, the full franking credit is refundable as cash from the Australian Taxation Office.
Franking credit calculations follow a straightforward formula: the cash dividend multiplied by 30, divided by 70, which reflects the 30% corporate tax already paid at the company level before the dividend reaches the shareholder.
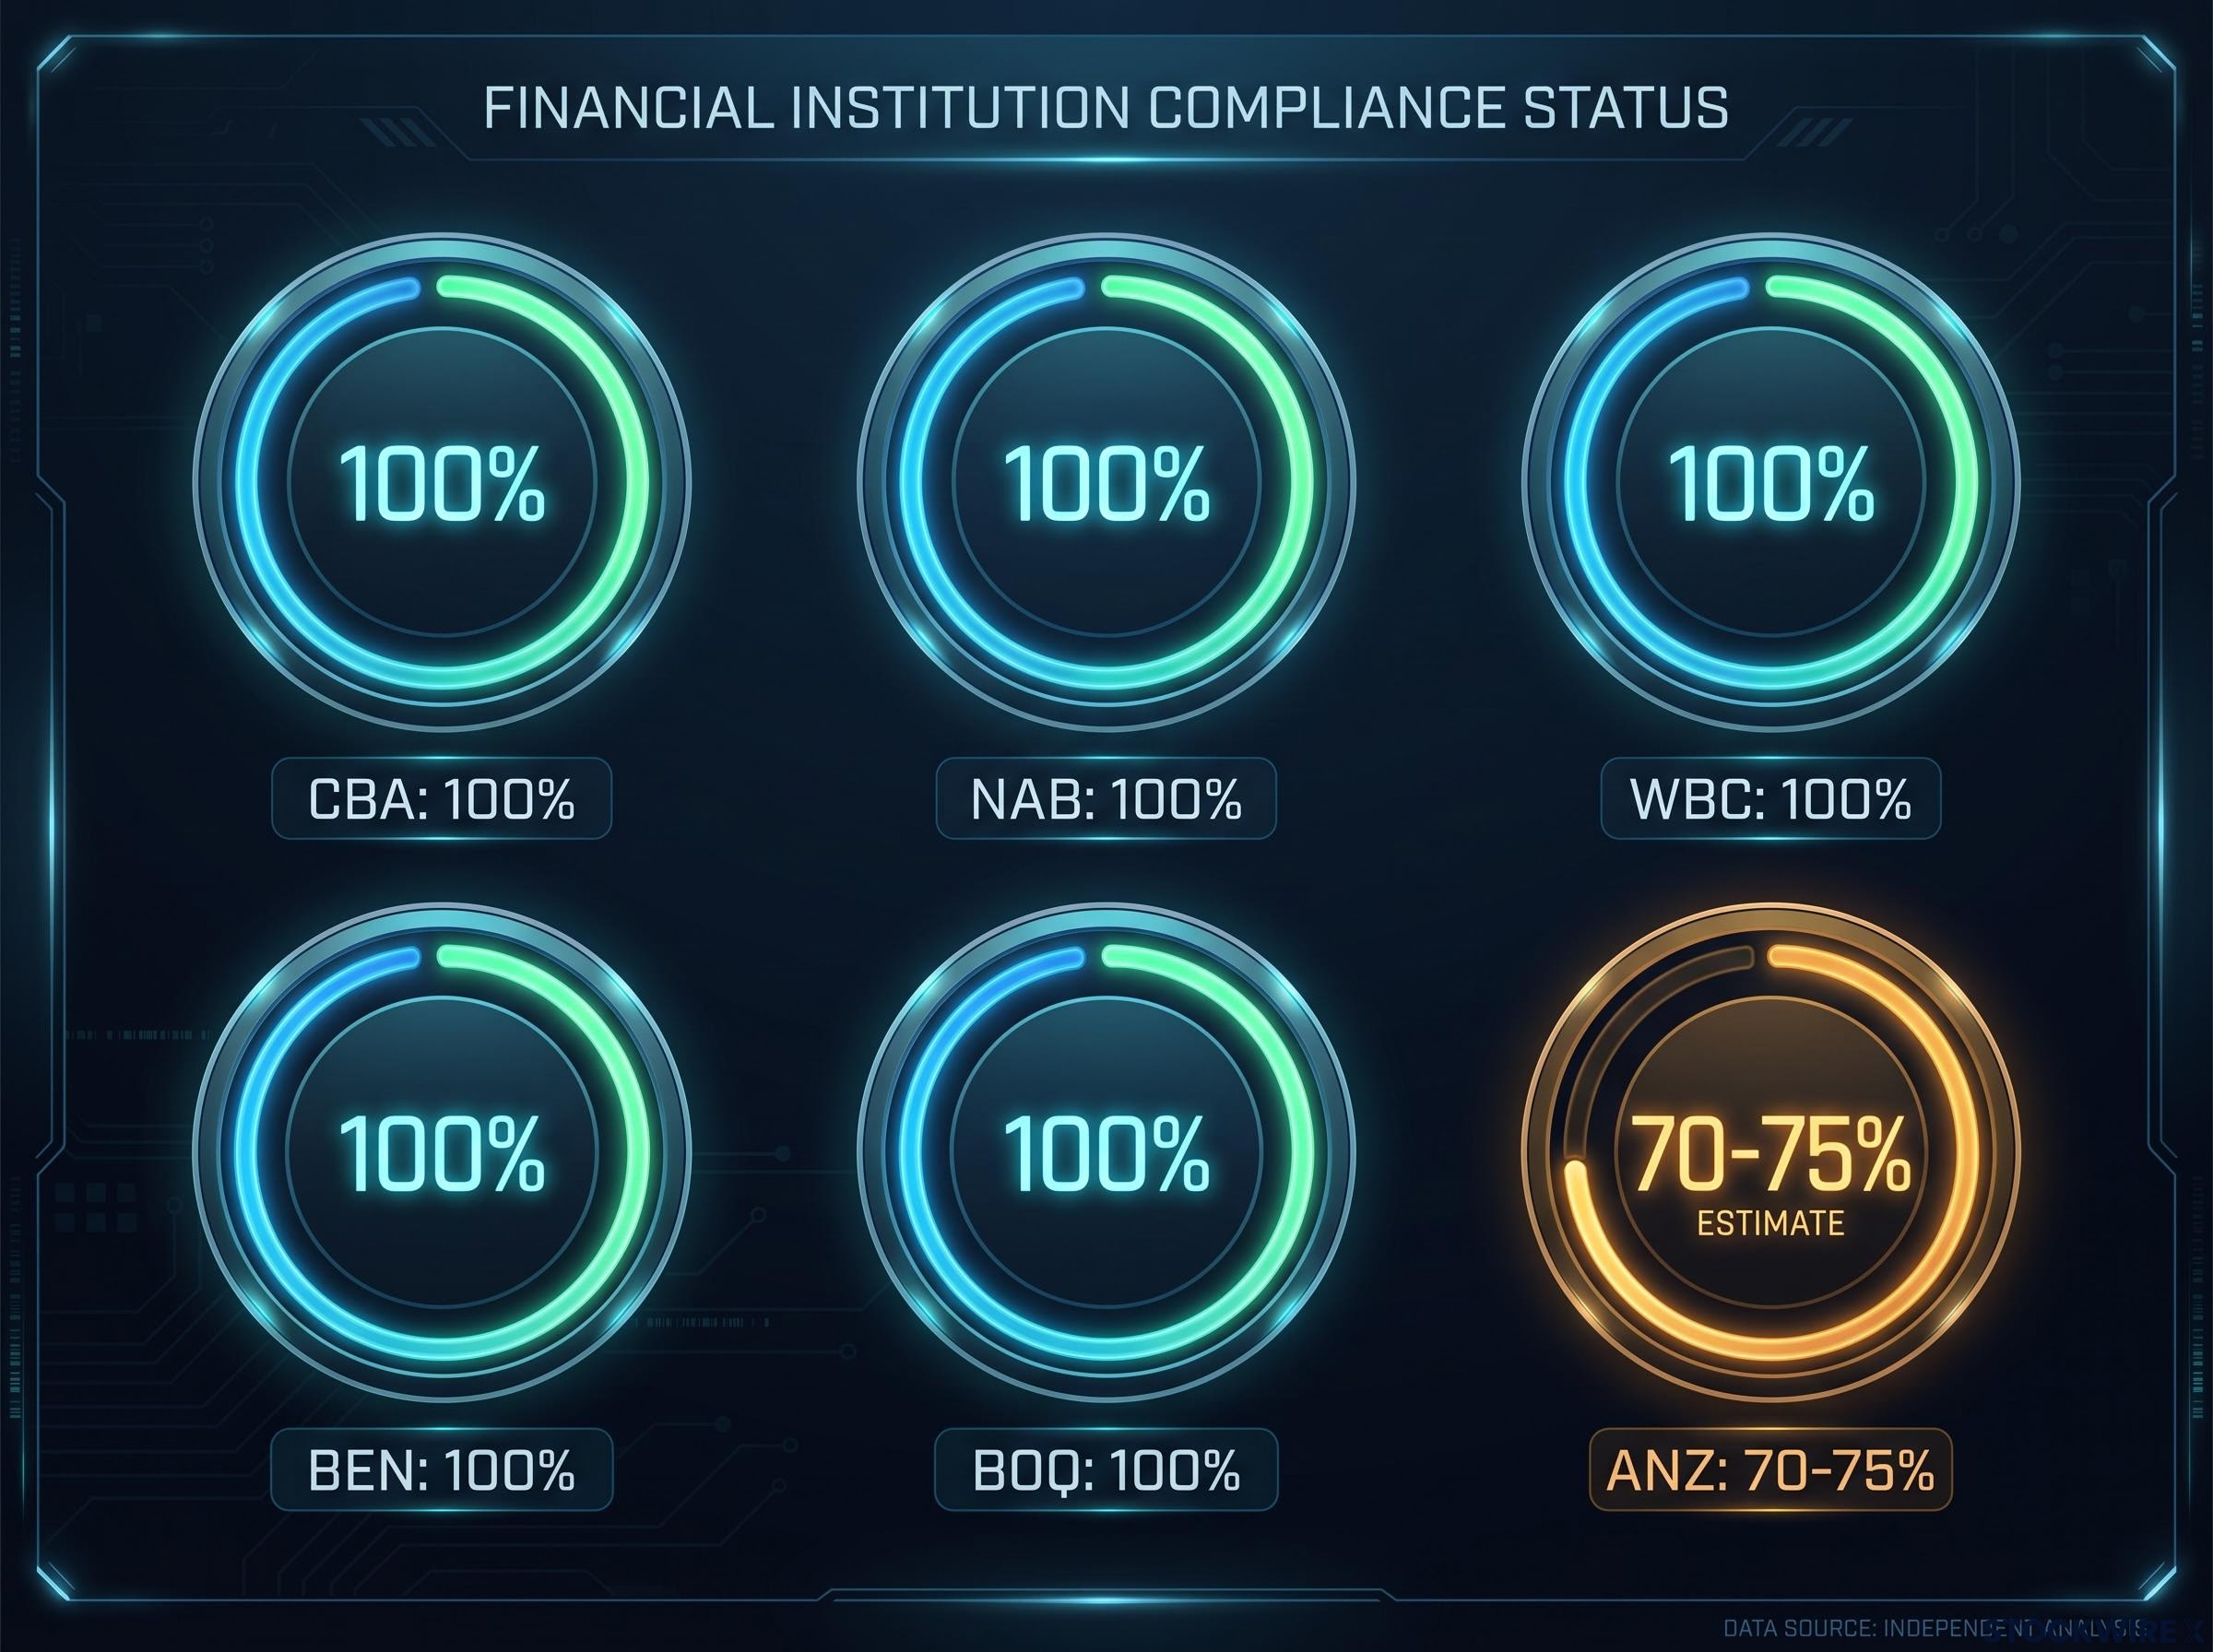
That refundability is where the comparison gets real. Five of the six banks in this analysis pay fully franked dividends. ANZ is the outlier.
- CBA: 100% franked
- NAB: 100% franked
- WBC: 100% franked
- BEN: 100% franked
- BOQ: 100% franked
- ANZ: 70-75% franked
What partial franking means in dollar terms
ANZ’s July 2026 interim dividend was 83 cents per share, franked at 75%. Its December 2025 final dividend was also 83 cents, franked at 70%. On a raw yield basis, ANZ sits at 4.41%, above NAB’s 4.12% and Westpac’s 4.33%. On a tax-adjusted basis, particularly for SMSF investors in pension phase who receive full franking credit refunds, that apparent advantage narrows materially.
The effective income gap between ANZ and its fully franked big-four peers is smaller than any raw yield table shows, and for investors who rely on franking credit refunds, the difference may be negligible.
For investors whose tax structure makes franking credits a direct income variable rather than merely a tax consideration, NAB and Westpac at full franking may deliver comparable or superior after-tax income to ANZ, despite sitting lower in a headline yield table.
Decoding the regional bank yield premium at BEN and BOQ
A high yield is not always a generous dividend. Sometimes it is a depressed share price doing the arithmetic. At both BEN and BOQ, the current yields reflect a mixture of both, and separating those components is the difference between an informed position and a yield trap.
Smaller regional banks structurally trade at higher yields than the majors because investors demand more compensation for concentrated business models, lower diversification, and less predictable earnings. That structural premium exists for a reason. The question is whether the current premium at BEN and BOQ is justified by income, or inflated by price weakness.
A rising yield that reflects a depressed share price rather than a growing payout is the classic dividend trap, and both BOQ and BEN display the conditions that precede one: prior distribution cuts, uneven payout histories, and elevated forecast variability.
Bendigo and Adelaide Bank (BEN)
- BEN’s trailing yield is 5.67%, with the two most recent dividends at 33 cents and 30 cents per share, both fully franked. The bank’s payout has stepped down from earlier levels, so the current yield partly reflects a smaller absolute dividend rather than a re-rating of the share price alone. Forecast yields for 2026 range from approximately 5.2% to 6.1%, suggesting continued variability. BEN pays a meaningful income, but the payout track record signals that this level of income is not guaranteed to persist.
Bank of Queensland (BOQ)
- BOQ’s trailing yield of 6.26% is the highest in the group, but the two most recent dividends were just 20 cents per share each, both fully franked. BOQ’s per-share payments have been cut materially from historical norms, and the pattern of distributions has been uneven over time. Forecast yields for 2026 range from approximately 5.4% to 6.4%. The elevated yield is as much a function of a depressed share price as it is of current income. Reaching for BOQ’s 6.26% means accepting the same conditions, business-model vulnerability and prior dividend cuts, that produced that price depression.
Where NAB and Westpac sit in the income landscape
Neither NAB nor Westpac generates headlines on yield. That is precisely the point. Both banks occupy a middle ground that suits investors who want meaningfully more income than CBA delivers without the reliability risk embedded in the regional bank yields.
- NAB: Trailing yield of 4.12%, 85 cents interim dividend paid July 2026, $1.70 per share total over 12 months, fully franked. Large, diversified franchise with a more stable earnings base than the regionals.
- Westpac: Trailing yield of 4.33%, 77 cents interim paid June 2026 plus 77 cents final paid December 2025, totalling $1.54 per share annually, fully franked. Consistently attaches full franking credits and edges NAB slightly on yield.
Both banks offer fully franked dividends in the 4.1-4.3% range. Compare that to ANZ’s nominally higher 4.41% at partial franking, and the picture shifts.
On a franking-adjusted basis, NAB and Westpac may deliver more genuine income than ANZ for investors in tax-efficient structures, despite sitting lower in a raw yield table.
For investors running SMSFs in pension phase or any structure where franking credits convert directly to cash, the fully franked yields at NAB and Westpac represent a stronger real-income proposition than ANZ’s headline number suggests. That reframing changes how the middle of the big-four yield table should be read.
CBA’s yield in context: what 2.95% actually tells you
CBA’s yield looks thin against every peer in this analysis. It is also the most expensive income on the ASX, and investors keep paying for it.
At $2.70 per share, fully franked, the FY26 final dividend came in 4% ahead of the equivalent payment made in the prior year. Among the major banks, CBA led the reporting calendar this earnings season, opening proceedings before its peers, and it set the benchmark not by paying more than peers in percentage terms, but by demonstrating what its investors pay a premium for: consistent, growing dividends backed by the largest and most profitable bank franchise on the ASX.
CBA’s 4% year-on-year dividend growth reinforces the case that investors are paying for a trajectory, not just a current payment.
CBA’s compressed yield is structural. The market assigns a valuation premium to payout reliability and dividend growth, which mathematically depresses the yield ratio. Three characteristics underpin that premium:
- Payout reliability that sets the standard for the sector
- Fully franked status on every payment
- A dividend growth track record that compounds over time
The trailing yield of approximately 2.95%, with a forward yield estimated at roughly 3.01%, is not a concession. It reflects a market consensus that this institution’s income stream is a different product from what BOQ’s 6.26% offers. Investors choosing CBA are buying reliability and growth, not settling for less.
Investors wanting to translate CBA’s forward yield into a concrete income plan will find our deep-dive into CBA dividend forecasts and income targets, which calculates the exact shareholding required to generate $10,000 in annual dividends and models the SMSF franking credit uplift.
Matching the right bank dividend to your income strategy
The yield table is not a ranking of which stock to buy. It is a map of the risk-return trade-offs available in the sector right now. Where you sit on that map depends on what you are optimising for.
| Investor priority | Suitable banks | Yield range | Key trade-off |
|---|---|---|---|
| Maximum headline yield | BOQ, BEN | 5.2-6.4% | Higher dividend variability and business-model risk |
| Balanced yield and reliability | NAB, WBC | 4.1-4.6% | Moderate yield with large-franchise stability; fully franked |
| Quality and consistency | CBA | 2.95-3.2% | Lowest yield, highest payout reliability and growth |
ANZ sits nominally in the balanced tier on raw yield at 4.41%, but partial franking at 70-75% pulls it closer to NAB and Westpac on a tax-adjusted basis. For SMSF investors in pension phase, where franking credit recoverability is a direct income variable, ANZ’s apparent yield advantage may not survive the adjustment.
Before selecting based on yield alone, consider these filters:
- What is your tax structure, and does it maximise franking credit value?
- How dependent is your income on dividend consistency versus total return?
- Can you absorb a dividend cut without needing to sell the position?
- Are you comparing headline yields or after-tax, franking-adjusted income?
The forecast yield ranges at the high end, BOQ at 5.4-6.4% and BEN at 5.2-6.1%, underscore the variability that accompanies elevated yield. The spread is the price of reaching.
Which yield tier fits your income goals in August 2026
The August 2026 bank dividend landscape rewards investors who match yield selection to their risk tolerance and tax structure, not those who simply rank by headline percentage. With verified FY26 data now available from CBA and fresh interim figures from across the sector, this is a particularly well-evidenced moment to review positioning.
All six banks are paying dividends right now. The conditions attached to each payment differ materially. BOQ’s 6.26% carries the weight of prior cuts and business-model risk. CBA’s 2.95%, paired with 4% dividend growth year-on-year, signals sector-wide dividend health at the conservative end. The middle ground at NAB and Westpac offers franking-adjusted income that quietly competes with ANZ’s higher headline number.
Dividend announcements from the remaining major banks will continue through the reporting season, and this comparison will shift as each institution reports. The framework, however, stays the same: match the tier to your income priorities, and let the conditions, not the percentage, drive the decision.
For investors wanting to apply this bank dividend comparison to a broader income portfolio, our comprehensive walkthrough of ASX passive income structures covers how to combine direct shares, LICs, and income ETFs to build a resilient, franking-optimised income stream.
This article is for informational purposes only and should not be considered financial advice. Investors should conduct their own research and consult with financial professionals before making investment decisions. Past performance does not guarantee future results.