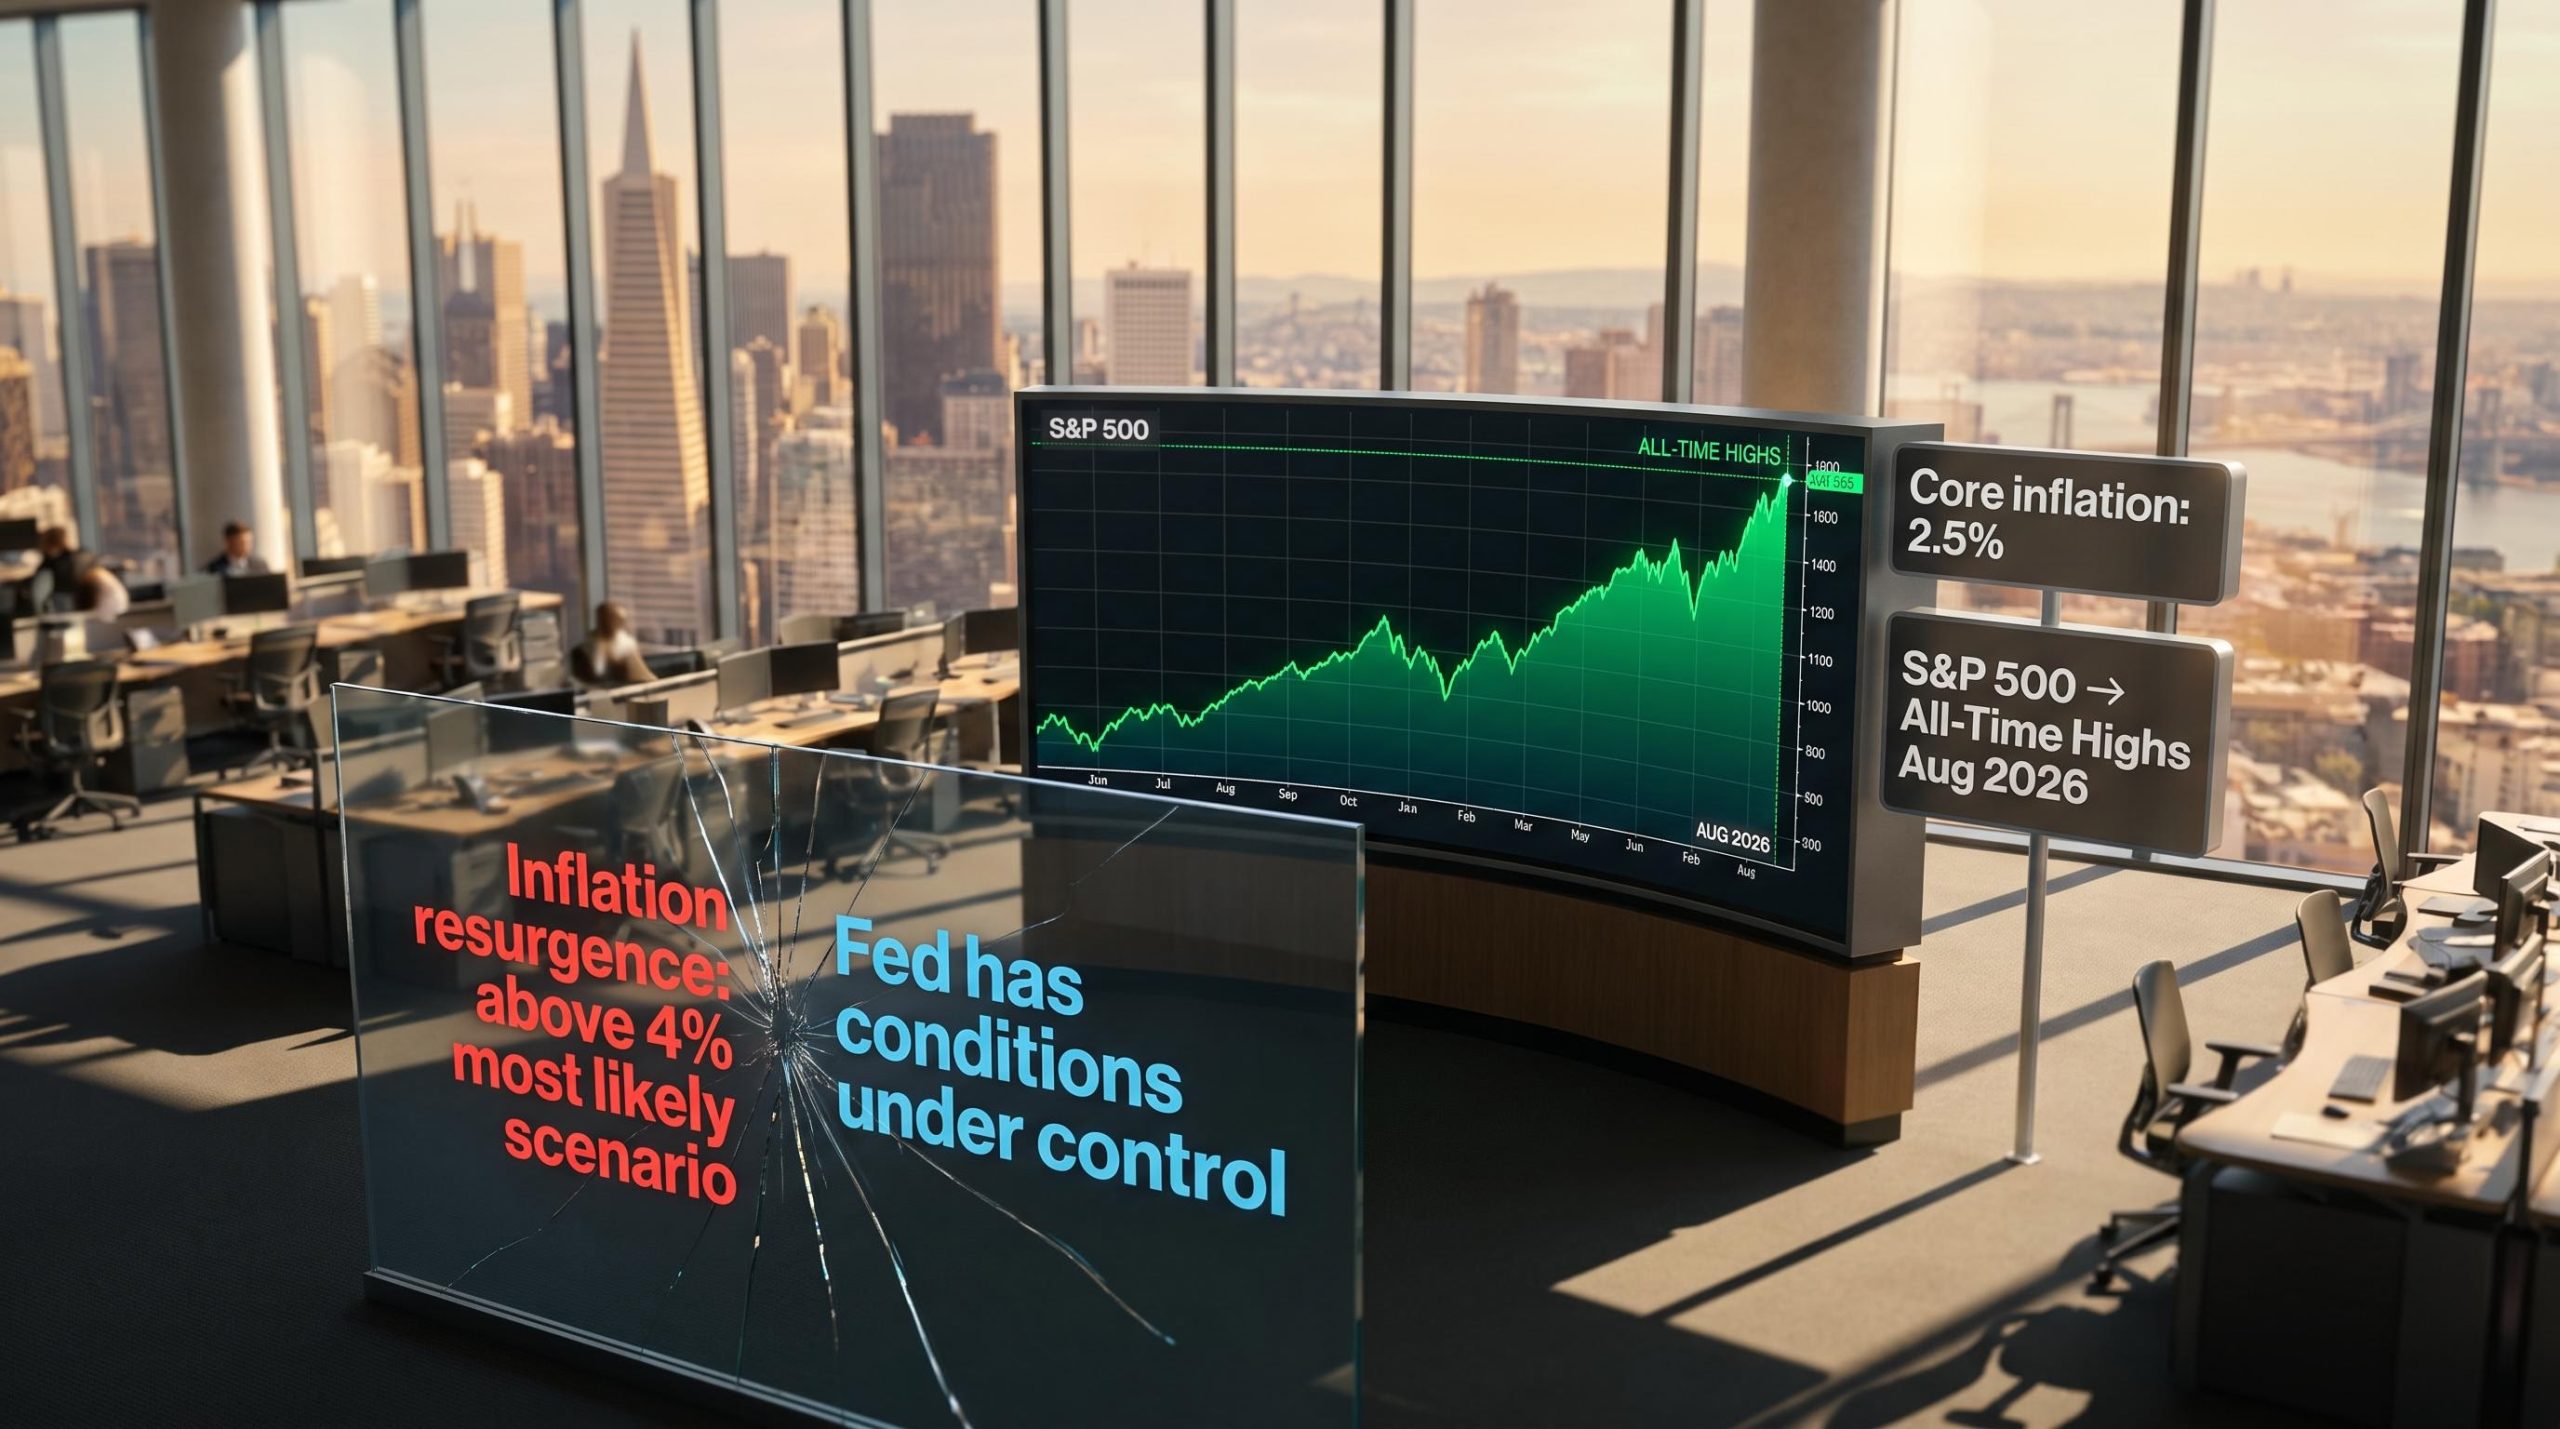
In August 2026, the S&P 500 was advancing toward all-time highs. Within the same month, inflation commentary was swinging between warnings of a resurgence and reassurances that the Federal Reserve had conditions under control. For investors watching both the headlines and the market, the two tracks were telling different stories.
This disconnect is not a 2026 anomaly. It is the normal condition when investors treat monthly inflation prints and Fed meetings as portfolio triggers rather than as single data points in a much longer conversation. The cost is specific: investors who sold on alarming June or early July 2026 inflation commentary would have exited before the market advanced toward record levels.
Here is a clearer way to read inflation data and Fed commentary without letting narrative velocity override sound judgment. The framework below covers what the market is actually discounting when inflation headlines land, why the most expensive mistakes concentrate around the moments that feel most urgent, and what questions to ask before the next cycle produces the same oscillating noise.
The 2026 episode in real time: narrative whiplash versus market reality
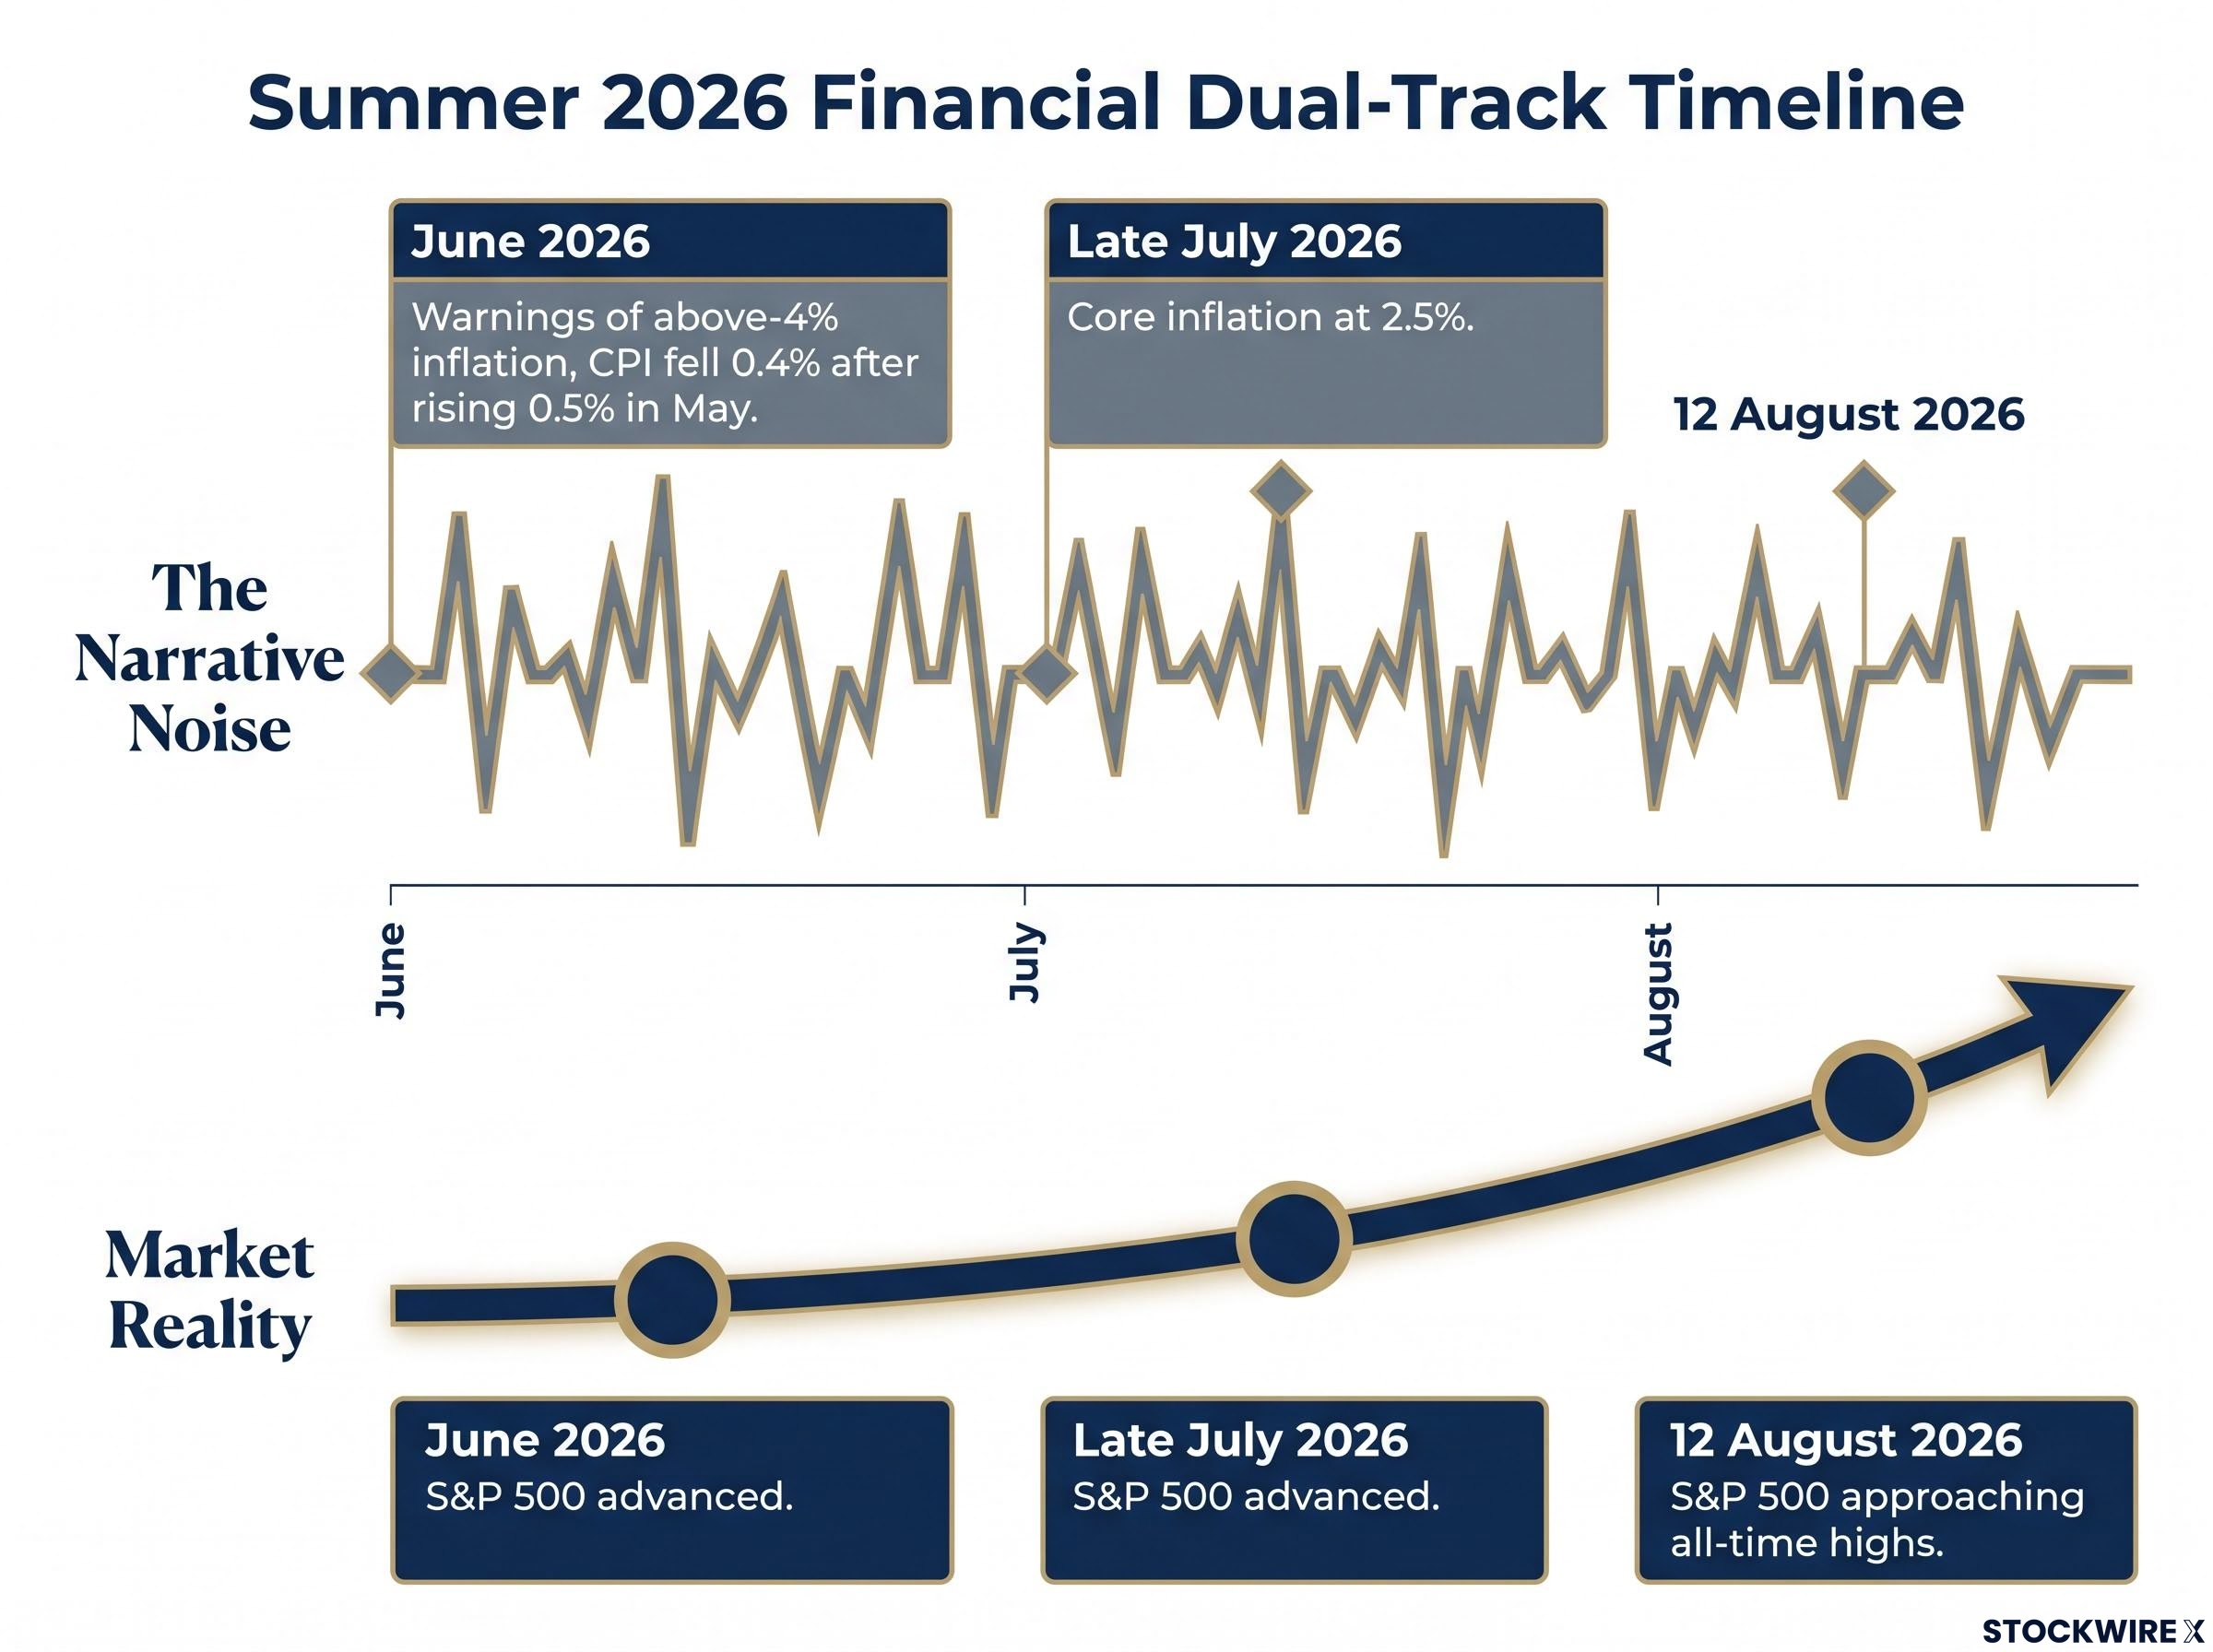
Two parallel tracks ran through the June to August 2026 window. On one side, commentary was shifting within weeks from alarming to reassuring, without a structural change in the underlying data. On the other, equities kept climbing.
| Window | Alarming narrative | Reassuring narrative | What the market did |
|---|---|---|---|
| June 2026 | Analysts warned fiscal loosening, labour supply tightening, and tariffs made above-4% inflation “the most likely scenario” (analyst estimate, not independently confirmed) | Fed stance characterised as balanced; expectations anchored | S&P 500 advanced after June CPI release |
| Late July 2026 | Monthly CPI volatility cited as evidence of instability (CPI fell 0.4% in June after rising 0.5% in May, data point not independently confirmed) | Core inflation at 2.5% closer to Fed’s longer-run target | S&P 500 advanced following late July Fed meeting |
| August 2026 | Persistent warnings of second-wave risk | Central bank frameworks refined since 2022; supply-driven shocks distinguished from broad spirals | Equities approaching all-time highs as of 12 August 2026 |
The commentary shifted. The data wobbled month to month. The market looked through both.
The distinction between supply-driven and demand-driven price pressures is central to reading any CPI release accurately; inflation mechanics, including how central banks distinguish transitory shocks from structural spirals, determine which policy tool gets deployed and at what pace.
Why did equities keep advancing? Fisher Investments’ editorial staff attributed the market’s resilience not to an improved July data point, but to markets having already determined, across several quarters of observation, that the underlying direction of inflation posed no meaningful long-term threat.
That distinction matters. Investors who acted on the alarming narrative in June or early July sold before an advance toward record levels. The cost of treating noise as signal was not abstract; it was a specific missed move in a specific month.
When big ASX news breaks, our subscribers know first
The 2022 bear market left investors with the wrong mental model
Most investors carry a simplified version of 2022: inflation surged, the Fed hiked aggressively, stocks fell. The rule that follows is straightforward: rate hikes equal bear market. Next time inflation headlines flash red, sell.
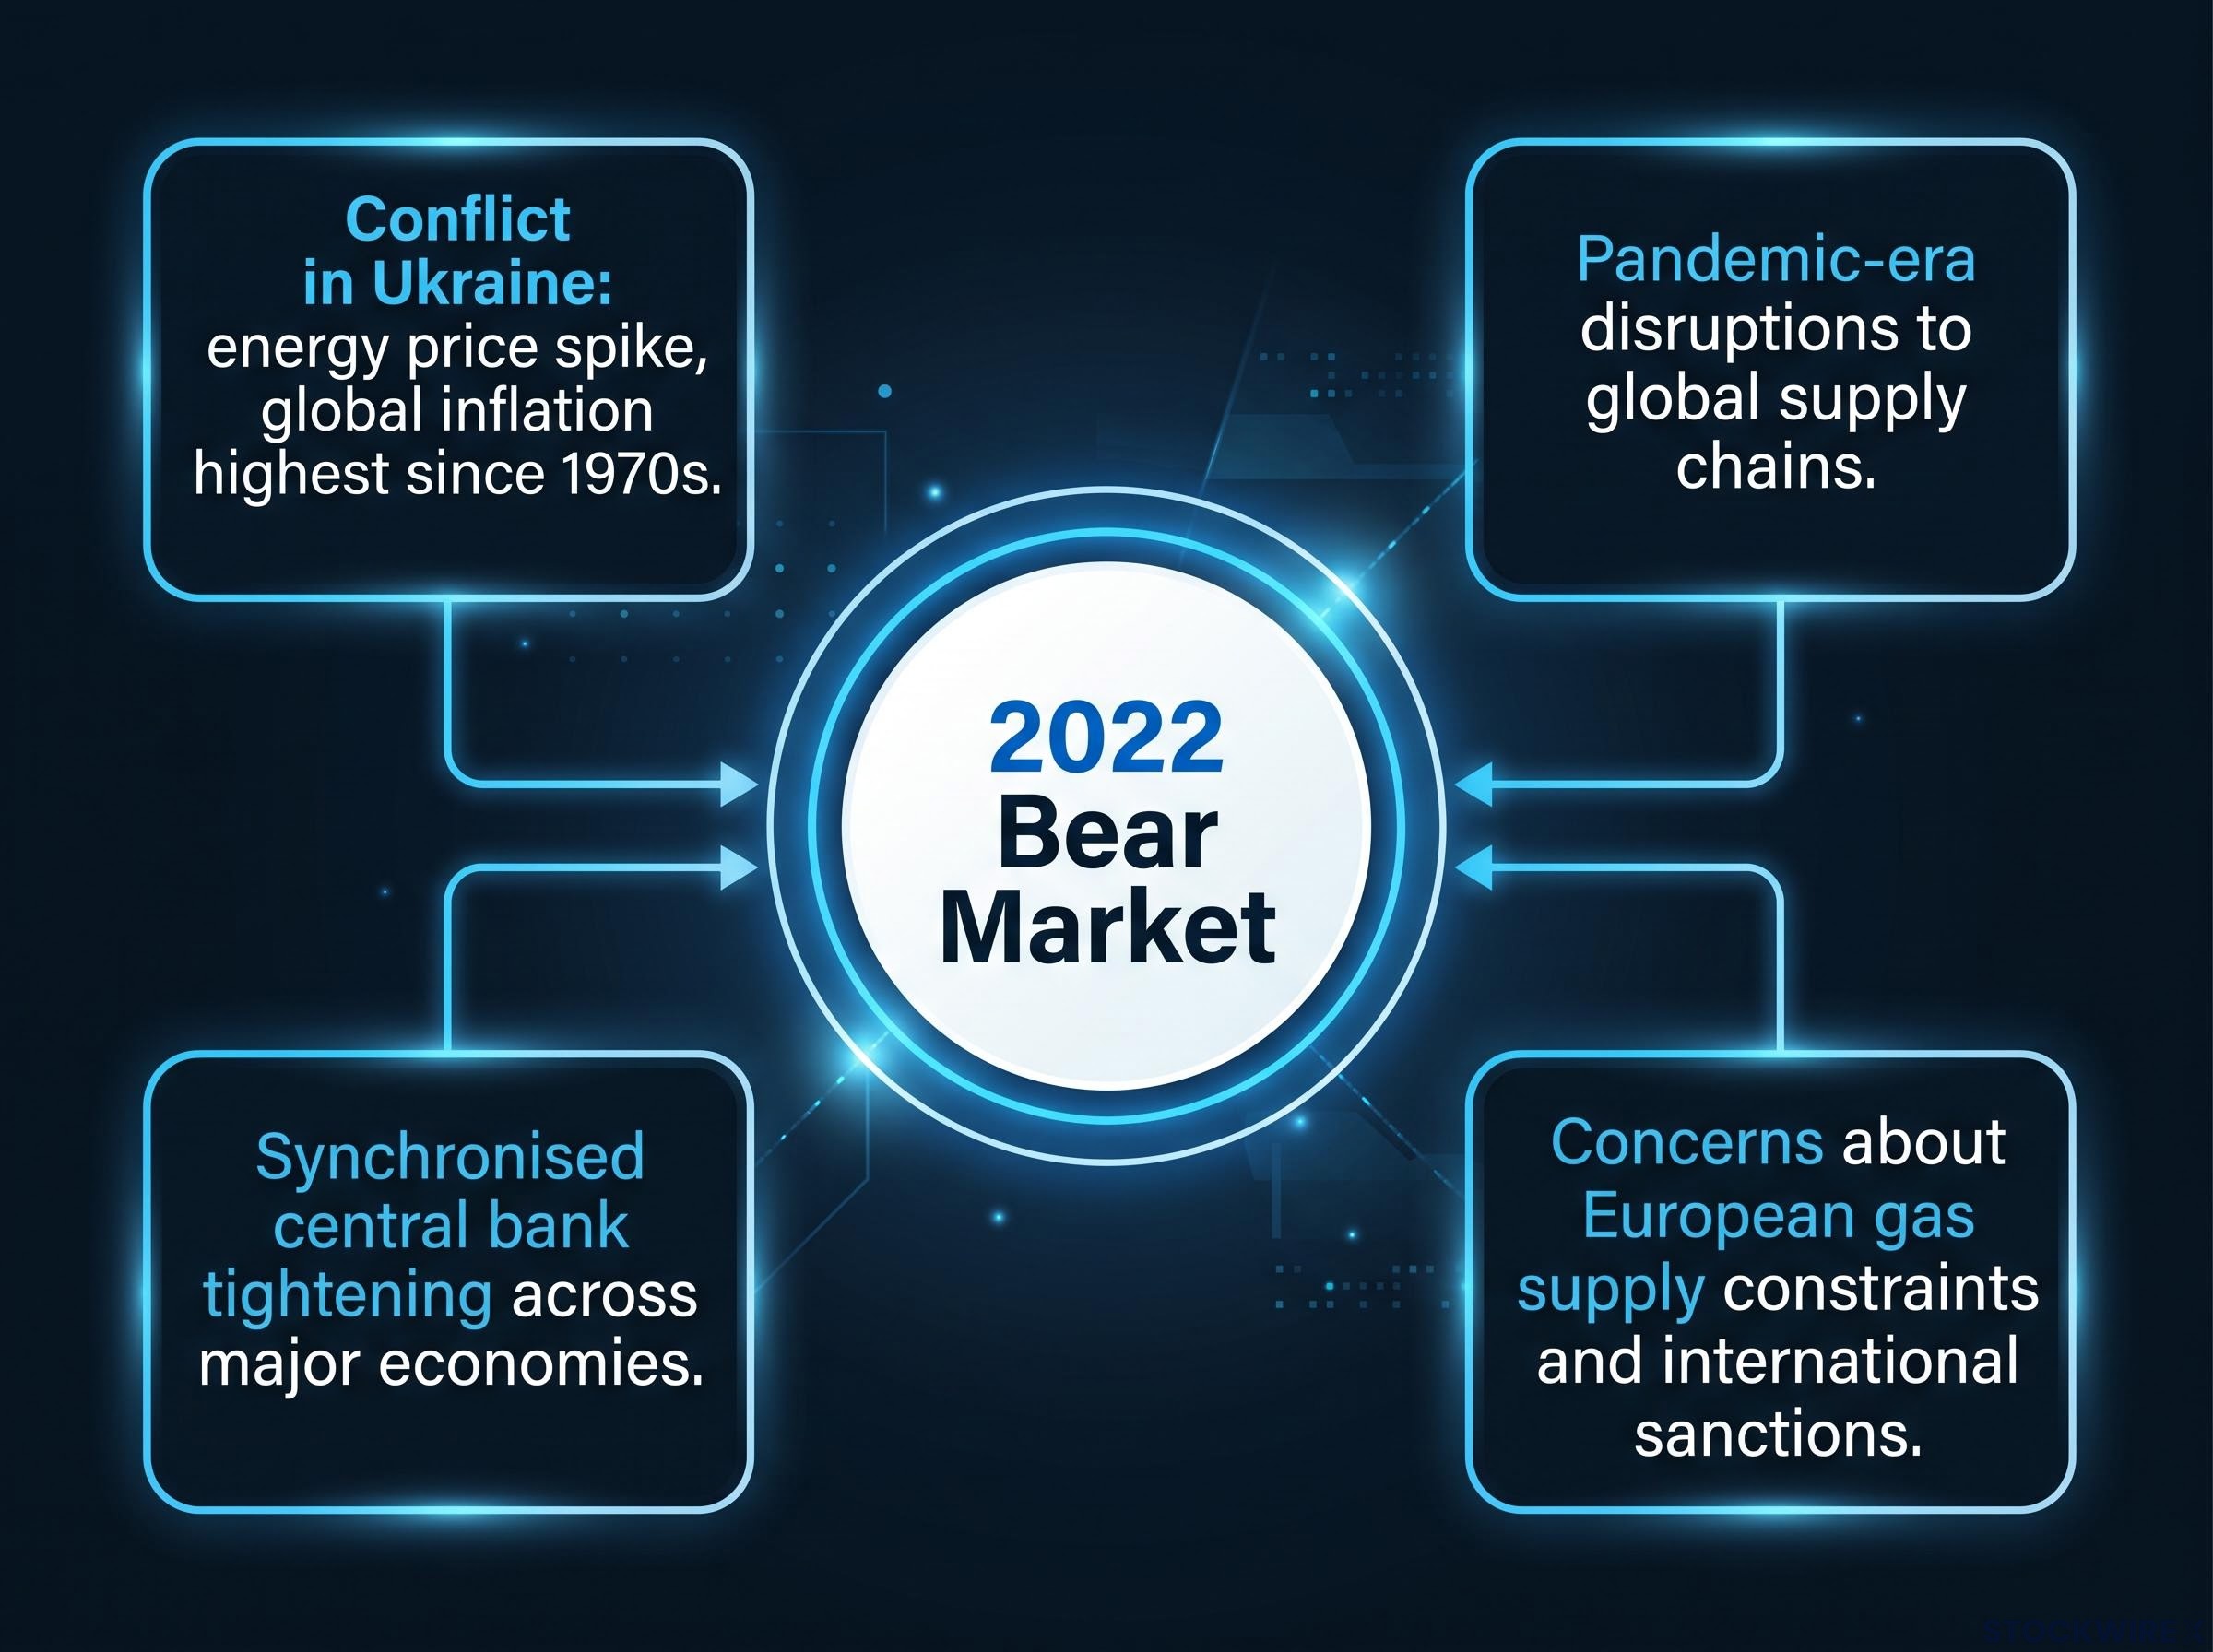
That rule is missing most of the picture. The 2022 downturn reflected a cluster of simultaneous negative forces, not monetary policy alone:
- The conflict in Ukraine, which triggered a sharp energy price spike and helped push global inflation to its highest levels since the 1970s
- Pandemic-era disruptions to global supply chains that took years to fully unwind
- Synchronised central bank tightening across major economies
- Concerns about European gas supply constraints and the broader economic fallout from international sanctions
Remove any one of those forces and the 2022 market outcome looks different. The bear market was relatively shallow given the severity of the shocks acting at once.
What the macro outcome revealed
The recovery from 2022 was more orderly than the crisis framing suggested. The Federal Reserve estimates that US inflation fell approximately 5 percentage points from mid-2022 to early 2025, with only modest unemployment increases and limited GDP softening.
The IMF characterised the “synchronised tightening and disinflation without a recession” as a major policy success. That is the opposite of the catastrophe narrative many investors internalised. The 2022 episode did not prove that rate hikes automatically destroy equity markets. It proved that multi-factor shocks of unusual severity created a specific, non-repeatable environment, and that investors who encoded it as a simple rule became hypersensitive to every subsequent inflation headline.
The Federal Reserve’s inflation trajectory data, including Governor Cook’s July 2026 remarks, confirms that 12-month inflation had fallen to 2.3 percent by April 2025, down from 2.8 percent a year earlier, a trajectory that professional investors were pricing well before each monthly CPI release made headlines.
October 2022 showed what markets were actually pricing
Equities bottomed and a fresh bull market took hold in October 2022, at a point when the Federal Reserve had not yet finished raising rates.
Sit with that for a moment. The simplified rule says rate hikes equal falling markets. The market itself started a new bull cycle while the hiking was still underway. The contradiction resolves once you understand how equity prices actually work.
Equity markets are forward-looking. Prices reflect expectations about the next several quarters, not the current policy stance. Markets began pricing the anticipated end of the tightening cycle before the final hike occurred. That is the forward-pricing mechanism: equities focus on a window of roughly 3 to 30 months ahead, meaning short-horizon data tends to be baked in already while events further out carry too much uncertainty to price reliably.
The core concept: Markets discount expected trajectories, not current policy stances. By the time a CPI report is published and processed by media, professional investors have typically been trading on the underlying drivers for weeks or months.
What this tells you is that waiting for the Fed to formally stop hiking before buying back in is a strategy structured to miss the recovery. Markets price the expected end of tightening, not its formal completion. The October 2022 timing was not an anomaly; it was the mechanism working exactly as it has across multiple cycles.
What actually drives markets when inflation headlines hit
A single CPI print enters a much larger calculation. Equity markets track and incorporate multiple inputs simultaneously:
- Official inflation data (CPI, PCE, the Personal Consumption Expenditures Price Index, which measures price changes in consumer goods and services)
- Market-based inflation expectations, including breakeven rates monitored by institutions such as the Cleveland Fed
- Wage growth and labour market tightness
- Fiscal stances and government spending trajectories
- Capacity constraints across supply chains
A headline surprise, where inflation comes in higher or lower than consensus, primarily drives intra-day or short-term volatility. It rarely changes the longer-term valuation picture unless it signals something more consequential: a genuine regime change in inflation dynamics.
Why headline surprises rarely change the longer-term picture
The variable that separates a manageable inflation episode from a self-reinforcing spiral is expectations anchoring. If longer-term inflation expectations, the rates at which businesses, consumers, and bond markets anticipate future price growth, remain anchored, then a supply-driven price spike in energy or shelter is a fundamentally different risk than a broad wage-price spiral where rising costs and rising wages feed each other.
Throughout 2022-2025, expectations in major economies remained reasonably anchored, which helped inflation fall without a large output cost. The question you should be asking is not “is inflation rising?” but “are inflation expectations drifting in a way that forces a structural policy response?” These are very different questions with very different portfolio implications.
The largest positive return periods often occur during or just after high-uncertainty phases, when many headline-driven investors have already exited the market.
Why investors keep repeating this pattern
The tendency to sell on alarming inflation headlines and buy back at higher prices is not irrational from the inside. Four behavioural patterns, each well-documented in the academic literature, explain why it persists:
- Availability bias: The 2022 downturn is vivid in memory, making similar-sounding headlines in 2026 feel predictive even when the context is fundamentally different
- Loss aversion: The potential pain of a loss feels more urgent than the opportunity cost of a forgone gain, prompting premature selling when headlines hint at trouble
- Narrative congruence: Headlines that fit the existing “inflation is bad for stocks” story feel more credible than those that challenge it, reinforcing the simplified 2022 mental model
- Action bias: Doing something, whether selling, rotating, or rebalancing, feels more prudent than holding, even when the incoming information is mostly noise
Each of these sounds like good judgment in the moment. That is what makes the pattern so durable.
Sell-decision biases documented in behavioural finance research compound the problem further: a University of Chicago study found that randomly selected exits outperformed professional portfolio managers by up to 150 basis points annually, concentrating the destruction of portfolio value precisely at the moments when alarming headlines make action feel most justified.
The measurable cost in real portfolios
Dollar-weighted returns measure what investors actually earned given their timing decisions. Time-weighted returns measure what the assets themselves delivered over the same period, regardless of when money moved in or out.
Across a broad body of behavioural finance research, dollar-weighted returns are materially lower than time-weighted returns. The gap is largely attributable to poor timing around periods of stress and euphoria, precisely the environment created by rapid narrative shifts around inflation and Fed policy. This is not an abstract concern. It is a measurable shortfall between what your portfolio earned and what the market actually delivered over the same stretch.
A framework for using inflation data without letting it use you
The shift from reactive to structured starts with three questions, asked in sequence before making any portfolio move based on an inflation headline:
- Are wages, credit conditions, and consumer sentiment moving in a consistent direction? Isolated data points are noise. Convergence across multiple indicators is signal.
- Is this a supply shock concentrated in energy or shelter, or a broad, persistent shift? A tariff-driven energy spike operates differently from a self-reinforcing wage-price spiral. Markets price them differently, and your response should differ accordingly.
- Are market-based inflation expectations remaining anchored or beginning to drift? This is the variable central banks and professional investors weight most heavily, and it is the one that rarely appears in headline coverage.
Underlying inflation measures, including core, median, and trimmed-mean, are the gauges central banks track most closely. Multi-quarter trends in these measures tell you far more than any single monthly print.
The Fed communication regime shifted materially in June 2026 when incoming Chair Kevin Warsh scrapped forward guidance and withheld his own dot plot projection, meaning the buffering layer that once absorbed market volatility between meetings no longer exists and each data release now carries greater pricing weight on its own.
The narrative reversal as a diagnostic signal: When commentary swings sharply within a month without a structural change in data, it is information about media dynamics, not about the economy. The June-July 2026 oscillation was a story about how stories are told, not a sudden transformation of the inflation outlook.
Investors with five-year-plus horizons have generally been better served by staying invested through inflation-driven volatility than by attempting to sidestep every headline cycle. Most of the urgency you feel around individual CPI releases is a mismatch between your actual investment horizon and the media’s attention cycle. Recognising that mismatch is itself a risk management tool.
What the 2026 pattern tells investors about the next inflation cycle
The through-line from 2022 to 2026 is consistent: the same misapplied mental model caused investors to misread two separate inflation episodes. The October 2022 bull market commenced during active Fed hiking. The S&P 500 advanced toward all-time highs in August 2026 despite weeks of alarming inflation commentary. Both episodes illustrate the same structural feature: equity markets price expected trajectories, not current conditions, and they do it before the headlines catch up.
The diagnostic for the next cycle is the same one that applied to this one. A supply-driven shock that leaves longer-term inflation expectations anchored is a different event from an expectations drift that forces a structural policy response. The 2026 episode fell into the former category. Knowing which category applies, before the commentary reaches peak volume, is what separates signal from noise.
Whether the current episode remains transitory or hardens into a structural inflation regime, driven by reversals in globalisation, demographics, and fiscal posture, is the longer-duration question that separates a manageable supply shock from a multi-decade shift in the price-level environment.
The practical takeaway: Inflation data and Fed commentary are inputs to a structured risk-management process, not triggers for reactive trades. Over full cycles, the difference between filtering signal and reacting to noise is what separates portfolios that compound steadily from those that do not.
The forward-pricing mechanism is not a one-off anomaly from October 2022 or a fortunate break in August 2026. It is how equity markets process macro stress, cycle after cycle. Building a strategy around it rather than against it is the durable edge, one that will still apply when the next inflation cycle generates the same oscillating commentary all over again.
This article is for informational purposes only and should not be considered financial advice. Investors should conduct their own research and consult with financial professionals before making investment decisions. Past performance does not guarantee future results. Financial projections are subject to market conditions and various risk factors.