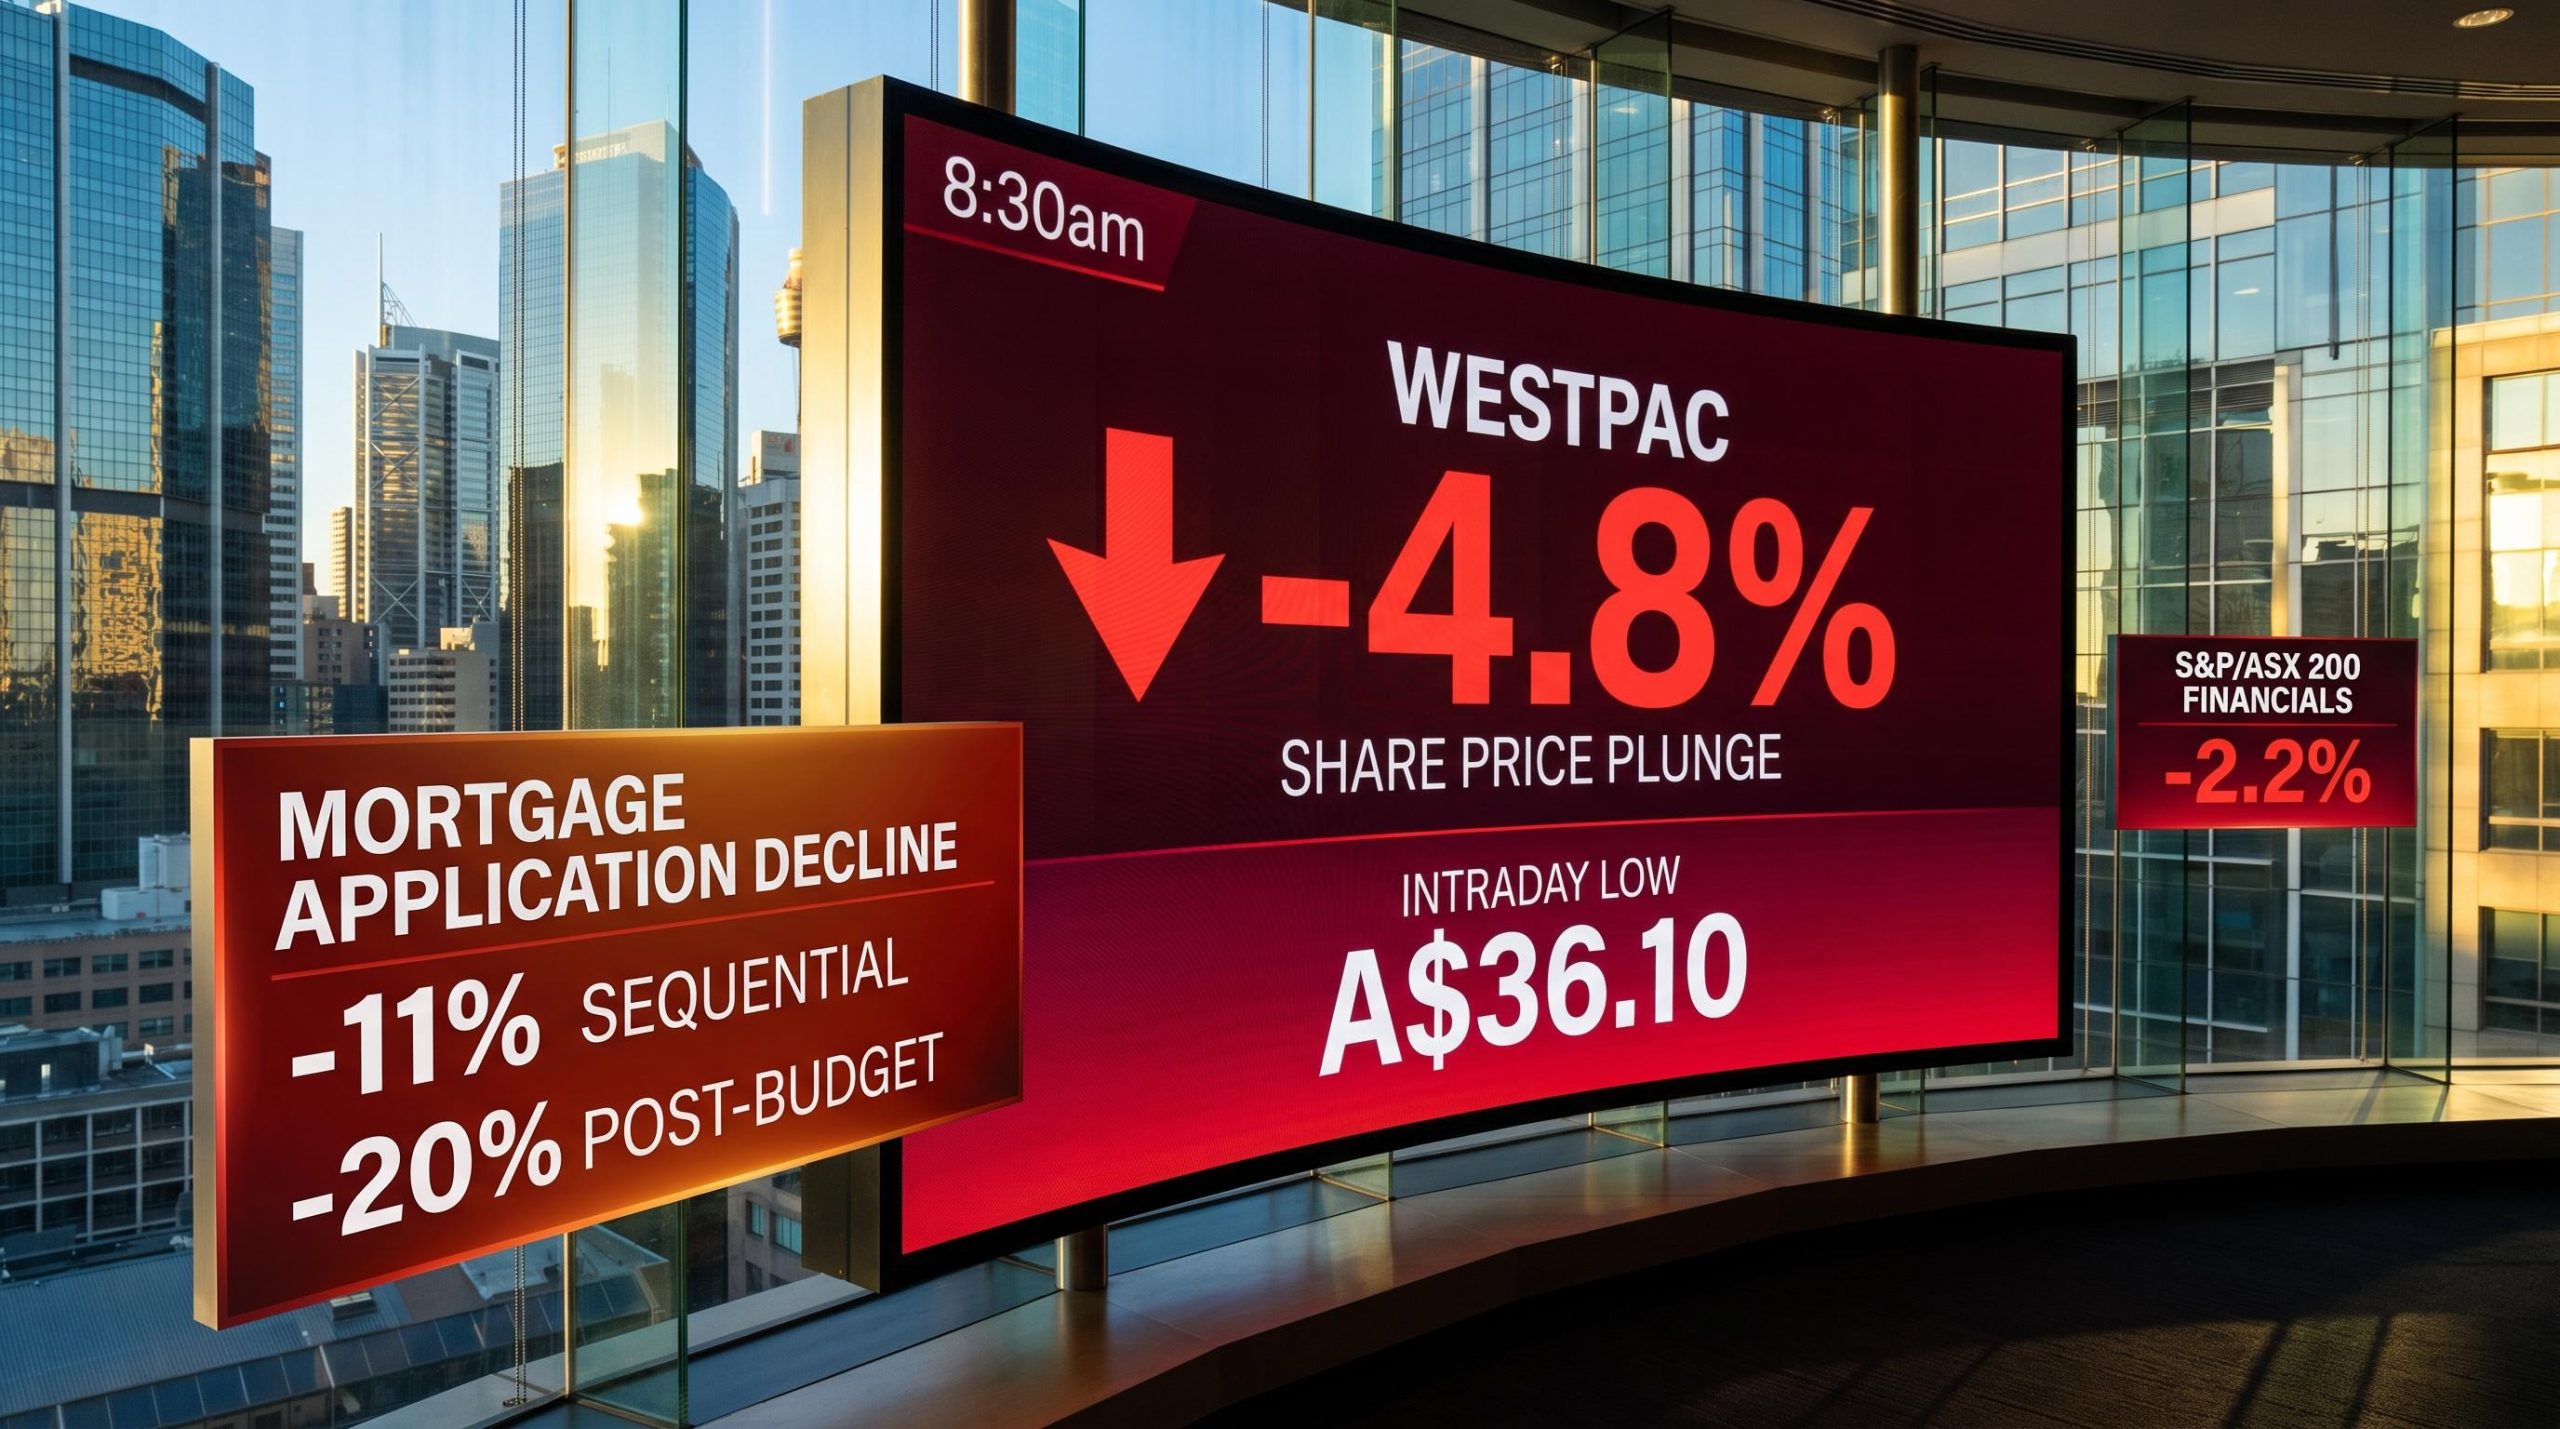
Westpac reported quarterly earnings of $1.8 billion on 10 August 2026, yet the share price had shed 4.5% by midday to sit at $36.22. A result that looked solid by any historical measure triggered one of the sharpest single-day falls in the Australian banking sector this year.
The reaction tells you what the market is actually grading. It is not scoring Westpac on what happened last quarter. It is repricing what the bank will earn over the next four to eight quarters, and the signals embedded in the Q3 update gave it reason to lower that estimate. Measured from the start of the year, Westpac shares have lost around 6% in value while the S&P/ASX 200 has moved roughly 6% higher over the same period. That divergence did not start today.
Here is what the result actually contained, why the margin and mortgage signals spooked investors, and what the numbers mean if you hold WBC or are watching it from the sidelines.
What Westpac’s Q3 2026 result actually showed
On the surface, the Q3 numbers read like a bank operating from a position of strength.
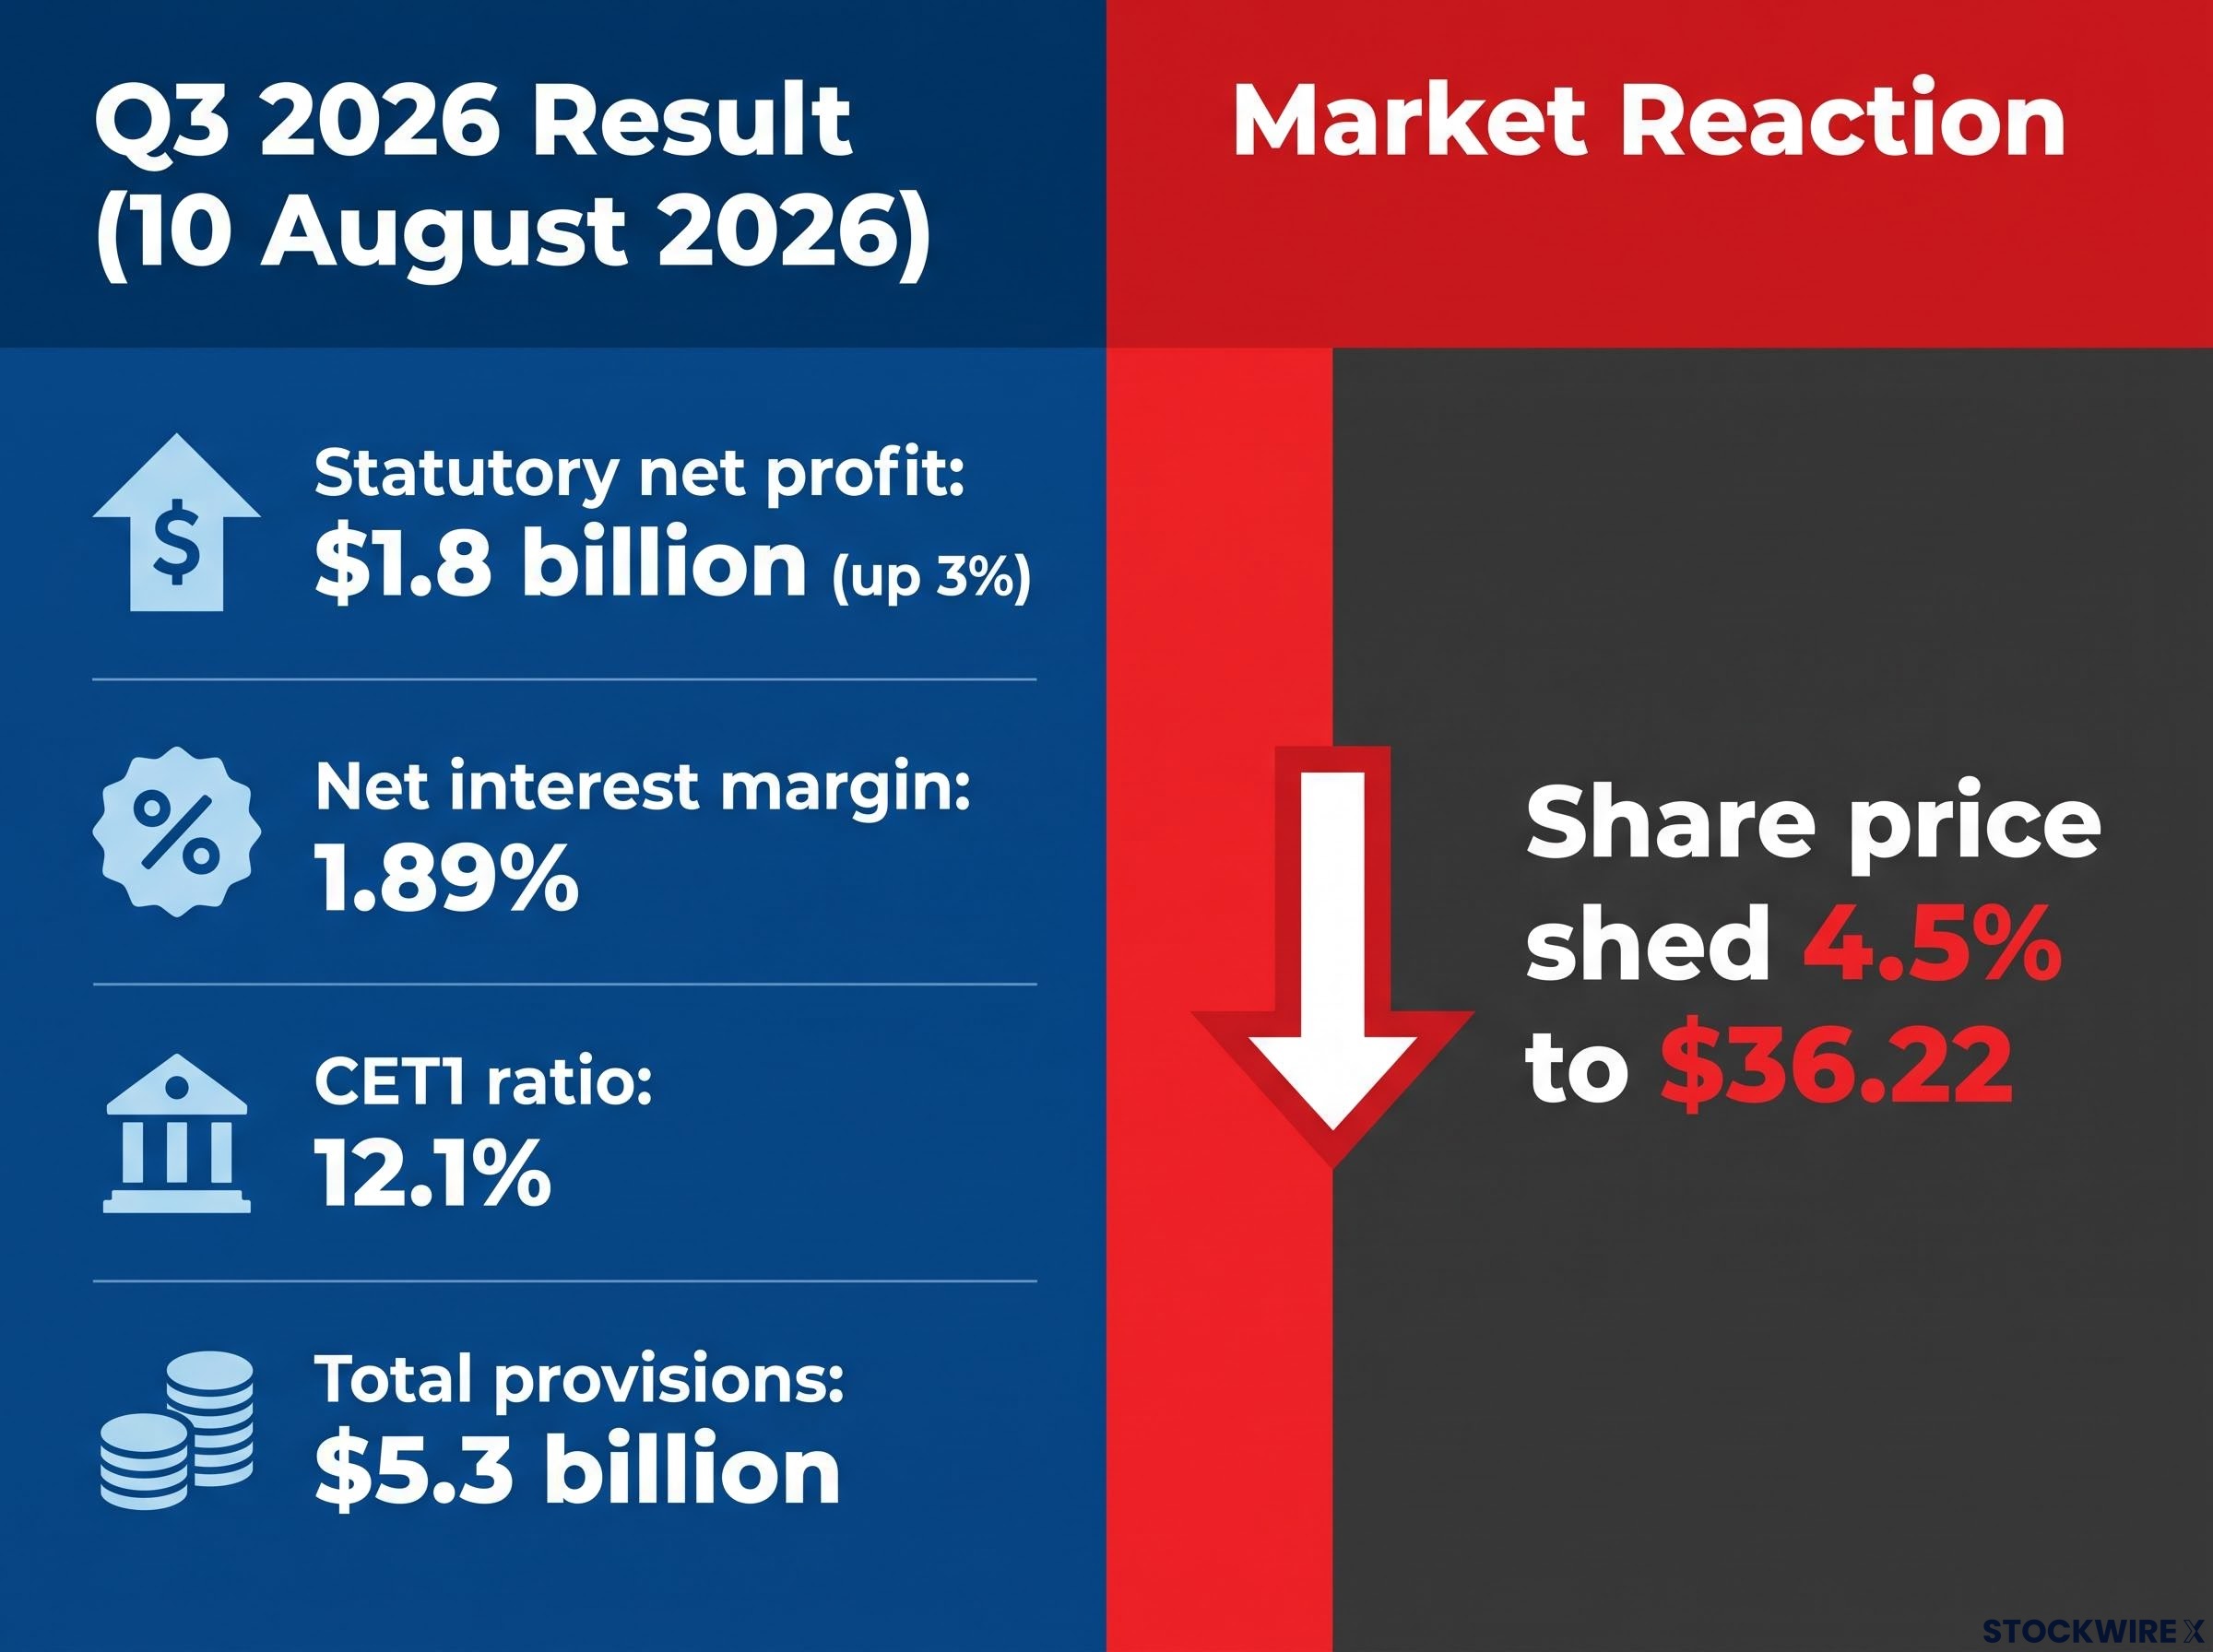
| Metric | Q3 2026 Result |
|---|---|
| Net profit (excl. notable items) | $1.8 billion |
| Statutory net profit | $1.8 billion (up 3%) |
| Net interest margin (NIM) | 1.89% |
| Housing credit growth (YoY) | 7% |
| Customer deposit growth (YoY) | 7% |
| CET1 capital ratio | 12.1% |
| Total credit provisions | $5.3 billion |
A 3% lift in statutory profit, 7% growth in both housing credit and deposits, and a capital ratio sitting comfortably above APRA minimums. Analyst commentary characterised the result as broadly respectable rather than alarming. On these numbers alone, the sell-off looks irrational.
APRA monthly banking statistics for June 2026 show system-wide housing credit and deposit growth trends that place Westpac’s 7% figures in a broader sector context, underscoring whether that growth rate reflects outperformance or simply a rising tide across all major lenders.
What management flagged beyond the headline numbers
The complication arrived in the guidance. Application volumes for new mortgages fell through the quarter as pricing competition sharpened, and the bank signalled that margins face additional near-term headwinds. The tone shifted from what happened to what comes next: cost-of-living headwinds, a moderating housing market, and a competitive landscape that is squeezing loan pricing harder.
That forward-looking language is what moved the market’s lens. The $1.8 billion profit was real; the question is whether the conditions that produced it are deteriorating underneath.
When big ASX news breaks, our subscribers know first
Why net interest margin matters more than profit for bank investors
Most investors look at a bank result and focus on the profit figure. That is the wrong place to start. The number that actually drives an Australian bank’s earnings is the net interest margin (NIM), the difference between what a bank earns on loans and what it pays on deposits, expressed as a percentage of its interest-earning assets.
The reason NIM carries so much weight is mechanical. Australian banks operate on thin margins spread across enormous loan books. A compression of just a few basis points (hundredths of a percentage point) translates into a material hit to earnings at scale. When margins are expanding, even modest loan growth produces strong profit growth. When they are compressing, a bank has to write significantly more business just to stand still.
The three ASX bank valuation metrics that analysts apply first, net interest margin, return on equity, and CET1 capital adequacy, each answer a different question about a bank’s health; NIM tests earnings quality, ROE tests whether the bank earns above its cost of capital, and CET1 tests whether it can sustain distributions under stress.
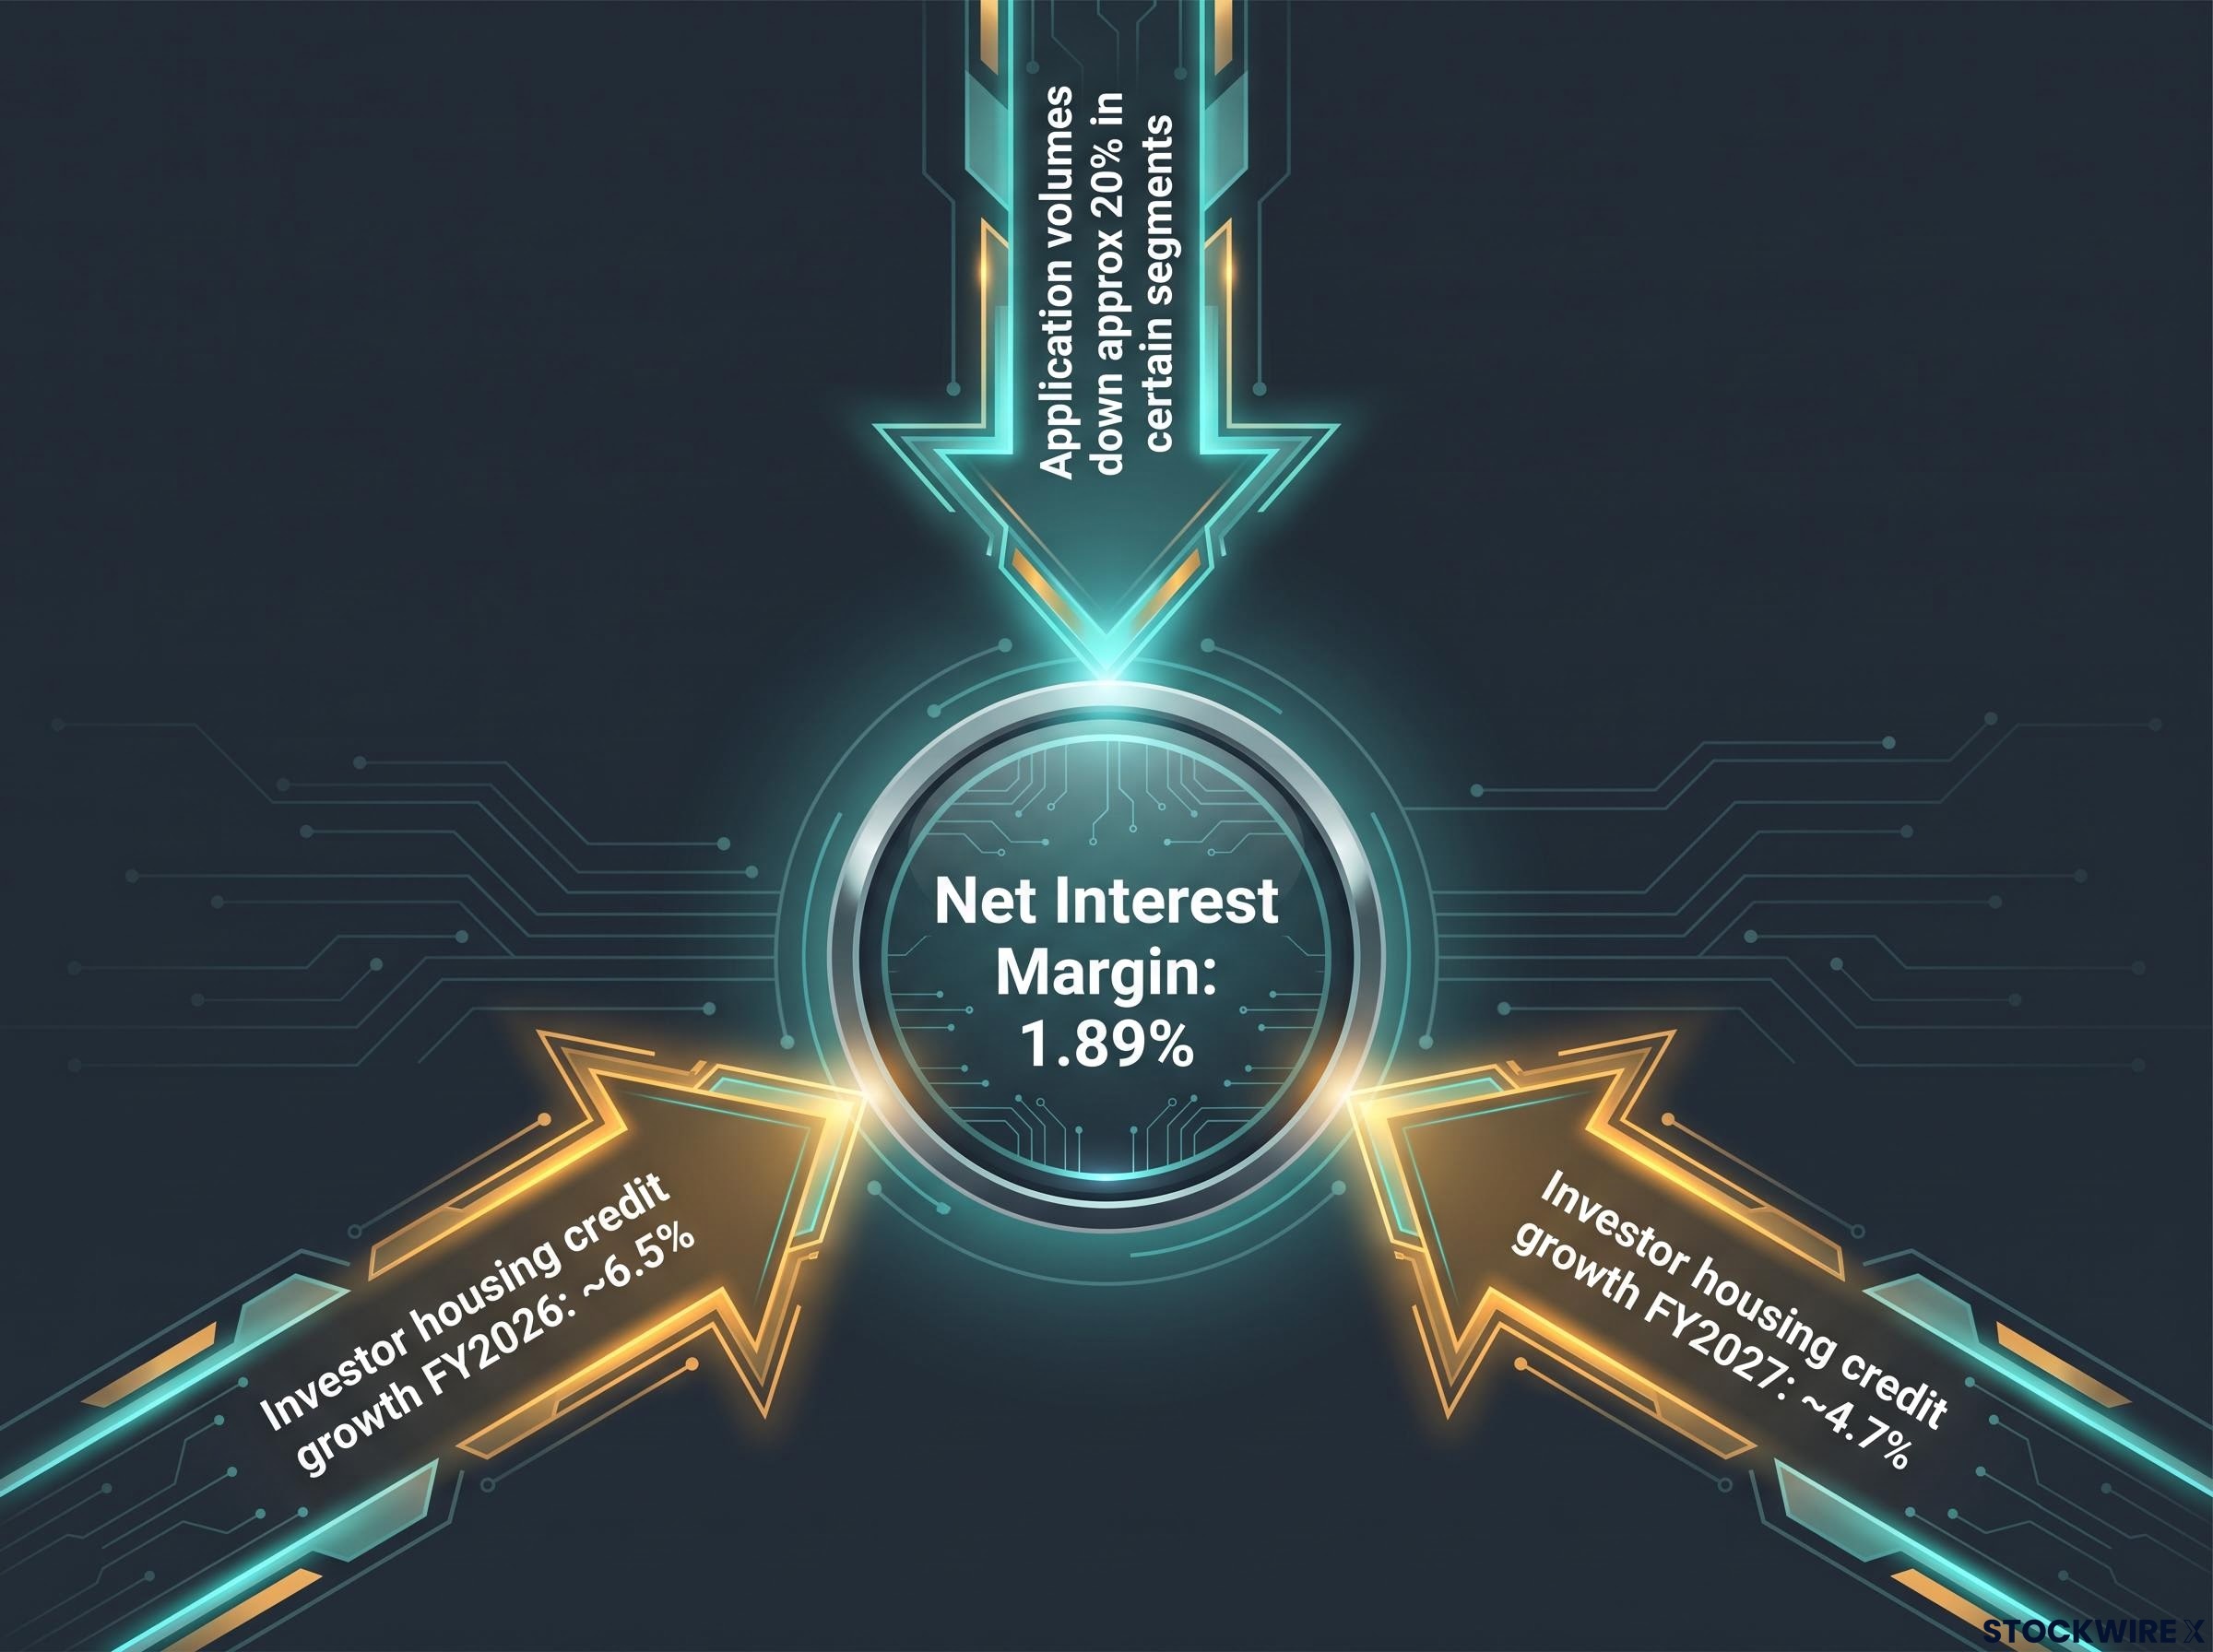
Westpac’s current NIM sits at 1.89%. Two forces are squeezing it simultaneously:
- Mortgage competition: Westpac and its peers are discounting home loans and offering sharper deposit rates to fight for market share, compressing the spread from both sides.
- RBA rate cut expectations: Prospective rate cuts tend to compress bank margins because lending rates fall faster than deposit costs adjust downward, narrowing the spread further.
Westpac’s NIM: 1.89% A stable NIM figure sounds reassuring in isolation. In the context of management guidance flagging further compression ahead, even a flat margin reading becomes a bearish signal, because it tells you the pressure has not yet shown up in the headline number but is building underneath.
When you see a bank’s margin under pressure from competition and rate expectations simultaneously, the concern is not what is happening today. It is what the margin looks like in six to twelve months, which is exactly what the sell-off was pricing in.
The mortgage slowdown and what it signals about Westpac’s revenue runway
The housing credit picture is not a single data point. It is a pattern unfolding across several quarters.
During Q3, mortgage application volumes fell approximately 20% in certain segments. Competitive dynamics and borrower uncertainty around interest rate direction were the primary drivers, compounded by budget-related policy impacts that began filtering through from around June 2026.
That volume decline sits alongside headline housing credit growth of 7% year-on-year, which still looks healthy. But current growth reflects loans already written; application volumes tell you what is coming next. The three signals compound in a specific sequence:
Morgan Stanley’s housing cycle exposure analysis for the major banks flagged that mortgage growth could decelerate from approximately 7.5% to 3-4% under a sustained rate-hike scenario, a structural constraint that compounds the application volume decline Westpac disclosed in Q3.
- Mortgage application volumes are falling, reducing the pipeline of new business coming through over the next two to three quarters.
- Forward credit growth is slowing, with analyst commentary suggesting investor housing credit growth may decelerate from approximately 6.5% in FY2026 to approximately 4.7% in FY2027 (this figure is drawn from analyst estimates and has not been independently verified against primary sources).
- Margins are under simultaneous pressure from competition, meaning Westpac cannot offset lower volumes by charging more on each loan.
For a bank as mortgage-heavy as Westpac, a simultaneous squeeze on margin and volume is the most unfavourable combination for earnings growth. That is the signal the sell-off was responding to.
Why the RBA rate outlook adds another layer of pressure
The Reserve Bank of Australia’s (RBA) rate trajectory compounds the problem through a specific mechanism. When the RBA cuts rates, banks typically pass through the reduction to borrowers relatively quickly, because competitive pressure forces their hand. Deposit rate reductions, however, tend to lag. Savers notice and resist, and banks that cut deposit rates too aggressively risk losing funding.
The result is a temporary compression in the spread between lending and deposit rates, the exact spread that determines NIM. If the RBA moves into a cutting cycle over the coming quarters, Westpac’s margin faces pressure from three directions rather than two: competition, rate cuts, and sticky deposit costs.
What Westpac’s balance sheet strength actually tells you
The concern narrative above is real, but it is not the whole picture. Westpac’s balance sheet metrics tell a genuinely reassuring story on a different question.
- CET1 ratio of 12.1%: The common equity tier 1 ratio, the core measure of a bank’s financial strength under APRA and Basel III requirements, sits comfortably above regulatory minimums. This gives the bank room to fund its operations and distribute capital back to shareholders.
- Total provisions of $5.3 billion: Credit provisions held for anticipated losses remained substantial, reflecting a conservative posture on potential bad debts.
- Low impairment charges: Borrowers were broadly managing their debt obligations during Q3 despite a difficult economic backdrop, and impairment charges stayed at low levels.
These metrics are genuinely solid. They address a specific risk category: Westpac’s ability to withstand economic shocks and continue paying dividends.
What they do not address is the separate question the market was asking on 10 August: whether Westpac’s earnings will grow from here. Financial strength and earnings growth are different questions, and the sell-off was a verdict on the second, not the first.
If you see strong capital metrics and conclude the sell-off was overdone, check which question you are answering. A 12.1% CET1 ratio and $5.3 billion in provisions tell you Westpac is not in trouble. They do not tell you that earnings will grow.
How Westpac holders should think about what happens from here
The honest reading is that the outcome from here is genuinely uncertain, and two credible scenarios sit side by side. If housing and margin conditions stabilise, the 10 August sell-off may later read as an overreaction priced in at a moment of peak pessimism. If they deteriorate further, it will look like a rational early reassessment of Westpac’s earnings power.
The year-to-date performance divergence offers context. Through 10 August 2026, Westpac had shed around 6% while the ASX 200 had climbed roughly 6%. Looking back across the prior 12 months, the bank had gained approximately 8% compared with around 4.5% for the broader index. The market has been repricing Westpac for months, not just today, and the quarterly result accelerated a trend already in motion.
PE ratios for bank stocks are a particularly unreliable guide in the current environment, because the NIM tailwind from the 2022-2023 rate-hike cycle has largely played out, and investors who extrapolate prior earnings-per-share growth forward risk overstating Westpac’s earnings power at precisely the moment the bank’s guidance is signalling the opposite.
On several recent result days, Westpac shares have underperformed when margins disappointed or costs surprised to the upside. That track record means sentiment risk is a real factor heading into future reporting dates.
Four variables to watch before Westpac’s next result
- RBA rate decisions and timing. The pace of any rate cuts determines how quickly lending margins compress relative to deposit costs.
- Mortgage application volume trends. Whether the approximately 20% decline in certain segments reverses or persists shapes the revenue pipeline for the next two to three quarters.
- Competitive intensity in home lending. If pricing pressure among the major banks eases, NIM has room to stabilise; if it intensifies, the margin trajectory worsens.
- Cost discipline. Westpac’s ability to offset weaker top-line growth through controlled expenses is the lever management can actually pull.
These four variables will determine which scenario plays out. They are not predictions; they are the monitoring framework that tells you whether the repricing is complete or ongoing.
This article is for informational purposes only and should not be considered financial advice. Investors should conduct their own research and consult with financial professionals before making investment decisions.
What the sell-off changes, and what it does not
The $1.8 billion quarterly profit was real. It was solid by any reasonable historical measure. The balance sheet, anchored by a 12.1% CET1 ratio and $5.3 billion in provisions, is not in question.
What the market repriced on 10 August was the forward earnings trajectory. Management guidance on margins, the decline in mortgage application volumes, and the competitive and rate environment all pointed to a weaker revenue path several quarters out. The sell-off was the market updating its probability estimate on where Westpac’s earnings go from here, not a panic exit.
The central tension is straightforward: strong current profit, uncertain forward earnings, and a market that prices the future. Understanding that distinction is what separates a reactive response from an informed one.
Today’s move is part of a broader pattern of year-to-date underperformance, not an isolated event. If you treat it as irrational panic, you ignore the legitimate forward concerns. If you treat it as a signal that Westpac is in trouble, you ignore the genuine balance sheet strength. The most useful read sits between those two extremes: a rational repricing of an earnings outlook that has become harder to forecast, priced into a stock that the market had already been marking down for months.
Past performance does not guarantee future results. Financial projections are subject to market conditions and various risk factors.