
Disney’s streaming division nearly doubled its operating profit in a single quarter. The headline from Q3 FY2026 is genuinely impressive. But management’s own guidance tells a more cautious story than the number suggests.
The result for Disney+ and Hulu (excluding ESPN) landed operating margin at 12.9%, up from roughly 6-7% a year earlier, on $5.53 billion in revenue. That is not a rounding error. But the same shareholder letter that celebrated the result flagged that timing of marketing and programming spend played a meaningful role. For investors evaluating Disney as a long-term streaming play, the interesting question is not what happened in Q3. It is what the underlying business is capable of sustaining.
Here is what the data actually tells you about Disney’s streaming profit trajectory, and what to watch over the next four to eight quarters before drawing a conclusion about the long-term investment case. This piece separates the durable gains from the timing-driven ones, explains how operating leverage can keep profit growing faster than revenue even as top-line growth moderates, and gives you a specific set of metrics to monitor.
What the Q3 numbers actually show
Start with the raw result, because it deserves to be seen clearly before any interpretation layers on top.
Disney’s entertainment streaming segment reported $5.53 billion in revenue for the quarter ended 28 June 2026, up 11% year over year. Operating income came in at $712 million, versus $329 million in the prior-year quarter. Subscription revenue rose 15%, driven by both subscriber volume and price increases. Ad impressions grew 8%, though ad rates fell 4%, producing only modest net advertising revenue growth.
| Metric | Q3 FY2025 (approx.) | Q3 FY2026 | Year-over-Year Change |
|---|---|---|---|
| Revenue | ~$4.98B | $5.53B | +11% |
| Operating Income | $329M | $712M | +116% |
| Operating Margin | ~6-7% | 12.9% | ~+6 percentage points |
| Subscription Revenue Growth | — | — | +15% |
| Programming & Production Expenses | ~$4.6B | ~$4.8B | +4% |
On the cost side, programming, production, and other expenses rose just 4% to approximately $4.8 billion. That 4-percentage-point gap between 11% revenue growth and 4% cost growth is the mechanical story here, and it is the spread worth tracking going forward, not the absolute margin level.
Tracking the revenue-versus-cost spread each quarter is a practical application of profit margin analysis, one of the five core metrics that together form the building blocks for evaluating whether a business is genuinely compounding value or simply riding a favourable cycle.
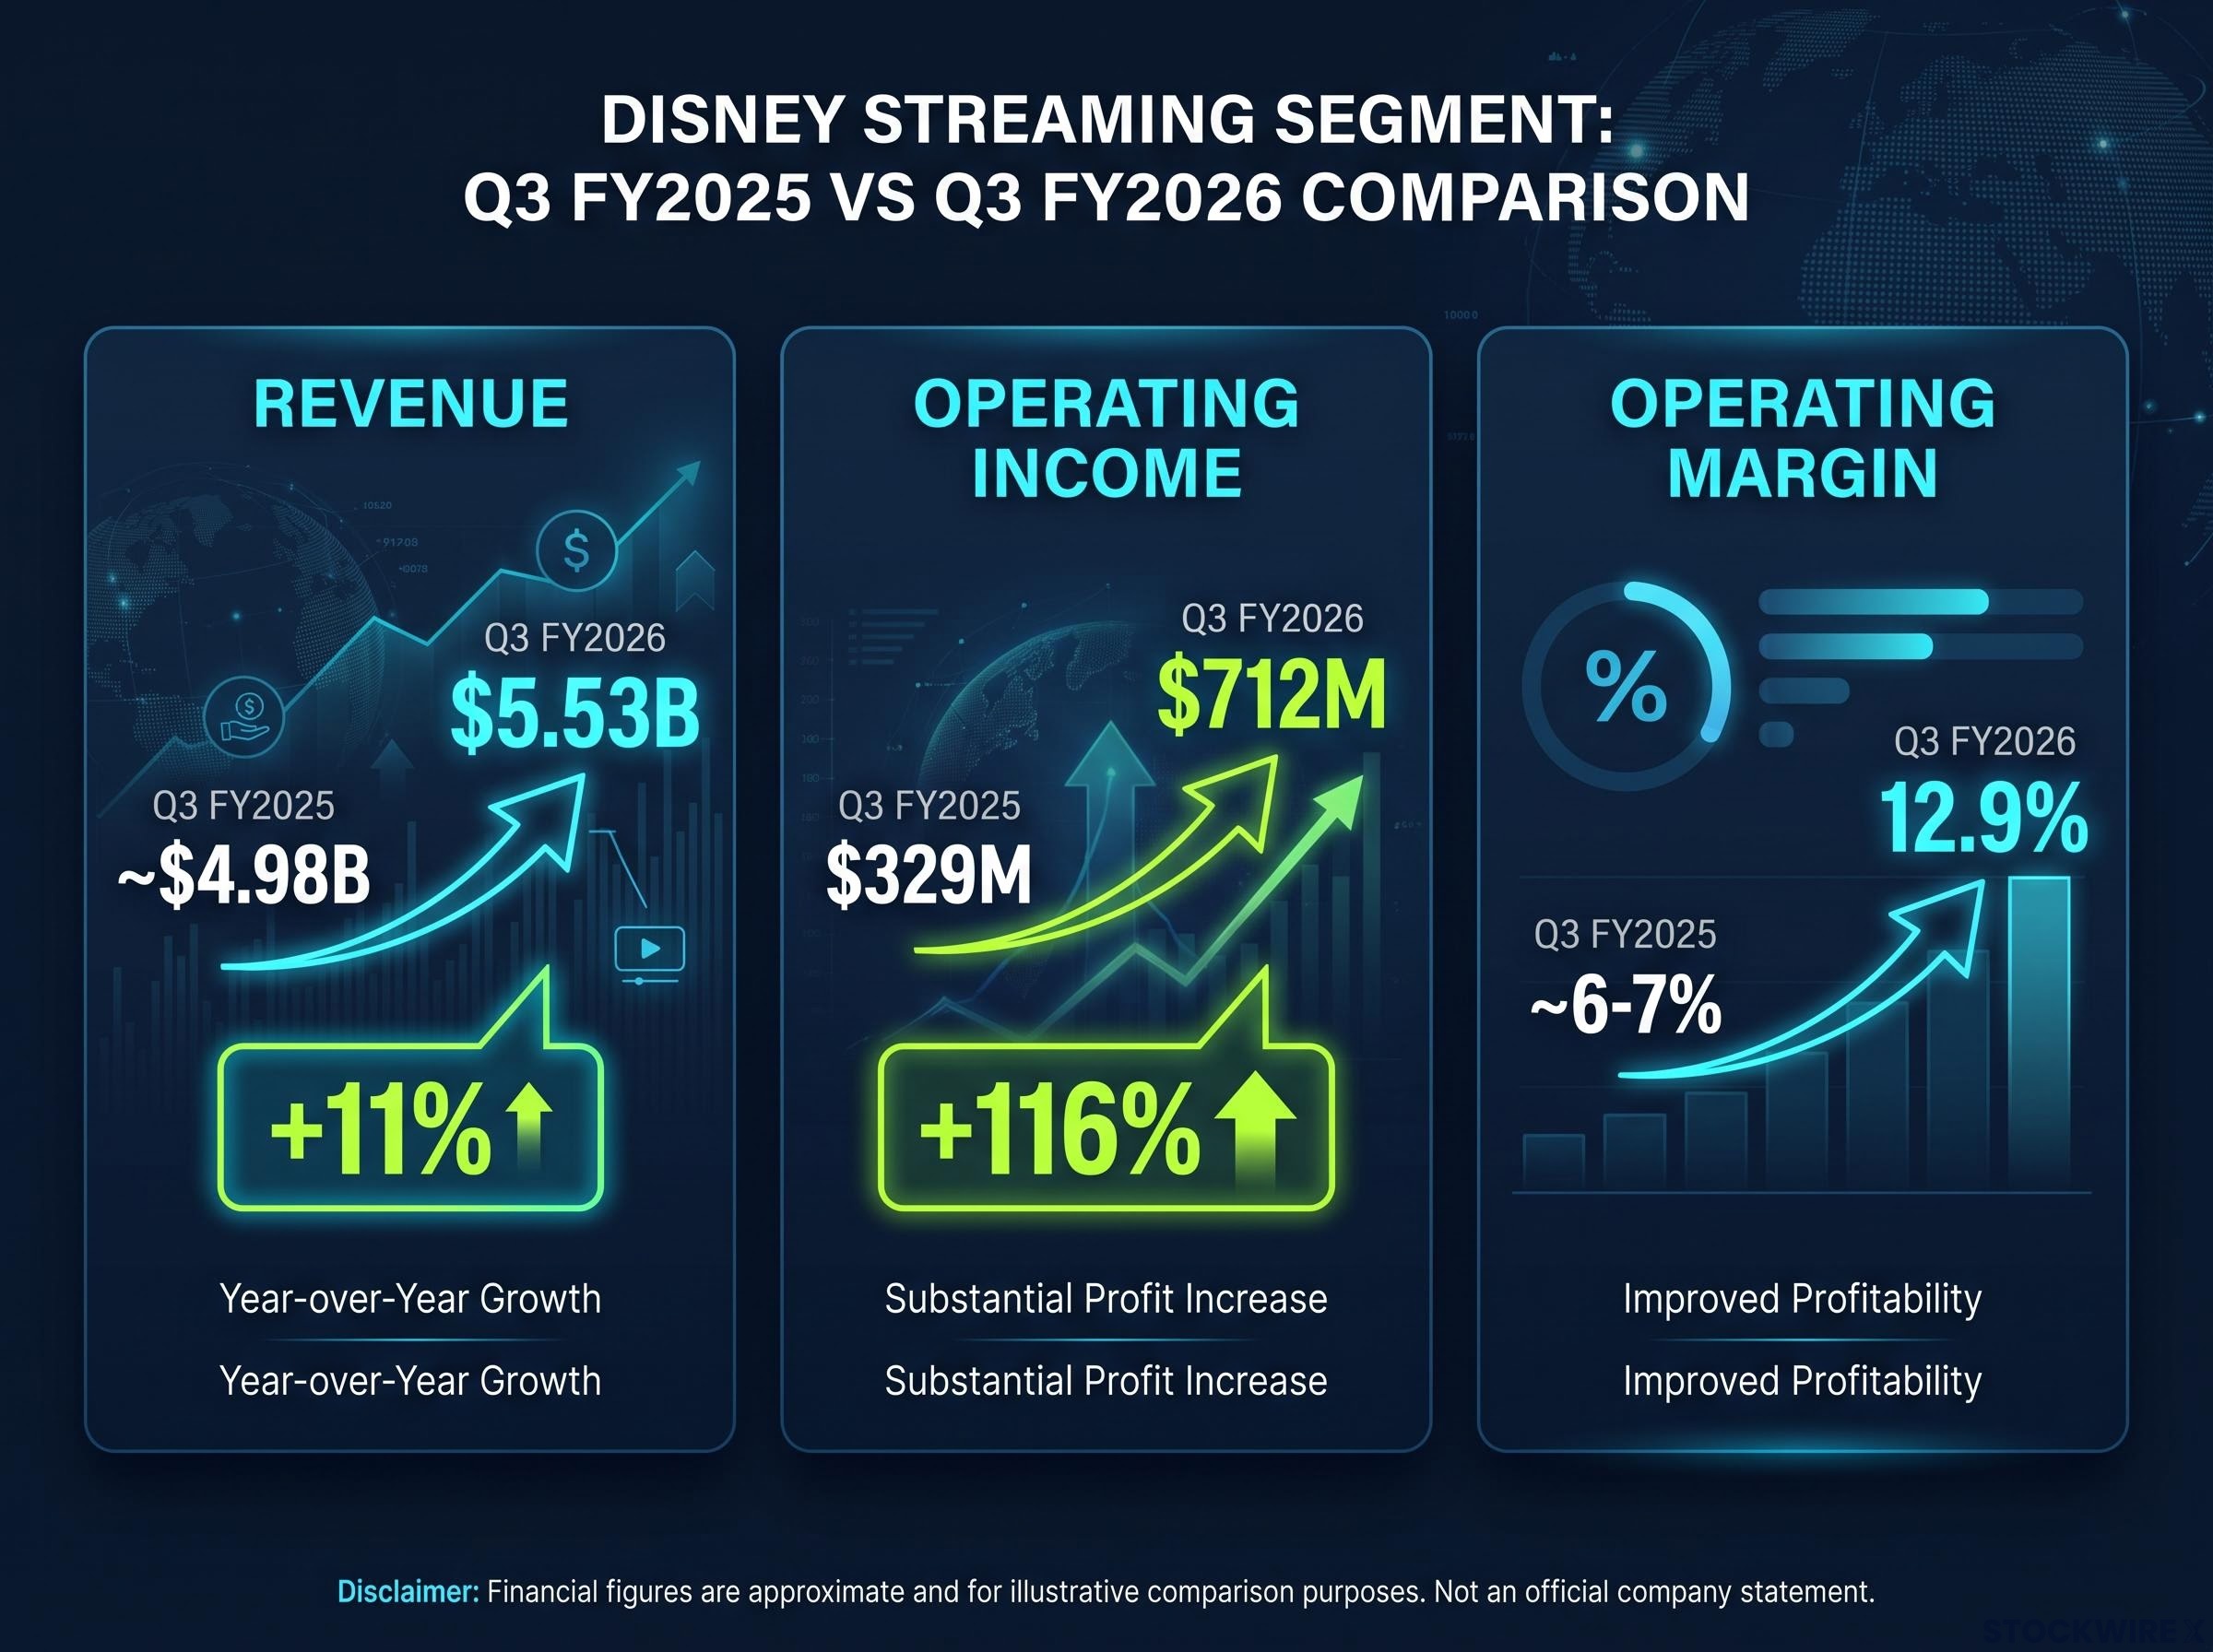
Key caution from management: Disney’s shareholder letter noted that the Q3 streaming margin was lifted, at least in part, by the phasing of marketing and programming expenditure across quarters. Full-year guidance calls for “double-digit” margins, a deliberate anchor set below Q3’s actual result.
That guidance language matters. Management is telling you not to treat 12.9% as the new floor.
When big ASX news breaks, our subscribers know first
Which gains are structural and which are borrowed from future quarters
The distinction between durable improvement and quarterly timing is not a technicality. It determines whether a future margin dip is a warning sign or an expected normalisation. These are two separate categories, and holding them apart is how you avoid a false alarm.
Structural drivers with staying power
The gains most likely to persist are rooted in the platform’s maturity:
- Operating leverage on a scaled platform: Disney’s streaming tech stack is built, its content pipeline is established, and its subscriber base is large. Incremental revenue now drops to the bottom line at a higher margin than during the heavy investment years.
- Price increases with manageable churn: Higher effective subscription rates and reduced subscriber turnover both contributed to the profit improvement, and neither is a one-quarter phenomenon.
- Cost discipline: Content and operating expense growth running at 4% while revenue grows at 11% is not accidental. It reflects tighter spending control and more selective content investment.
Timing-driven factors that will normalise
- Expense recognition shifted between quarters: Management explicitly acknowledged that some marketing and programming spend that could have reduced Q3 margins was recognised in other quarters. This is a normal media-business practice, but it means Q3’s margin sits above the true steady-state level.
- Full-year “double-digit” guidance as the company’s own implied correction: By guiding to double-digit margins for the full fiscal year rather than a sustained 13%+ quarterly rate, management is signalling its own view of where the business actually runs.
The practical read for an investor is this: if Q4 streaming margins come in at, say, 9-10%, that should not register as a deterioration. It should register as the timing effect normalising on schedule. Morningstar analyst Matthew Dolgin assessed Q3 as strong but above the true steady-state level, consistent with this framing. Investors who conflate timing with structural improvement set themselves up for a false negative signal when margins moderate, potentially selling a position in a business performing exactly as expected.
Morningstar’s Q3 FY2026 Disney earnings analysis, published by Matthew Dolgin on 5 August 2026, confirmed the streaming operating margin nearly doubled to 12.9%, while characterising the result as strong but above the true steady-state level the business can sustain on a consistent quarterly basis.
How operating leverage keeps profit growing even as revenue growth slows
Operating leverage is the mechanism that explains why a streaming business growing revenue at 6-8% annually can still compound operating income at a double-digit rate. The concept is straightforward: when a business has a large base of fixed and semi-fixed costs (the technology platform, the existing content library, the distribution infrastructure), each incremental dollar of revenue costs less to generate than the average dollar. So the margin on incremental revenue is higher than the blended margin on total revenue.
Here is the arithmetic, grounded in Q3’s actual numbers:
- Revenue grows at 7% annually. From a $5.53 billion quarterly base, that is meaningful absolute growth.
- Costs grow at 4% annually. Content and operating expenses expand, but at a slower pace.
- Operating income grows at approximately 12-13% annually. The spread between revenue and cost growth compounds into a double-digit profit growth rate, even from a starting margin in the low teens.
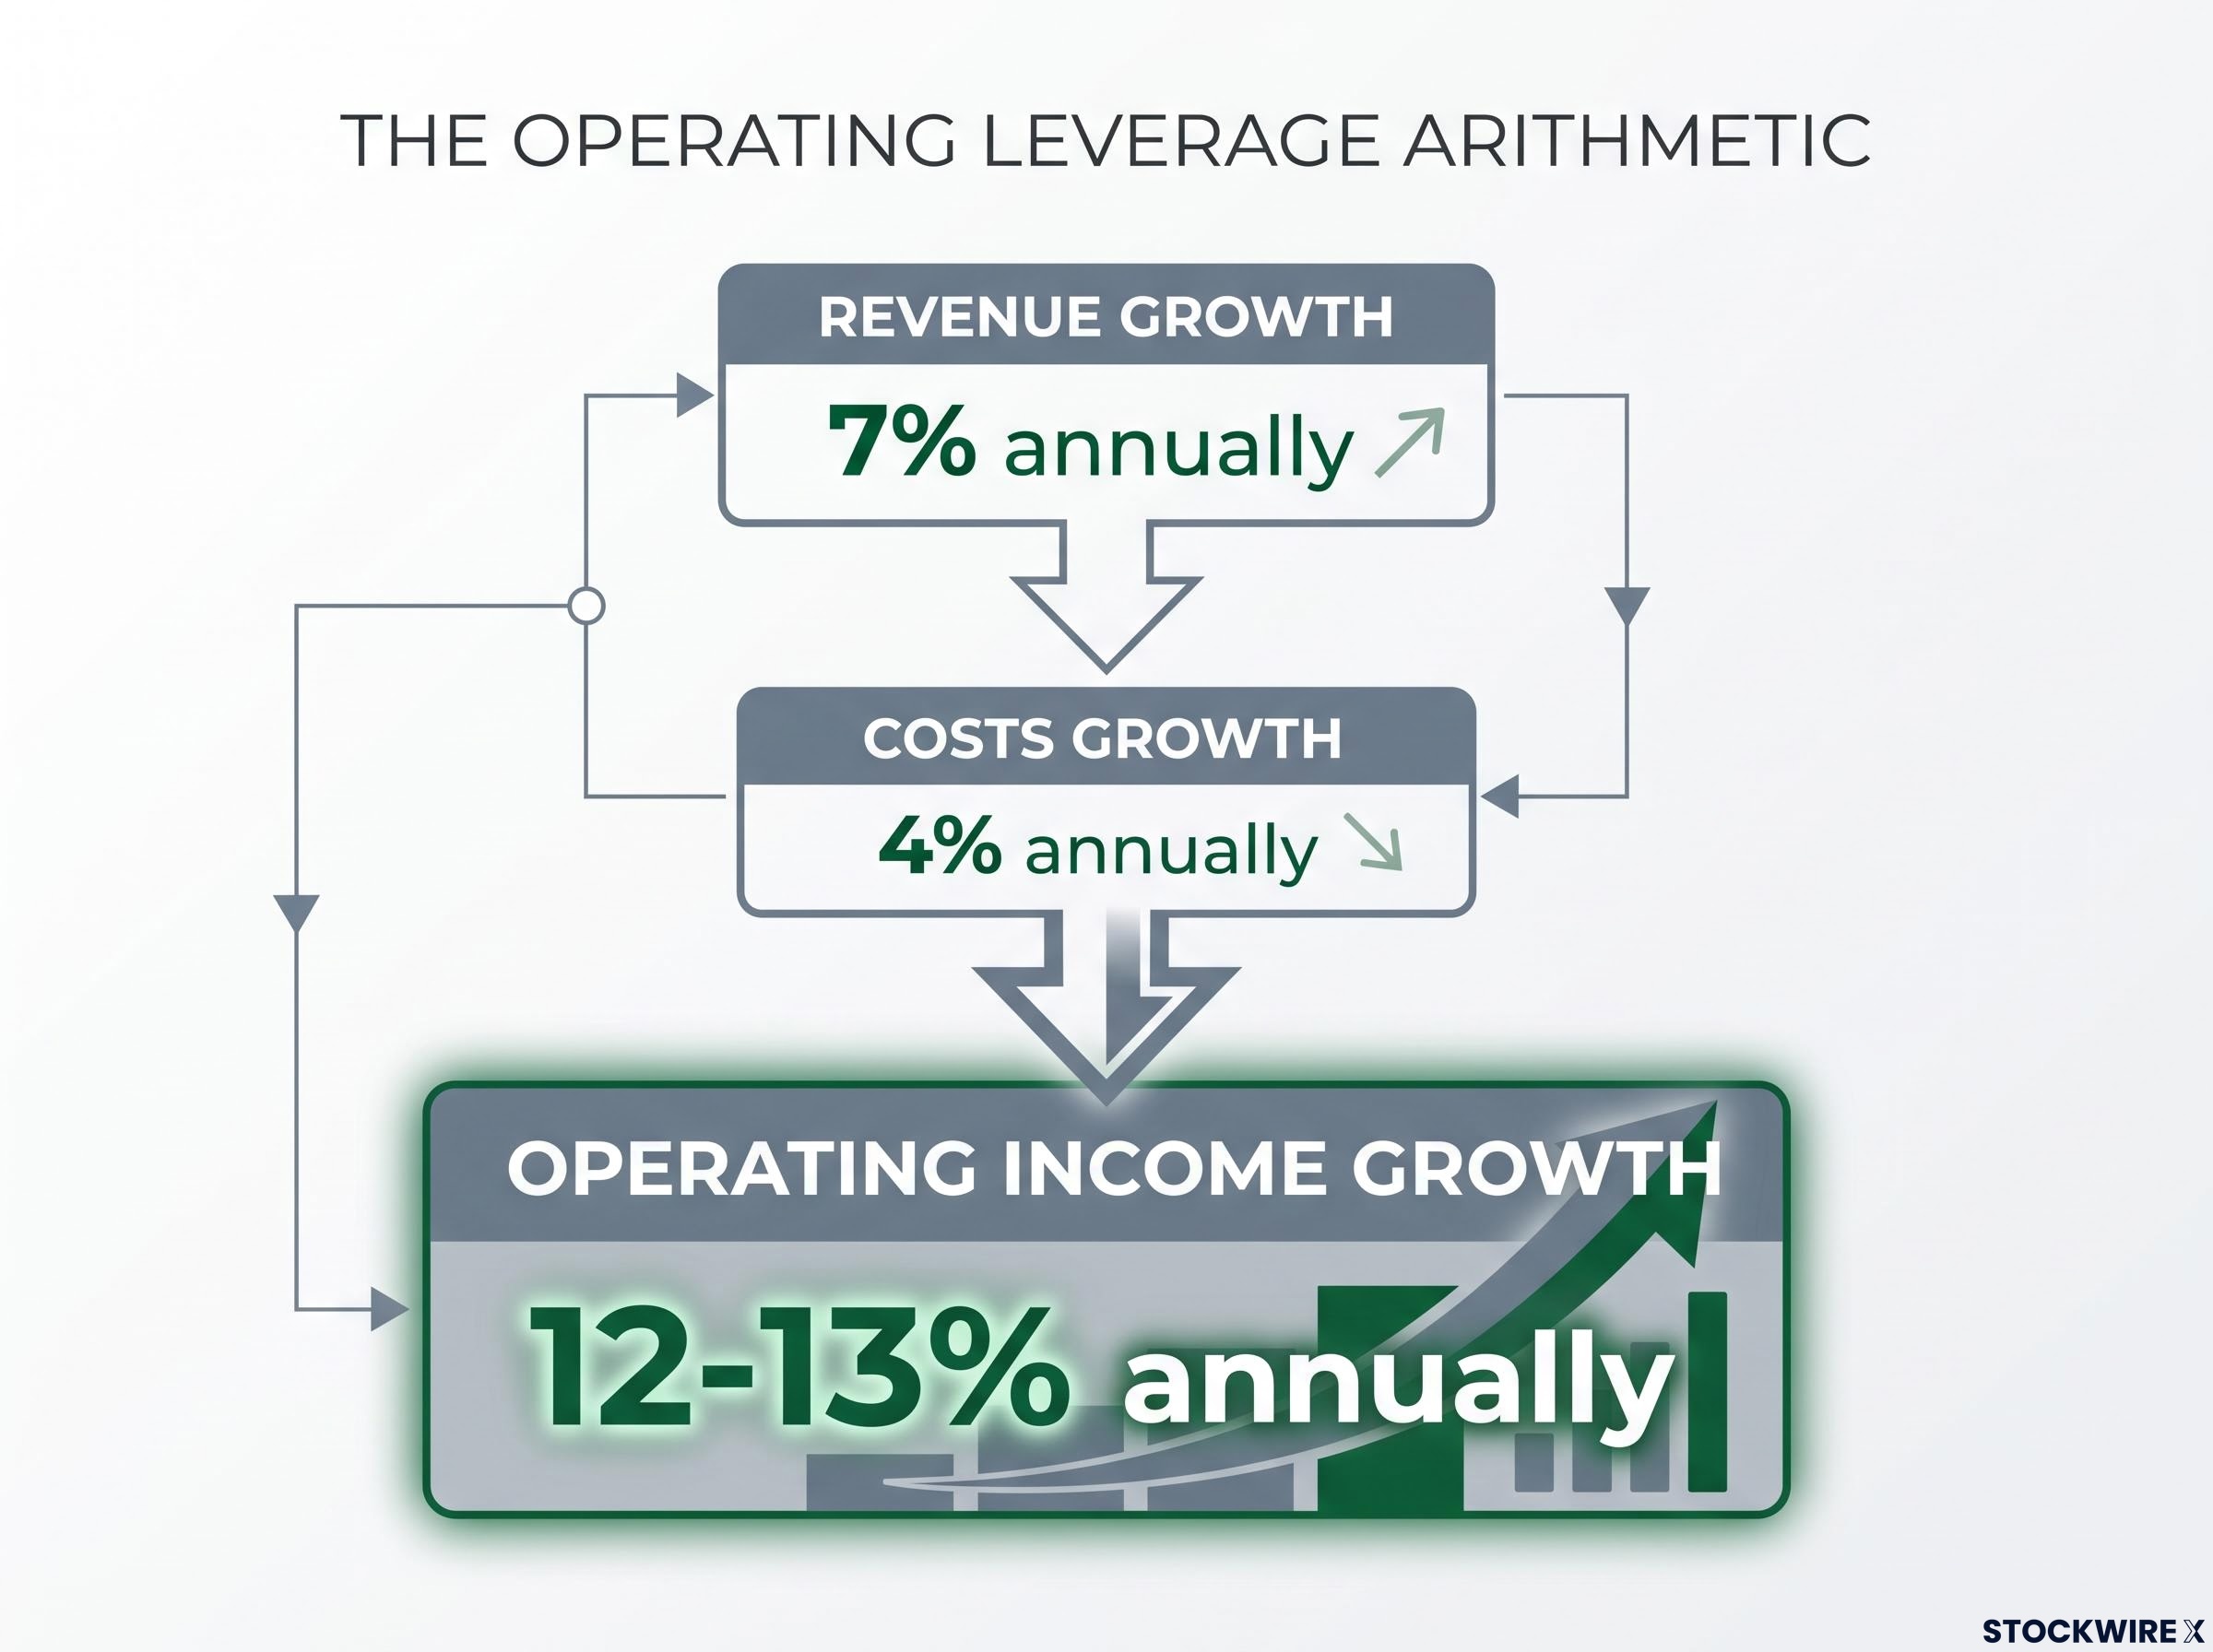
Q3 FY2026 demonstrated this in real time. Expenses up 4%, revenue up 11%, and margins expanded from the mid-single digits to the low teens in a single year.
The same operating leverage dynamic is visible across the broader streaming sector: Netflix’s recent share price reset illustrates how streaming valuation can diverge sharply from underlying business performance when growth expectations decelerate, even as free cash flow reaches record levels.
Morningstar’s projection: According to Morningstar analyst Matthew Dolgin, sustained cost discipline combined with operating leverage on modest revenue gains could allow Disney’s streaming operating profit to grow at an average double-digit rate across the next 5 to 10 years.
That projection is not a heroic assumption. It is the logical output of the arithmetic above applied over a multi-year horizon. For an investor with a 5-year holding period, this matters because a business compounding operating income at 10-12% annually, even with modest revenue growth, is worth a materially different valuation multiple than one assessed purely on near-term revenue momentum.
This article is for informational purposes only and should not be considered financial advice. Investors should conduct their own research and consult with financial professionals before making investment decisions.
What Disney’s platform strategy adds to the profitability case
The mechanical profit story is strong on its own. The strategic layer reinforces it, though its near-term contribution is harder to quantify.
Three platform moves matter most:
- Disney+ and Hulu integration: Combining family content, premium franchises, and general entertainment into a single offering gives subscribers more reasons to stay, improving lifetime value per customer. Industry data consistently shows that bundled services experience lower churn than standalone ones.
- Personalisation as a revenue lever: More accurate recommendations increase engagement and make ad inventory more valuable. Q3 already showed ad impressions up 8% despite broader ad rate pressure; better personalisation is one mechanism that could eventually convert impression growth into pricing power.
- Capital-efficient content partnerships: Arrangements with Fox, the CW, and TikTok allow Disney to enhance its platform’s content breadth without bearing full production costs. This reinforces the cost-discipline thesis by expanding the value proposition while keeping expense growth contained.
These strategic moves are not priced separately in the Q3 result. But they represent the mechanisms that could push the operating margin from the low teens toward the mid-teens over the next several years if execution holds. What this tells you as an investor is to watch ARPU (average revenue per user, meaning the average revenue Disney earns from each subscriber) and churn data over the next four to eight quarters. That is where the impact of these moves will become incrementally visible.
The metrics that will tell you whether the thesis is holding
The analysis above builds a case for durable, compounding profit growth. But a case is only useful if you know how to stress-test it against incoming data. Here are the five metrics that will tell you whether the thesis is playing out or breaking down.
| Metric | What to Watch For | Bullish Signal | Bearish Signal |
|---|---|---|---|
| Streaming Operating Margin | Stabilisation after Q3’s elevated print | Holds in the low teens on a full-year basis | Slips back to high single digits, suggesting the timing unwind was larger than expected |
| Revenue vs. Cost Growth Spread | Sustained positive gap confirming operating leverage | Revenue growth continues to outpace cost growth by 3+ percentage points | Spread compresses or inverts, signalling cost discipline is eroding |
| ARPU Trajectory | Continued improvement from price increases, tier mix, and ad monetisation | ARPU rises without meaningful churn acceleration | ARPU flattens or churn offsets price gains |
| Churn and Retention | Improvement as integration and personalisation mature | Retention rates improve as bundled offering deepens | Churn rises despite integration efforts |
| Advertising Trends | Pricing recovery on top of impression growth | Ad rates stabilise or improve alongside continued impression growth | Ad rates continue declining and impression growth stalls |
This framework gives you a way to distinguish between a business performing as expected and one where the investment thesis is actually breaking down. A single quarter’s margin dip is not a signal. A pattern across three or four of these metrics moving in the wrong direction at the same time is.
The five-metric monitoring framework is designed to identify thesis-level deterioration in Disney’s business, but investors holding the stock through a multi-year horizon should also be aware of market structure risks, including the amplification effects that geared ETF rebalancing can introduce during broad equity selloffs, which can disconnect price from fundamental performance for extended periods.
Past performance does not guarantee future results. Financial projections are subject to market conditions and various risk factors.
What the durability question actually comes down to
Disney streaming is no longer a turnaround story. It is past the loss-making build-out phase, generating real operating income, and exhibiting the kind of operating leverage that compounds meaningfully over time. But it is not a hypergrowth story either. Morningstar’s view is that no mature platform at this scale can be expected to sustain double-digit revenue growth indefinitely.
The honest conclusion is that this is a compounding business. Q3’s 12.9% margin demonstrated the operating-leverage mechanism working in real time, but it is not a permanent new floor. Management’s own guidance, along with independent analysis from Morningstar’s Matthew Dolgin, both point to the same realistic long-term profile:
- Revenue growth: Mid- to high-single digits annually
- Operating margin: Anchored in the low teens
- Operating income growth: Sustained average growth in the low double digits across a 5-10 year horizon
Whether that profile is attractive depends entirely on the price you are paying and the time horizon you are applying. This is a story relevant to investors with a 5-year or longer view, not a near-term catalyst trade. The next four to eight quarters will tell you whether the structural thesis is holding or whether Q3 was the high-water mark. The metrics above give you the framework to tell the difference.
Investors wanting to apply this compounding framework beyond a single stock will find our deep-dive into long-term wealth accumulation principles covers the mechanics of equity compounding across 10-20 year horizons, including how tax-sheltered structures amplify every percentage point of sustained return.
These statements are speculative and subject to change based on market developments and company performance.