
Westpac posted A$1.8 billion in quarterly profit, up roughly 3% on the first-half average, and the headline looked fine. Then the stock fell as much as 4.8% intraday on 10 August 2026, dragging the S&P/ASX 200 Financials index down 2.2% in morning trade. The number that moved markets was not on the profit line.
The Big Four bank reporting season is now live. Commonwealth Bank releases its full-year result on 12 August, ANZ is scheduled to provide a quarterly update on 13 August, and NAB wraps up the week on 17 August. Westpac’s Q3 FY2026 disclosure landed first, and it has immediately reframed what investors should be scrutinising across every subsequent result.
Here is what the Westpac numbers actually revealed, why the market reacted the way it did, and the specific signals worth tracking when the other three banks report.
The number that spooked markets: Westpac’s mortgage application data
Average monthly application volumes were down 11% quarter-on-quarter, with the post-budget run rate sitting roughly 20% below prior-quarter levels. Breaking that down by borrower type, the investor segment contracted 26% after the budget, while owner-occupier volumes pulled back 18%.
Mortgage application declines, Westpac Q3 FY2026: Sequential decline: -11%. Post-budget decline: approximately -20%. Investor segment: -26%. Owner-occupier segment: -18%.
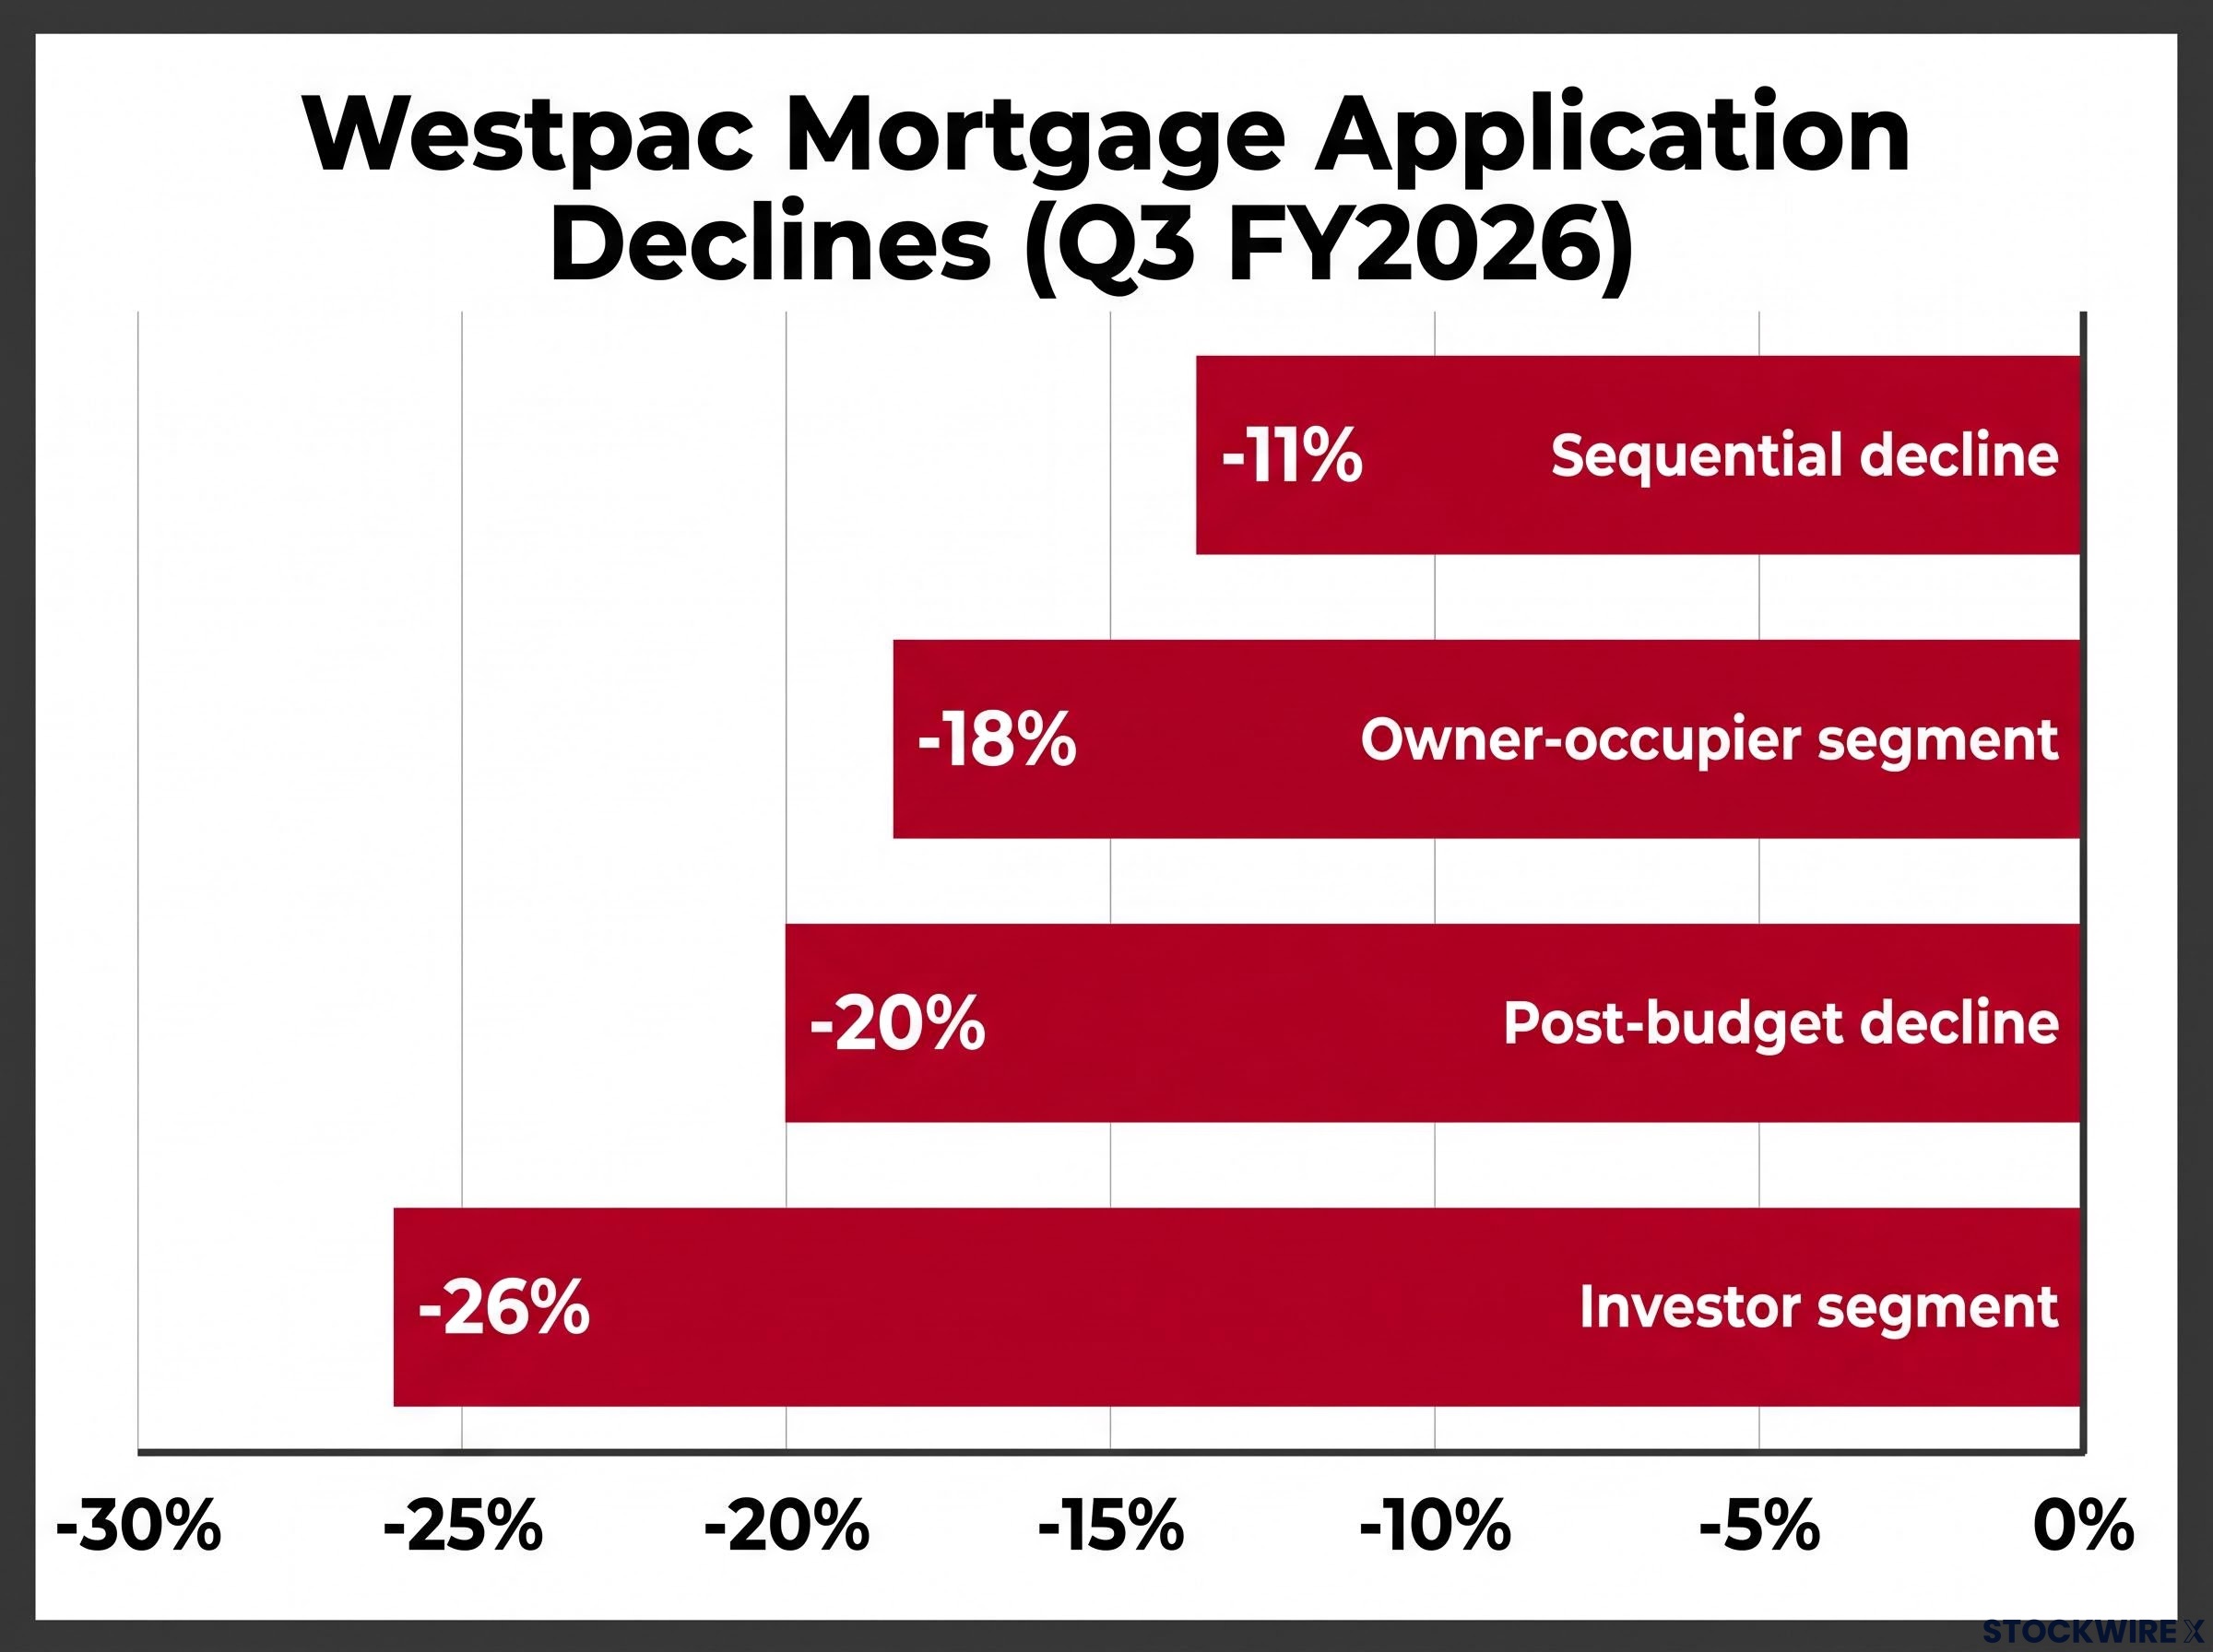
Those figures landed before anyone had time to digest the profit number. Statutory net profit came in at A$1.8 billion, and net operating income reached A$5.7 billion, up 1% quarter-on-quarter. Both were steady. Neither mattered as much as the pipeline data.
Westpac’s own housing credit growth forecast spells out the trajectory: 6.8% in FY26, slowing to 4.7% in FY27 and 5.2% in FY28. A bank with a shrinking mortgage pipeline has a structural earnings headwind regardless of how solid this quarter’s profit looks. The application data tells you that the future loan book is already contracting, and that is what the market priced on Monday morning.
Westpac’s mortgage concentration has been a structural earnings quality concern since its H1 FY26 result, when the 69% residential mortgage weighting amplified sensitivity to any softening in housing credit growth and left the bank more exposed than peers to the precise pipeline signals now moving its share price.
When big ASX news breaks, our subscribers know first
What Westpac’s provisioning posture is really signalling
On the surface, credit quality is benign. The quarterly impairment charge held at 10 basis points, consistent with recent trends. Stressed exposures sat at 1.19% of the portfolio. Ninety-plus day mortgage delinquencies came in at 1.14%. None of those figures suggest distress.
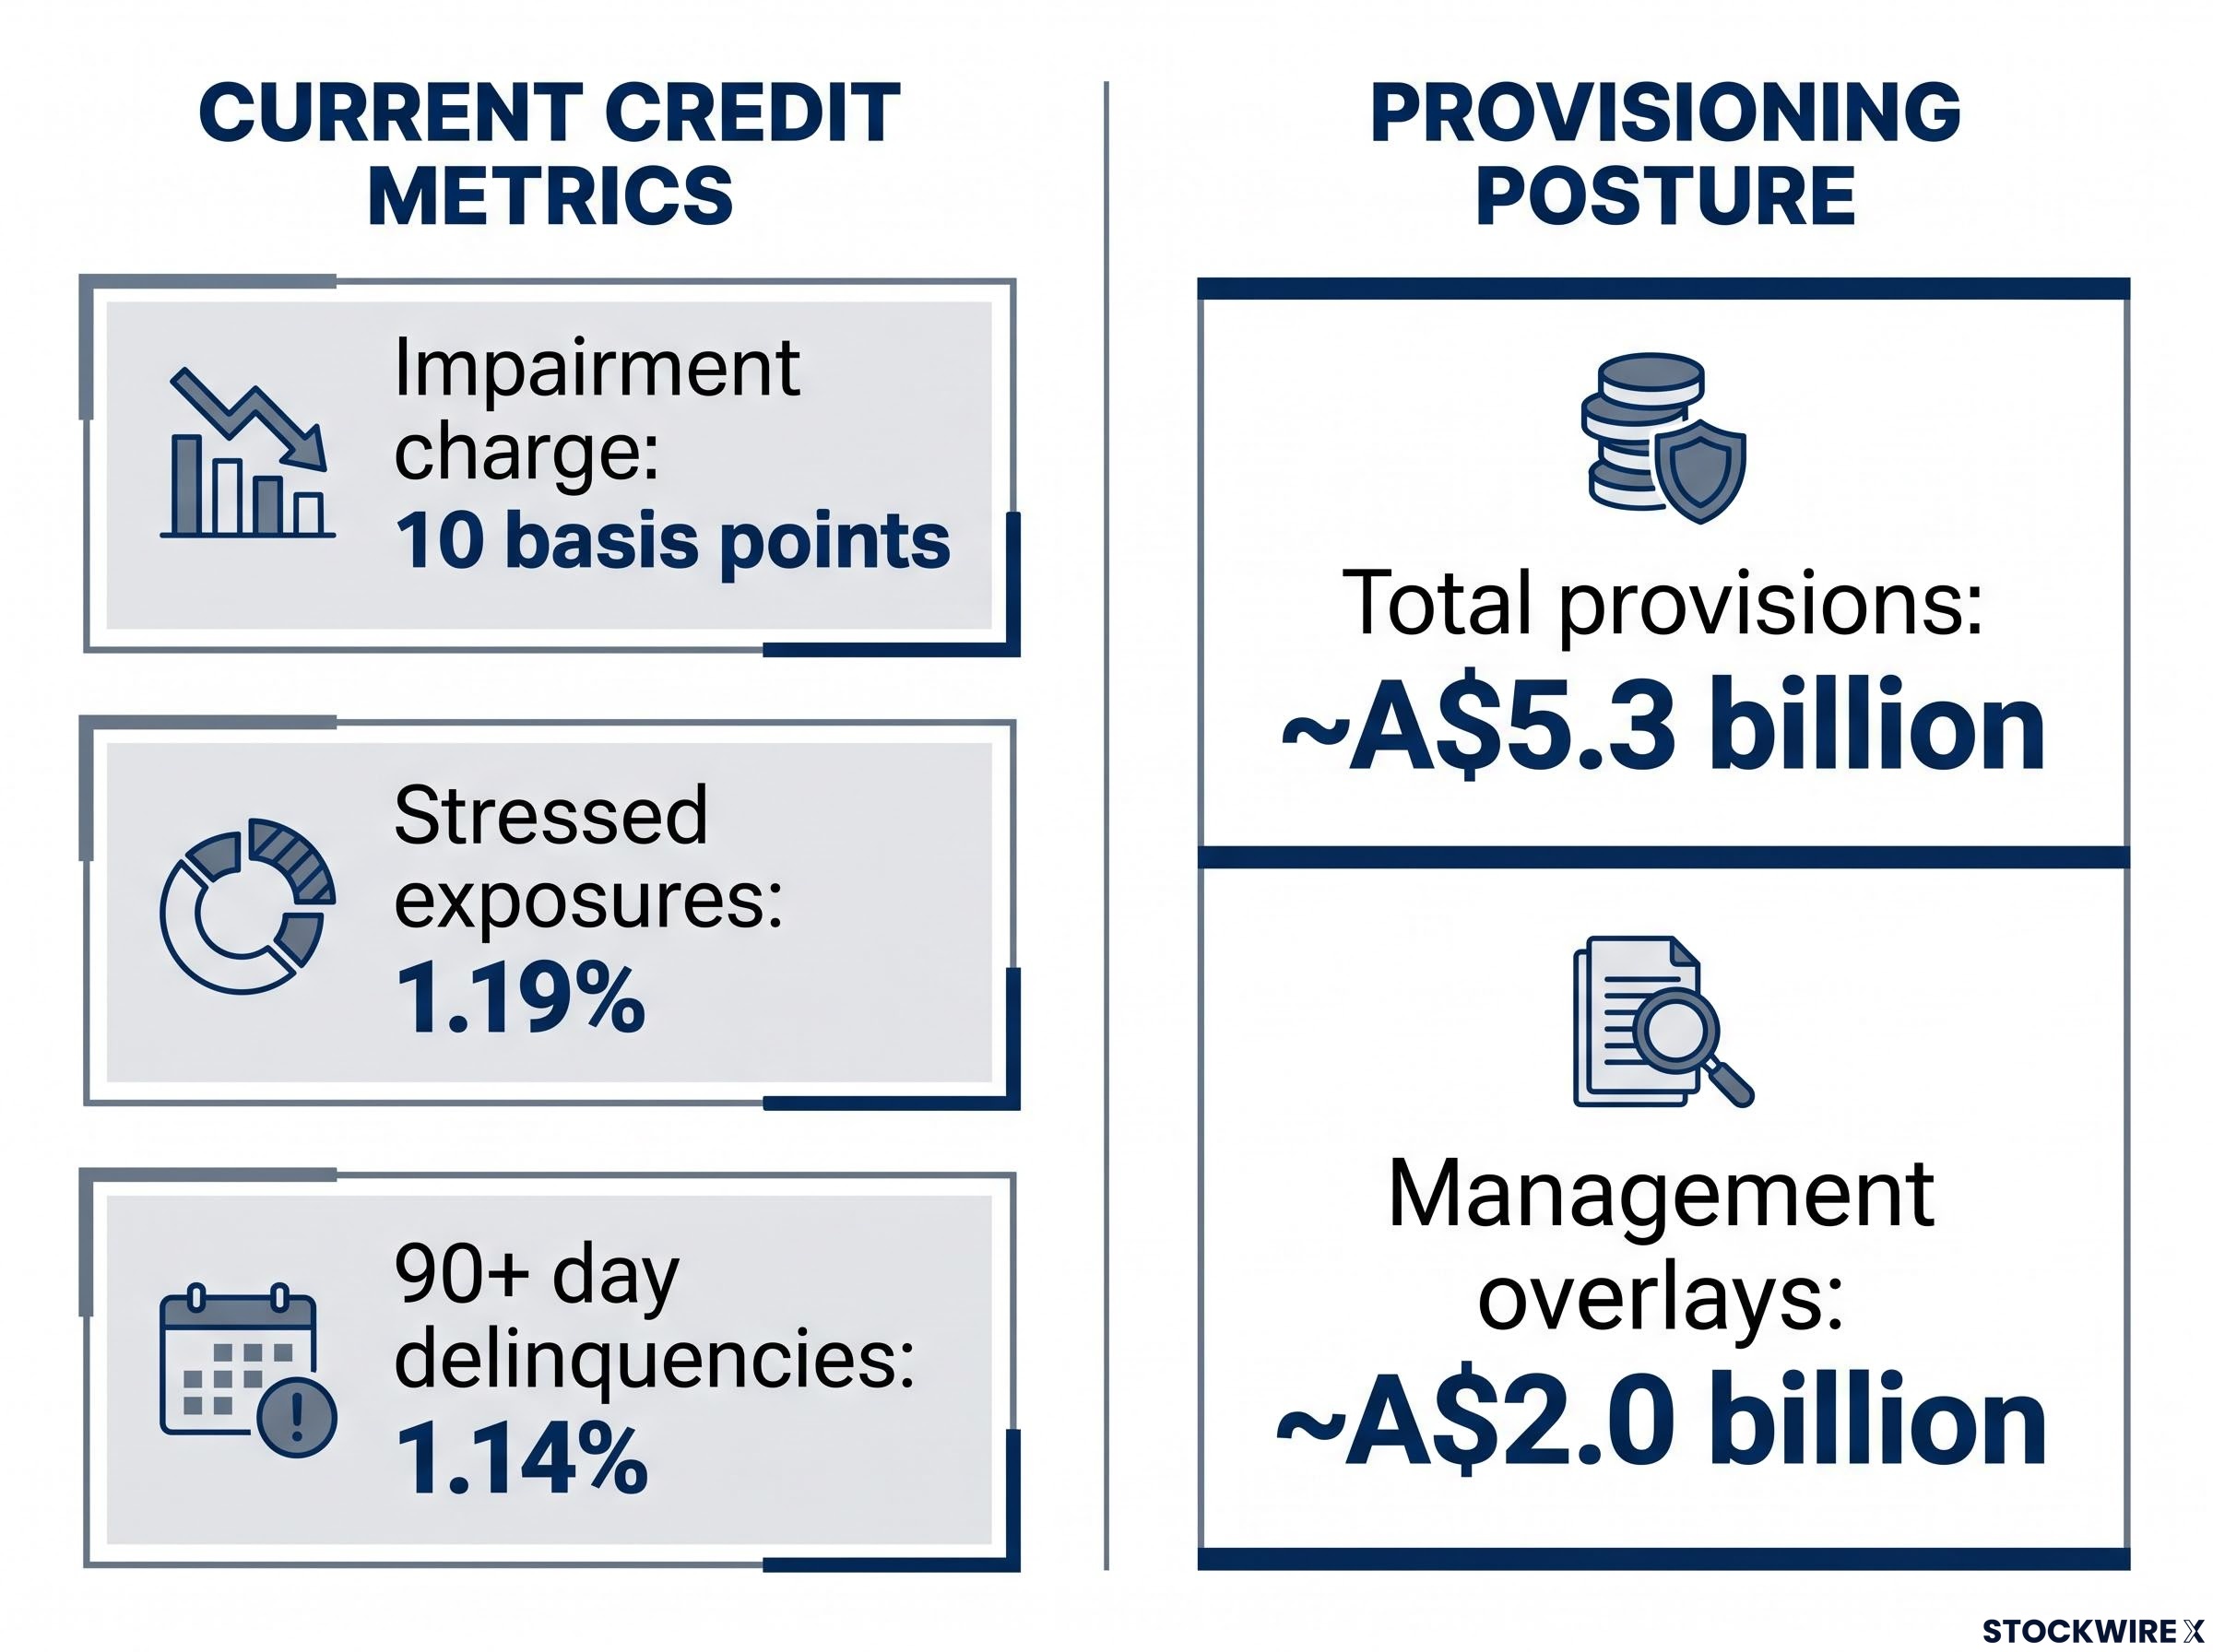
| Credit Quality Metric | Westpac Q3 FY2026 Value |
|---|---|
| Impairment charge | 10 basis points |
| Stressed exposures | 1.19% of portfolio |
| 90+ day mortgage delinquencies | 1.14% |
| Total provisions | ~A$5.3 billion (58 bps of gross loans) |
| Management overlays | ~A$2.0 billion above base-case |
The provisioning story, however, is entirely about what management sees ahead.
Why management overlays matter more than the headline impairment number
Overlays sit above the model-driven provision base. They represent a deliberate management judgment call, a buffer built not because the models demand it, but because the executive team believes the models may be understating risk.
Westpac made three distinct choices this quarter. It lifted management overlays to approximately A$2.0 billion above the base-case scenario. It toughened the downside economic scenario used in its provisioning models. And it introduced a new specific overlay linked to discretionary consumer spending.
CFO Nathan Goonan described the new discretionary spending buffer as a cautious response to the shifts he is observing in how consumers are behaving, with the bank pointing to softening household expenditure patterns as its justification. When a bank builds overlays and hardens its downside scenario while actual losses remain low, it is telling investors that management believes current conditions understate future risk. That forward signal carries more weight than any single delinquency figure.
The sector’s current provisioning posture did not emerge in isolation: May 2026 reporting season saw the Big Four collectively add approximately $800 million in loan loss provisions and record NIM misses driven by deposit competition and mortgage refinancing pressure, establishing the cautious management mindset that Westpac’s new consumer spending overlay extends into Q3.
How Australian bank reporting season works (and why this year is different)
The Big Four banks stagger their results across August. They do not all report on the same day, and they do not all report the same type of result. Understanding the difference matters.
A quarterly trading update, which is what Westpac and ANZ deliver, provides headline profit, margin, and credit quality data but limited granular detail. A full-year result, which is what CBA releases, comes with audited accounts, divisional breakdowns, and more extensive forward guidance. CBA’s 12 August disclosure will carry substantially more detail than any of the quarterly updates.
The August 2026 schedule runs as follows:
- Westpac Q3 FY2026 update: 10 August 2026 (released at 8:30am AEST)
- Commonwealth Bank full-year result: 12 August 2026
- ANZ Q3 update: 13 August 2026
- NAB Q3 update: 17 August 2026
The first result of any reporting season sets the interpretive lens for everything that follows. That is particularly true when the first result contains sector-level signals rather than company-specific anomalies. Three banks in five days after Westpac means sentiment can shift quickly and compound, so entering each result with a clear framework matters more than reacting result by result.
What to watch when CBA, ANZ and NAB report
Westpac has raised four questions that the other three banks now need to answer. The table below sets out each watchpoint, Westpac’s baseline, and what a concerning reading would look like.
| Watchpoint | Westpac Q3 Baseline | What a Concerning Reading Looks Like |
|---|---|---|
| Mortgage applications | -11% sequential; -20% post-budget | Similar double-digit declines, particularly in investor segment |
| Net interest margin | Reported NIM 1.89% (stable); core NIM 1.78% (flat vs 1H, +1 bp in quarter) | Any sequential compression, or guidance flagging deposit competition intensifying |
| Provisioning and overlays | Overlays at ~A$2.0 billion above base-case; new consumer spending overlay introduced | Peer banks introducing similar segment-specific overlays or toughening downside scenarios |
| Credit quality | Stressed exposures 1.19%; 90+ day delinquencies 1.14% | Upward movement in either metric, particularly in unsecured consumer or small-business books |
Beyond the numbers, watch for qualitative signals:
- Management tone on consumer spending and cost-of-living pressures
- Forward guidance language shifting from “resilient” to “cautious” or “moderating”
- Any reference to post-budget behavioural changes in mortgage demand
CBA’s result will be the most telling. It holds the largest Australian mortgage book, and any sign of margin erosion or application softness in its flagship home lending would confirm that Westpac’s signals are sector-wide rather than company-specific. Westpac’s CET1 ratio of 12.1% (down from 12.4% in March) also provides a capital comparison anchor. If CBA and ANZ report materially similar application declines and overlay increases, the read should be confirmation of a sector-level trend, which would justify a more sustained re-rating across ASX financials.
What the sell-off reveals about where the sector cycle sits
In early trade, Westpac shares tumbled as much as 4.8%, touching A$36.10, before paring losses to close down approximately 1.5-1.6% at roughly A$37.93. Both figures are from the same session; the early-session move partially recovered by the bell.
Intraday vs closing move, 10 August 2026: Westpac shed 4.8% to reach an intraday low of A$36.10 before recovering to close at approximately A$37.93, a decline of roughly 1.5-1.6%. The stock’s 52-week range spans A$33.71 to A$43.32.
The partial recovery suggests the market is not in panic mode. But the S&P/ASX 200 Financials index recorded a 2.2% decline in morning trade, confirming investors are repricing the outlook across all Big Four names, not just Westpac.
The sector entered reporting season carrying premium ASX bank valuation multiples, with CBA trading near 27-28 times forward earnings against a long-run average of 18 times and the weighted sector price-to-fair-value sitting above 1.1 according to Morningstar, leaving little room for guidance that disappoints.
That distinction matters. The market reaction was not a verdict on current profitability. Loans and deposits both grew 2% in the quarter, with business and institutional lending coming in stronger. The reaction was a repricing of where the sector cycle sits. The transition underway is from rate-driven NIM tailwinds to a phase where volume growth and cost control carry more weight. Australian banks start that transition from a strong position: solid capital, low current credit losses, profitable operations. But the specific headwinds are now visible, and the market is pricing them in.
What the next five trading days will tell ASX financials investors
CBA on 12 August. ANZ on 13 August. NAB on 17 August. Three results in five trading days, each one an opportunity to either confirm or complicate the signals Westpac has delivered.
Two scenarios sit in front of the sector. If the other three banks echo Westpac’s mortgage softness and overlay increases, the sector de-rating is likely to deepen. The read would be structural: a sector-level mortgage slowdown and rising consumer caution, not an idiosyncratic Westpac issue. If they diverge, with healthier pipelines and less defensive provisioning, Westpac’s result may be re-read as company-specific.
The benchmark to track: Westpac’s economists forecast housing credit growth easing from 6.8% in FY26 down to 4.7% in FY27. Whether the other three banks confirm or contradict that trajectory is the single most consequential data point of this reporting season.
The housing credit growth outlook for the Big Four had already shifted materially before this reporting season, with Morgan Stanley projecting a potential 10% property price decline by end-2027 and forecasting mortgage growth decelerating from approximately 7.5% to 3-4%, a trajectory that maps directly onto Westpac’s own FY27 credit growth guidance of 4.7%.
The reporting season framework has already shifted. Headline profit is no longer the number that moves bank stocks. Forward indicators, mortgage pipelines, provisioning posture, consumer spending overlays, are where the signal lives. That shift is likely to persist well beyond August.
This article is for informational purposes only and should not be considered financial advice. Investors should conduct their own research and consult with financial professionals before making investment decisions. Forward-looking statements, including housing credit forecasts and margin projections, are subject to change based on market developments and company performance.