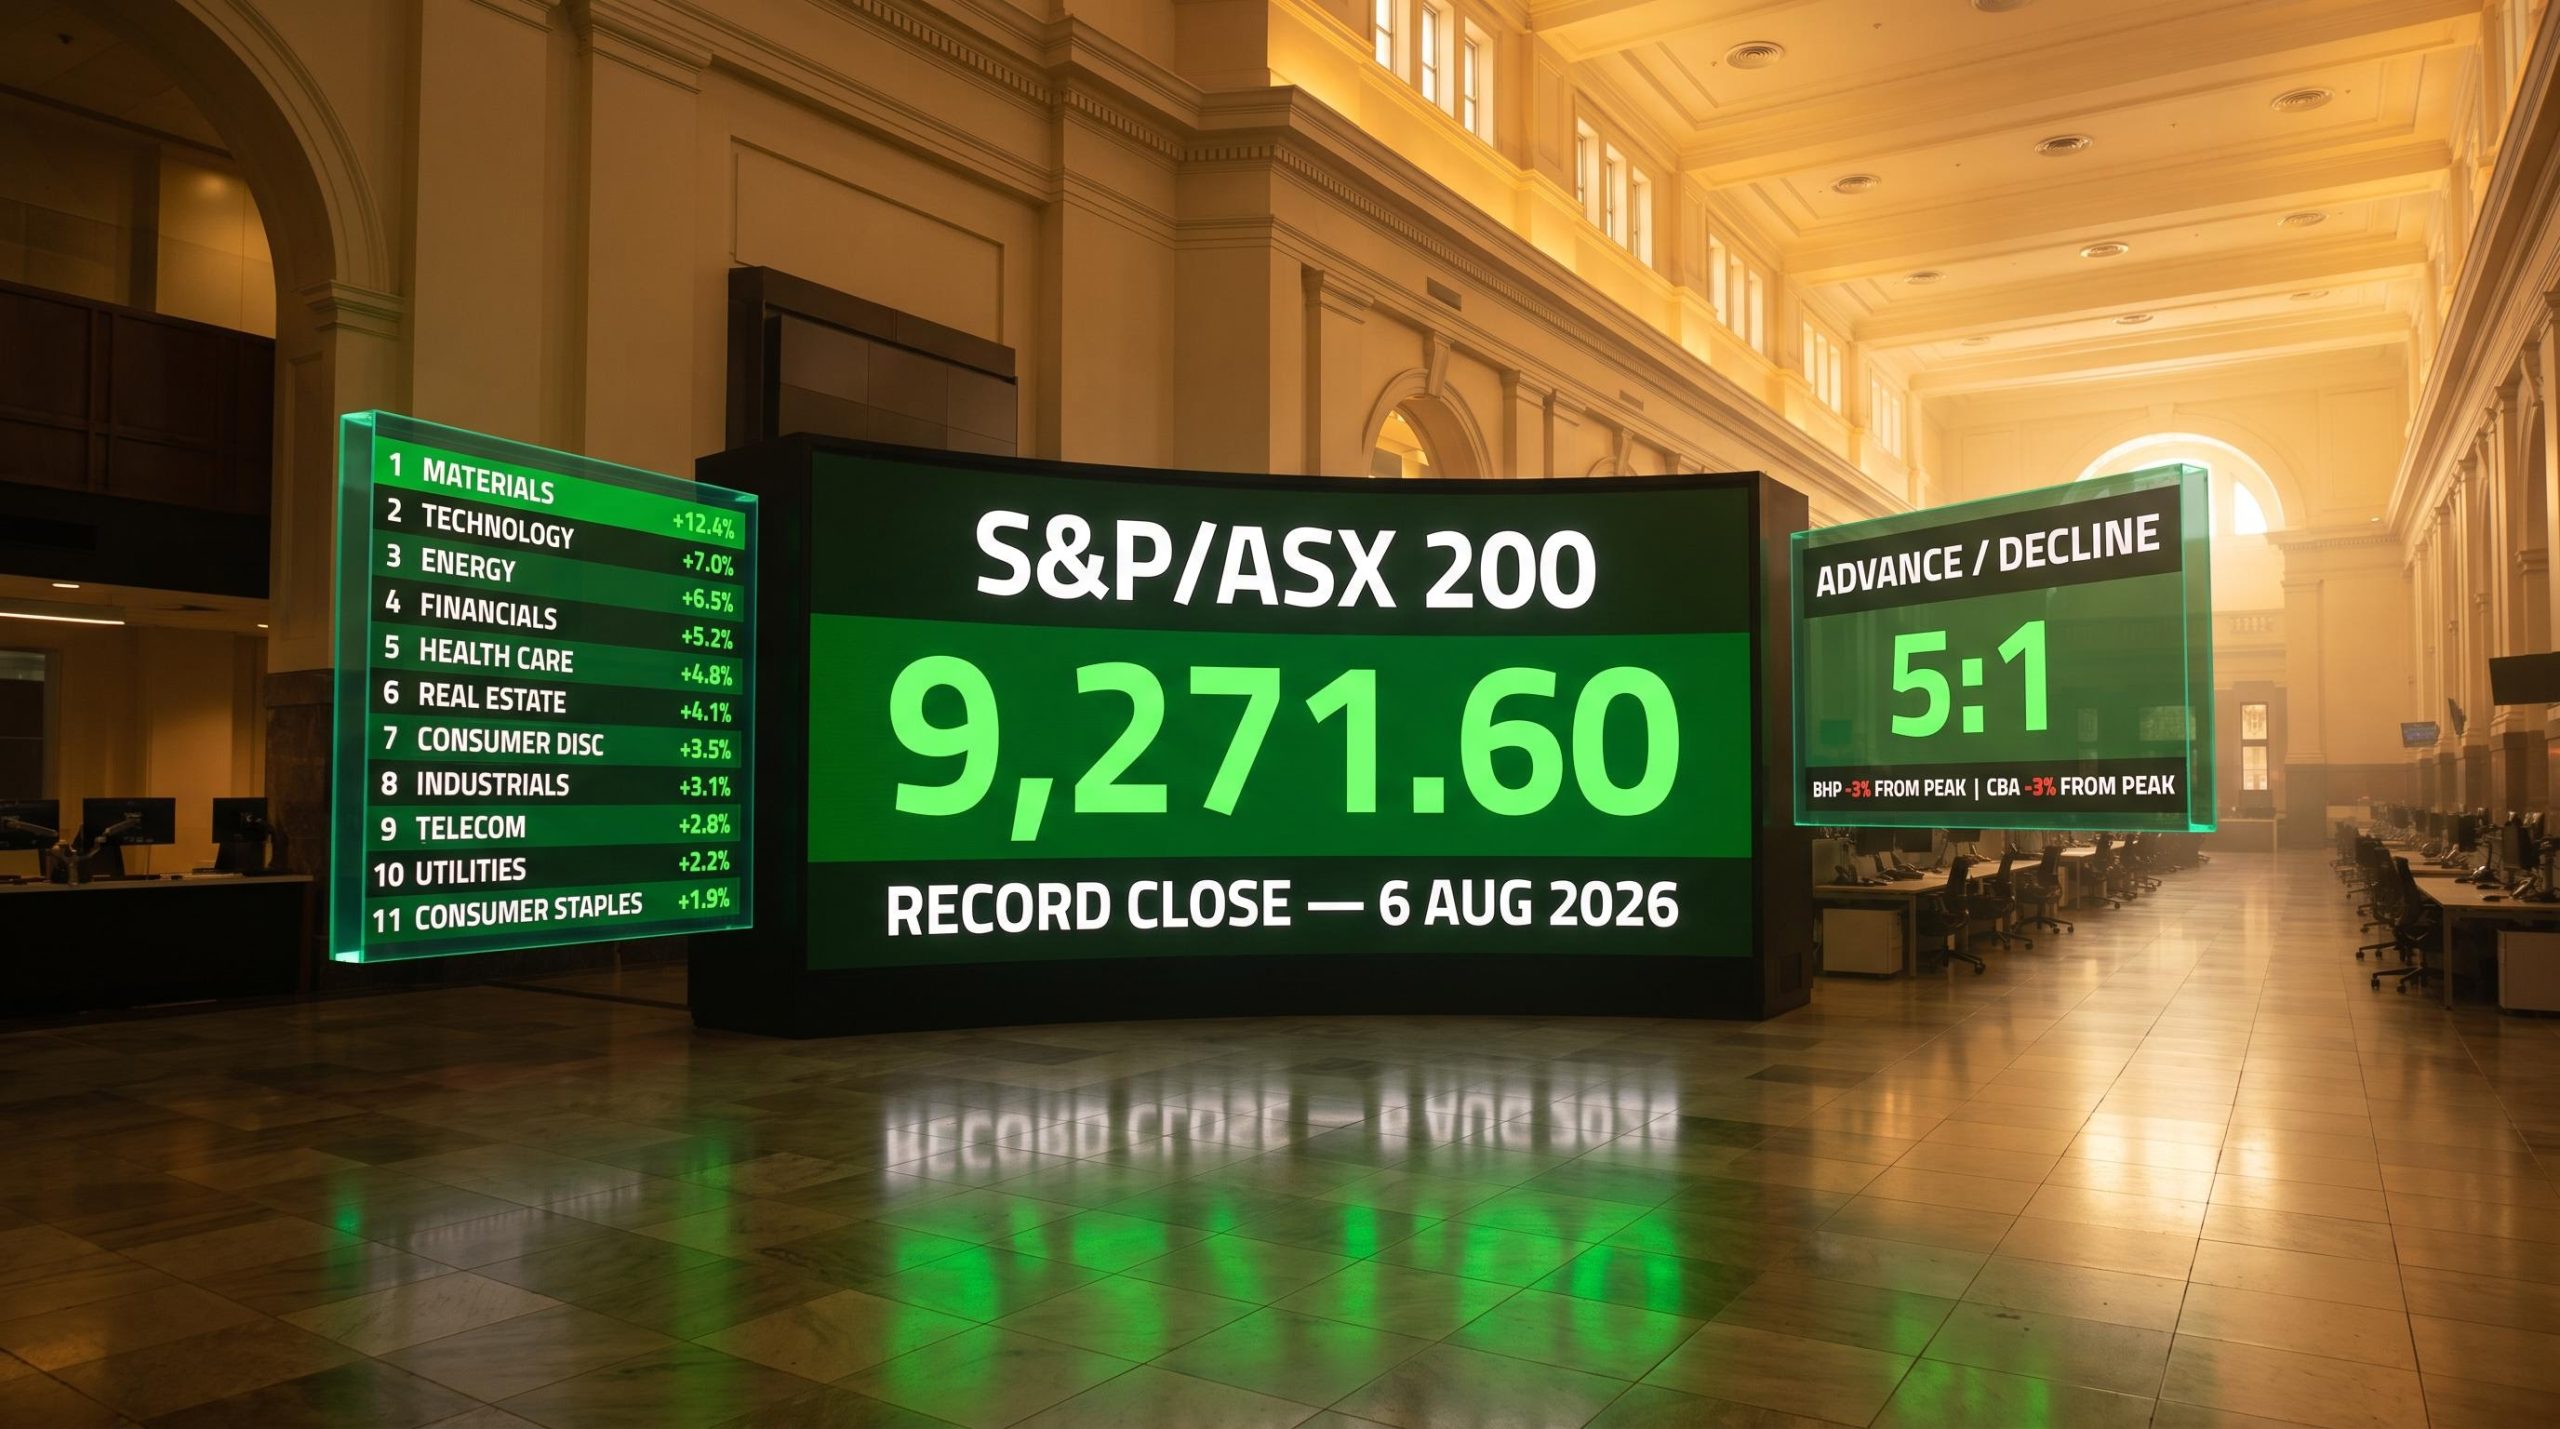
The S&P/ASX 200 closed at a record 9,271.60 on 6 August 2026, after touching an intraday peak of 9,296.70 during the same week. Those are the headline numbers. The structural story beneath them is more interesting: BHP and Commonwealth Bank, the two largest stocks in the index by market capitalisation, were both sitting roughly 3% below their own all-time highs while those records were being set.
That contradiction matters. The standard assumption for most Australian investors is that ASX records are a BHP-and-banks story, a commodity surge or a financial sector earnings pop lifting the whole index. This time, that assumption is wrong, and understanding why changes how you read the rally’s strength.
Here is what the sector data, breadth metrics, and mega-cap positioning actually tell you about whether this rally has genuine depth behind it, and what specific conditions need to hold for the index to sustain these levels.
Records confirmed, but the index heavyweights were not driving them
The index milestones arrived in quick succession:
- 5 August: Intraday record high of 9,230.00
- 6 August: Record closing high of 9,271.60
- Week of 5-7 August: Intraday peak of 9,296.70
Three records in a single week. Yet the two stocks that typically carry the most weight in any ASX 200 move were not leading.
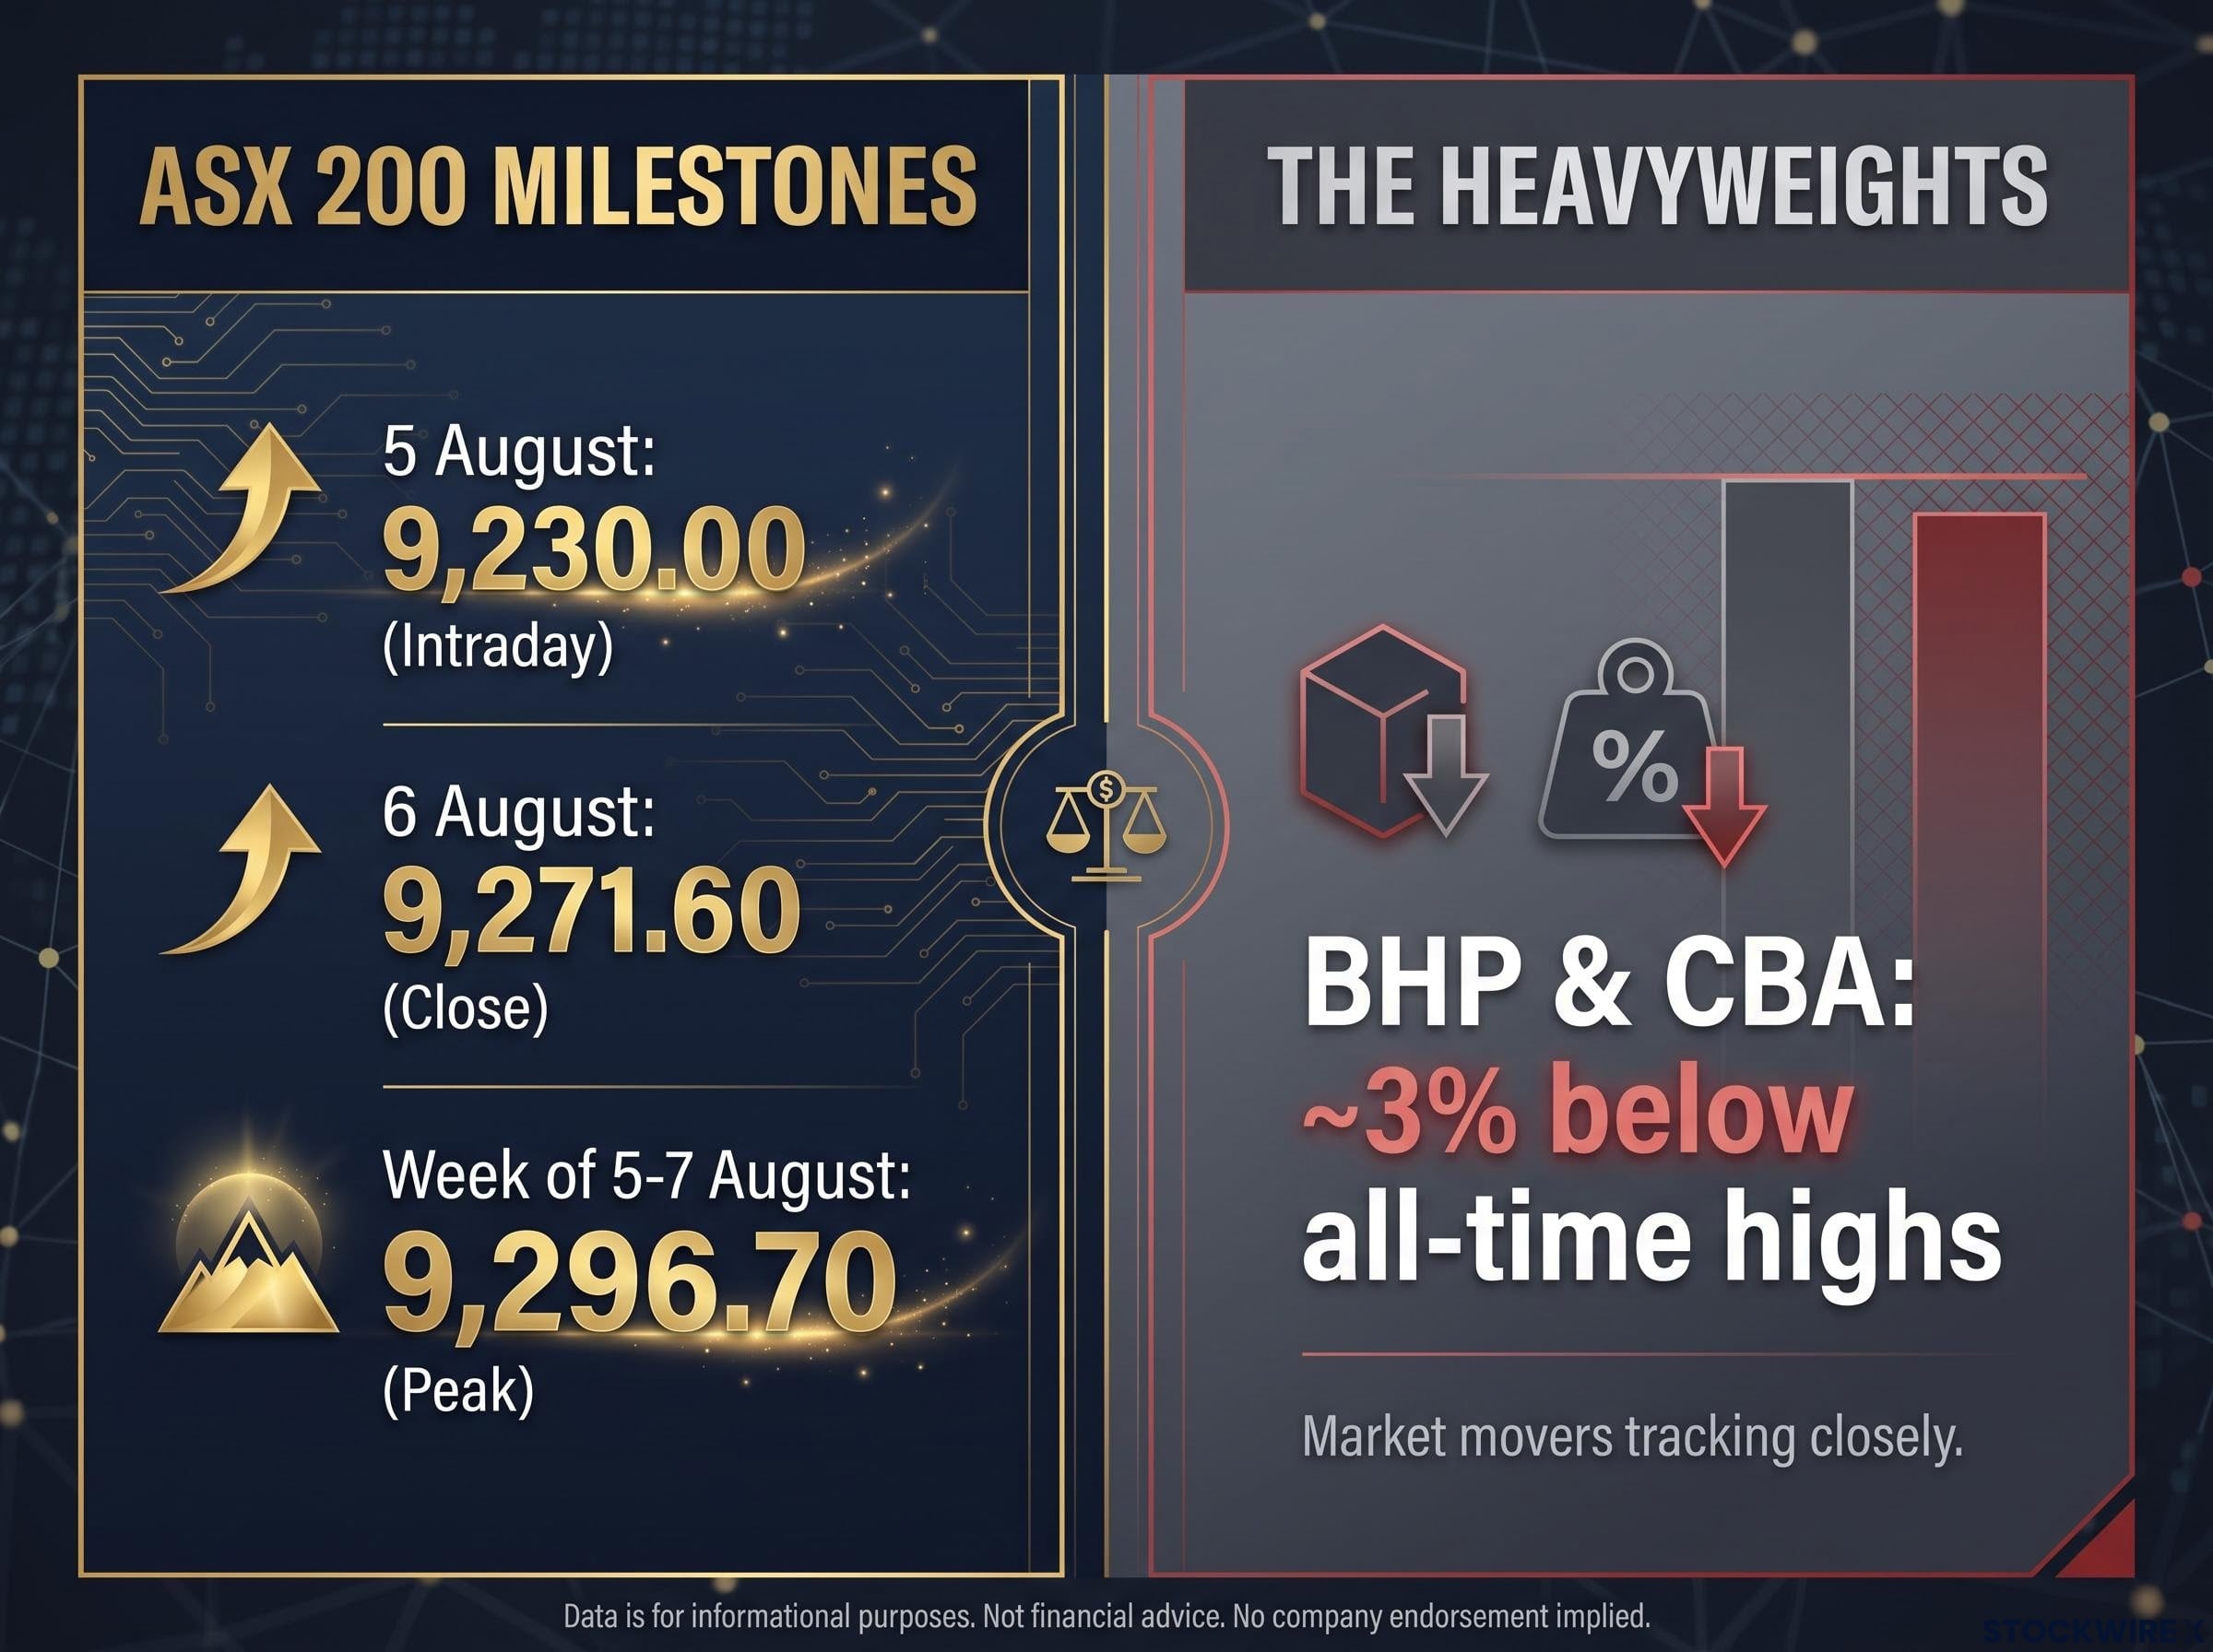
BHP remained approximately 3% below its all-time peak. CBA sat at a similar distance from its own record. For the index to print fresh highs without its largest constituents at their peaks, many other names across multiple sectors had to be advancing strongly enough to compensate.
The session data from 4 August confirmed exactly that. Advancing stocks outnumbered decliners by roughly five to one, a ratio that signals participation far wider than a handful of mega-caps could produce.
The session that confirmed the ASX 200 record high on 4 August 2026 also delivered a 3.93% surge in the Information Technology sub-index, with rare earth and critical minerals stocks rallying on institutional thematic buying tied to AI hardware and defence demand rather than company-specific catalysts.
The advance-to-decline ratio on 4 August reached approximately 5:1, with rising stocks nearly five times the number of fallers.
That breadth reading, combined with the mega-cap lag, tells you this was not a concentrated move in two or three large names. The rally’s foundation was distributed across the market, and that distinction matters for how you assess what comes next.
When big ASX news breaks, our subscribers know first
All eleven sectors finished positive: what the one-month scoreboard shows
Over the one-month period ending the first week of August, every ASX 200 sector posted positive returns. The ranked picture:
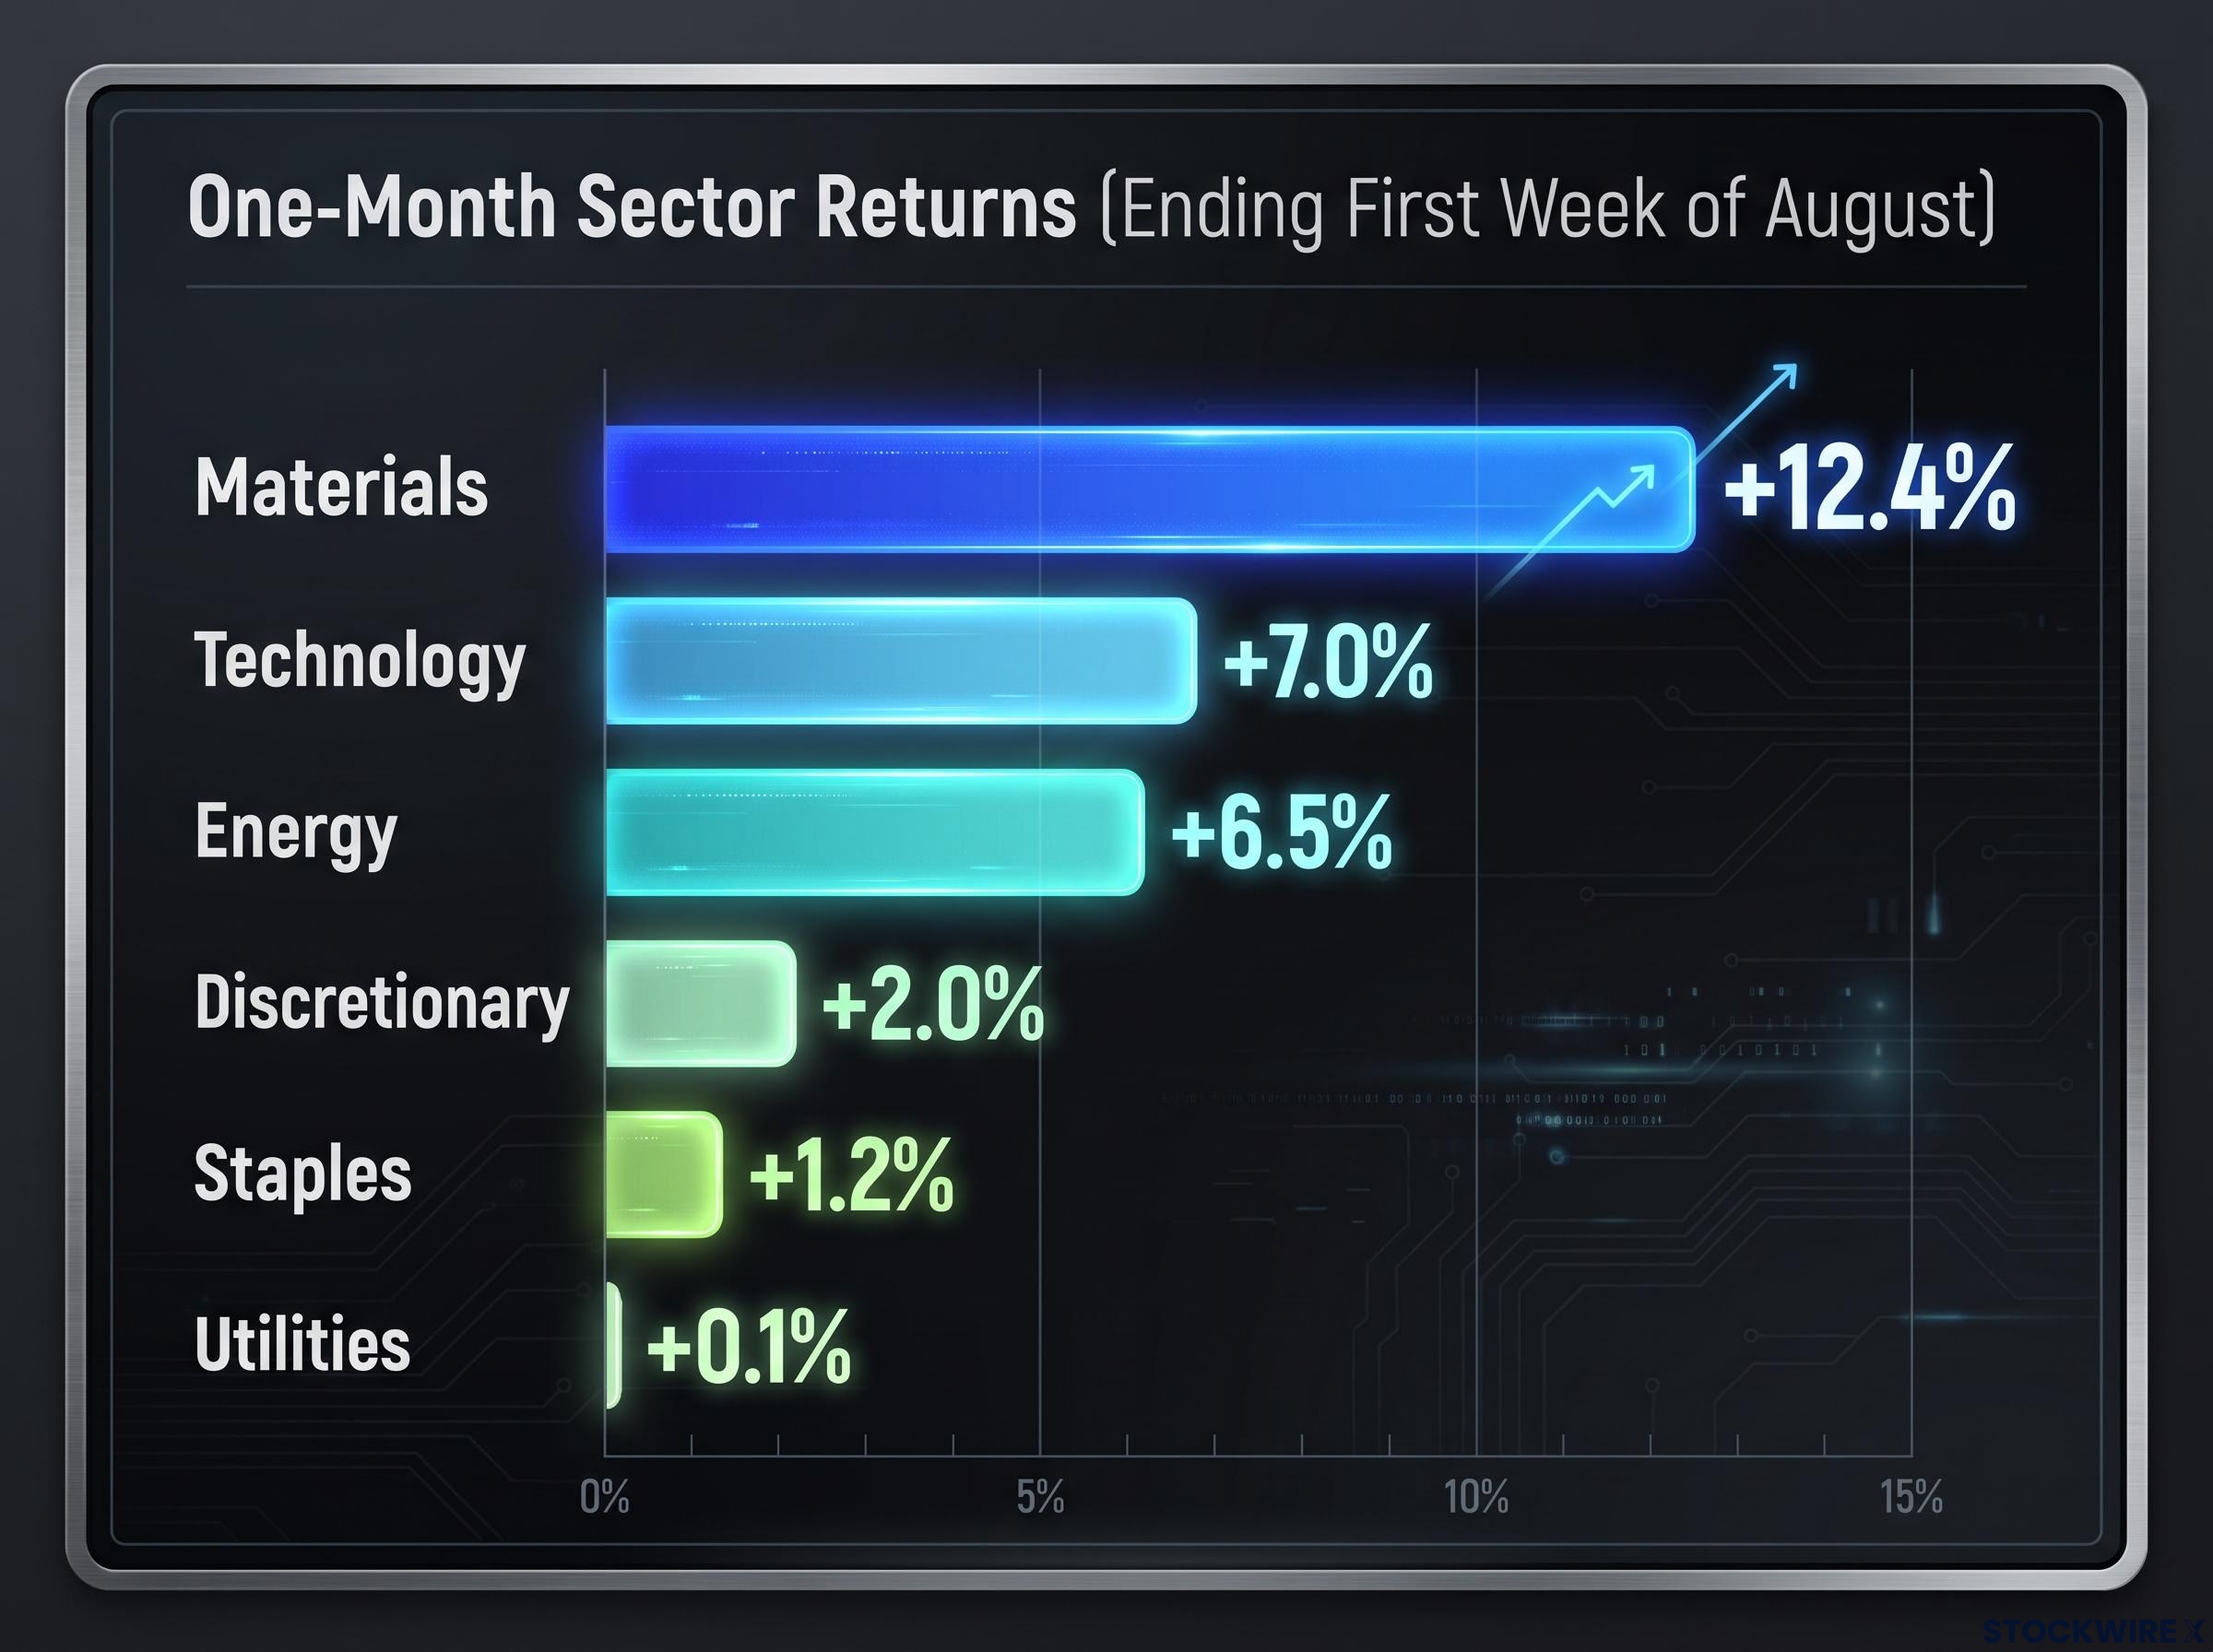
| Sector | One-month return |
|---|---|
| Materials | +12.4% |
| Technology | +7.0% |
| Energy | +6.5% |
| Discretionary | +2.0% |
| Staples | +1.2% |
| Utilities | +0.1% |
Financials, healthcare, industrials, REITs, and communication services all confirmed positive over the same period, though individual percentage figures vary slightly depending on the exact measurement window. Both materials and financials had moved close enough to their respective peaks to be considered near record-high territory.
The three structural highlights worth noting:
- Materials leadership at +12.4% dwarfed the rest, reflecting a strong commodity tailwind through the period
- Healthcare and staples reversed earlier weakness to post meaningful gains, recovering into positive territory at a pace that matched the stronger cyclical sectors
- Utilities posted the narrowest gain of any sector at +0.1%, finishing in the green but well behind every other part of the market
That last point matters. When even utilities posts a gain, there was no obvious sector to rotate away from during this period. That is a different environment from the defensive-versus-cyclical tug of war that typically accompanies an uncertain macro backdrop.
The sector rotation dynamics that brought the index to a 22-week high on 30 July 2026 were notably different from the August structure: that earlier move was driven by a narrow group of financials and defensives while technology and resources lagged, the inverse of the distributed participation seen a week later.
Why broad market participation signals a healthier rally than a narrow one
Market breadth measures the proportion of individual stocks and sectors advancing versus declining at any given time. It works as a health indicator for a rally because the more widely gains are distributed, the less vulnerable the index is to a shock in any single name or sector.
The distinction between a narrow rally and a broad one is straightforward. A narrow rally is one where a handful of mega-cap stocks do most of the lifting; the index rises, but most constituents are flat or falling. A broad rally is one where gains are spread across many stocks and multiple sectors. The ASX 200’s performance in early August fits squarely in the second category.
The participation of defensive sectors alongside cyclicals adds a further layer. When healthcare and staples rise at the same time as materials and technology, it indicates that investors with different risk profiles are simultaneously finding reasons to buy. That is more stable than a rally driven entirely by risk appetite, because it means demand exists across the spectrum rather than being concentrated in one direction.
Three structural advantages come with this kind of breadth:
- Lower single-stock shock risk: Weakness in any one name, including BHP or CBA, is less likely to derail the index when many other constituents are contributing
- Reduced downside asymmetry: Defensive sector participation means there is less capital waiting on the sidelines to flee, which dampens the potential for a sharp air-pocket sell-off
- Room for mega-cap catch-up: With BHP and CBA still 3% below their peaks, a future move higher in these heavyweight names could extend the rally even if other parts of the market begin to consolidate
What the BHP and CBA gap actually tells you
Two of the ASX 200’s largest constituents sitting 3% below their own records while the index prints all-time highs is a specific structural signal. It means mid-cap names, smaller-cap stocks, and other sector leaders are contributing meaningfully enough to compensate for that mega-cap drag.
The CBA and BHP market cap gap had narrowed to roughly $6.8 billion by early August 2026, meaning a 2-4% move in CBA’s share price could shift which stock sits at the top of the index and, by extension, which macro regime, domestic rates or global commodities, dominates the returns of every passive holder.
That reduces index concentration risk directly. A negative surprise in either BHP or CBA, whether from a commodity price dip, a regulatory issue, or an earnings miss, carries less potential to take the entire index with it when the rest of the market is pulling its weight.
What needs to hold for this breadth to last
Breadth is a positive signal, but it is a necessary condition for a durable rally, not a sufficient one. The materials sector’s +12.4% gain still requires commodity fundamentals, specifically iron ore, copper, and gold prices, to remain supportive. Strong breadth readings can deteriorate quickly if the macro inputs shift.
Three forward indicators are worth monitoring directly:
- Mega-cap confirmation: Whether BHP and CBA close the gap to their own all-time highs. A synchronised push to new records from these heavyweight names would reinforce the bullish structure
- Defensive sector resilience: Whether healthcare and staples hold their V-shaped recoveries rather than reverting lower. These sectors sustaining positive momentum would confirm that broad participation is durable, not a one-off
- Breadth metrics: The percentage of ASX 200 constituents trading above their 50-day and 200-day moving averages, and whether the advance-to-decline ratio holds near the elevated levels seen on 4 August
Interest-rate conditions remain the primary variable for financials and rate-sensitive sectors more broadly, while commodity prices are the key macro input for materials and energy.
If laggard sectors like utilities or staples roll over sharply while cyclicals correct, breadth can deteriorate quickly, and the rally’s structural advantage weakens. That combination is the early signal to watch.
For investors wanting to track the specific price levels that matter beneath the headline index number, our full analysis of ASX 200 support levels and internal fragility examines the 8,656 to 8,708 support band and the institutional auction flows that could expose an air pocket if buying pressure retreats.
For investors holding diversified ASX exposure, monitoring these specific inputs is more useful than watching the headline index level alone. The breadth underneath the number tells you more about sustainability than the number itself.
This article is for informational purposes only and should not be considered financial advice. Investors should conduct their own research and consult with financial professionals before making investment decisions.
A record built on many foundations is a different kind of record
The ASX 200’s all-time highs in the week ending 7 August 2026 were structurally different from the typical mega-cap-led record. Eleven sectors in positive territory, a 5:1 advance-to-decline ratio, and the two largest index constituents sitting below their own peaks all point to a rally built on distributed strength rather than concentrated leadership.
That breadth is a positive signal, not a guarantee. Commodity prices need to hold, defensive recoveries need to stick, and BHP and CBA closing the gap to their own records would confirm what the broader market is already suggesting. The question for Australian investors is not whether the index hit a record. It is whether the foundations beneath it are wide enough to hold the level. This week’s data suggests they are broader than usual.