Between 56% and 72% of Disney’s total segment operating income across the first three quarters of FY2026 came from a business built on roller coasters, cruise ships, and hotel beds. Not streaming subscriptions. Not movie tickets. Physical experiences.
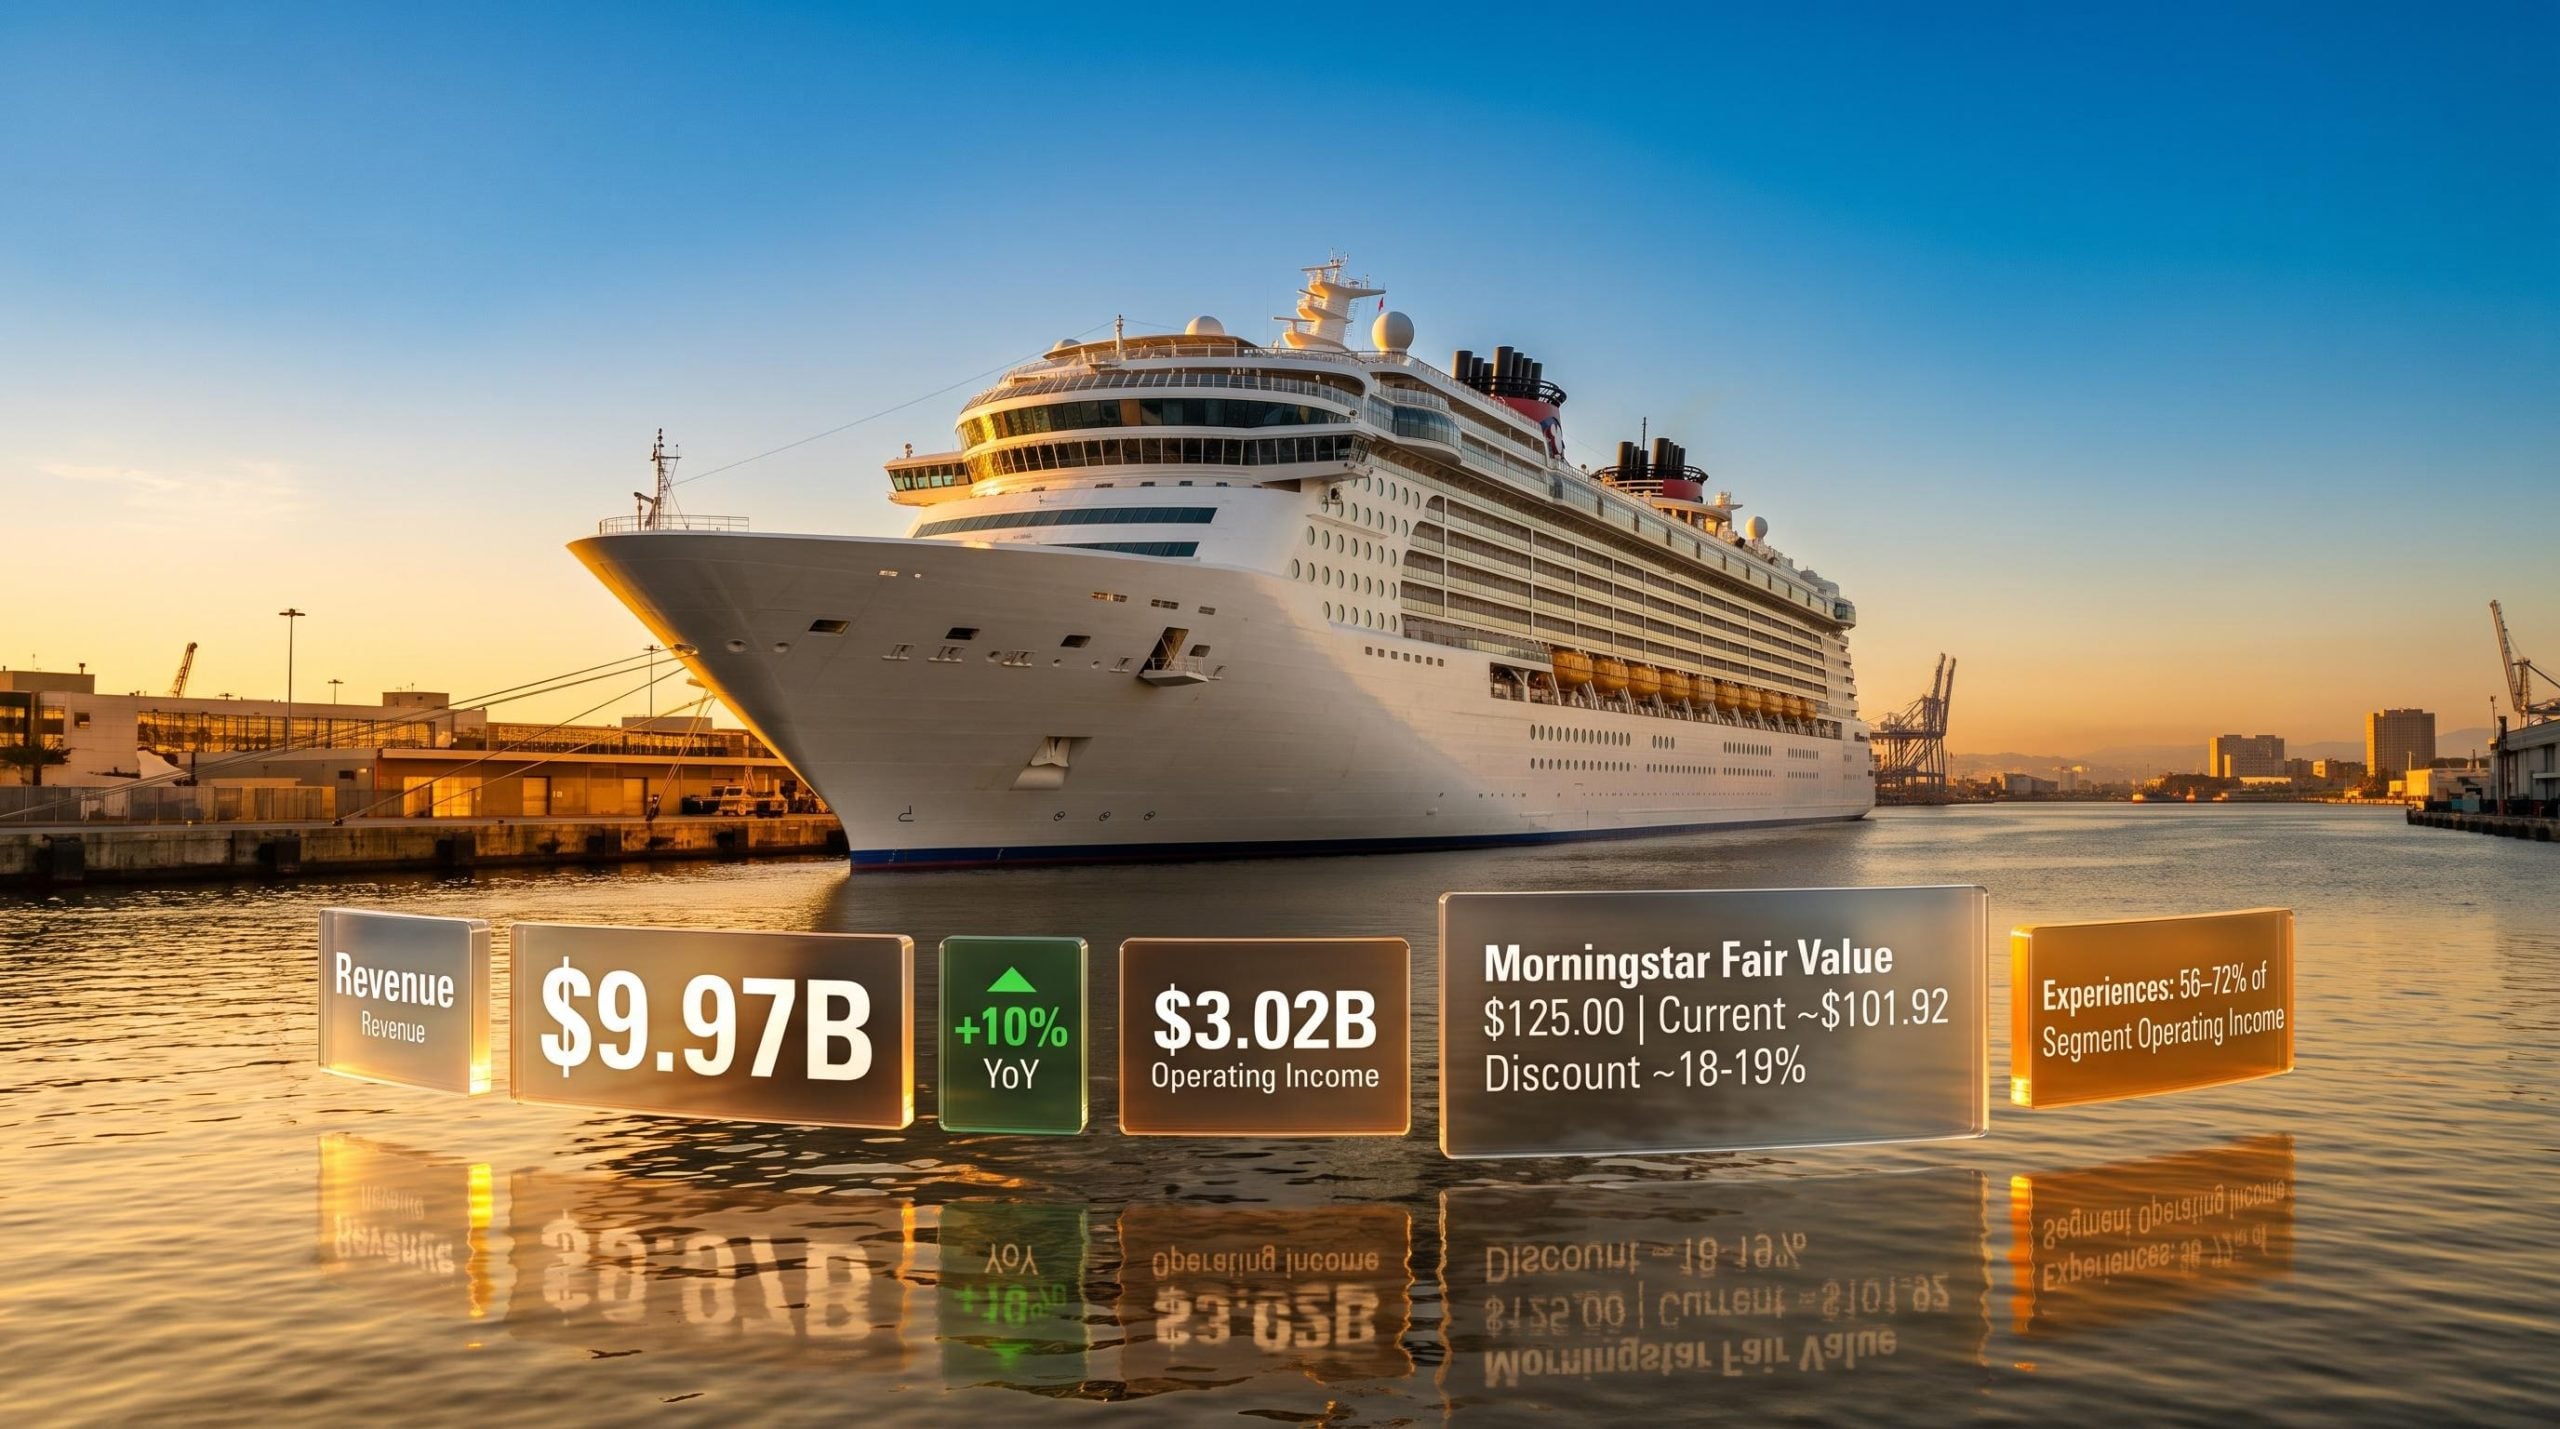
That number reframes how investors should think about the company. Disney’s Experiences segment, which houses its parks, resorts, cruises, and consumer products, has quietly become the earnings engine that keeps the rest of the business afloat. Q3 FY2026 accelerated the story: $9.97 billion in segment revenue (up 10% year over year), margin expansion above 30%, and company-wide net income of $2.6 billion. The structural shift is no longer emerging. It is the baseline.
Here is what the quarterly data actually tells you about where Disney’s value sits today, what the growth pipeline implies for future earnings, and what a disciplined investor should weigh before acting on that view.
Disney’s parks and cruises now generate more profit than everything else combined
The quarterly numbers across FY2026 tell a consistent story, and the scale is worth sitting with before interpreting it.
In Q1 FY2026 (quarter ended 27 December 2025), the Experiences segment crossed $10 billion in revenue for the first time, a record. It generated $3.3 billion in operating income, roughly 71-72% of Disney’s total segment operating income of $4.6 billion.
Q2 saw a seasonal step-down, but the structural picture held. Q3 reaccelerated with 10% revenue growth and operating income above $3 billion.
| Period | Experiences Revenue | Experiences Op. Income | Experiences Margin | Share of Segment Op. Income |
|---|---|---|---|---|
| Q1 FY2026 | $10.0B (record) | $3.3B | ~33% | ~71-72% |
| Q2 FY2026 | $9.5B (+7% YoY) | $2.6B (+5% YoY) | ~27-28% | ~56-57% |
| Q3 FY2026 | $9.97B (+10% YoY) | $3.02B | ~30%+ | Not separately stated |
The 56-72% range across three quarters is not a one-off anomaly. It is the structural baseline for how Disney earns money. Any investor evaluating the stock primarily on streaming momentum or box office performance is anchoring on the wrong profit centre.
When big ASX news breaks, our subscribers know first
What is actually driving the margin expansion
Margin improvement in a capital-heavy business can come from two very different places. Cost-cutting delivers fast results that tend to fade. Pricing power and operating leverage on a fixed-cost base deliver results that tend to compound. The distinction matters because it tells you how durable the trend is.
The Experiences segment’s operating margin moved roughly two percentage points higher quarter on quarter, climbing from approximately 27-28% in Q2 FY2026 to beyond 30% in Q3. Management commentary and analyst coverage attribute that expansion to four primary drivers:
- Pricing power and higher per-guest spending
- Revenue mix improvements, including premium-tier experiences
- New cruise fleet capacity contributing high-margin revenue
- Better utilisation of existing fixed-cost infrastructure
This is not a cost-cutting story.
Q3 FY2026: Worldwide theme park attendance grew 4%. Revenue grew 10%. That gap is the per-guest monetisation story in a single data point.
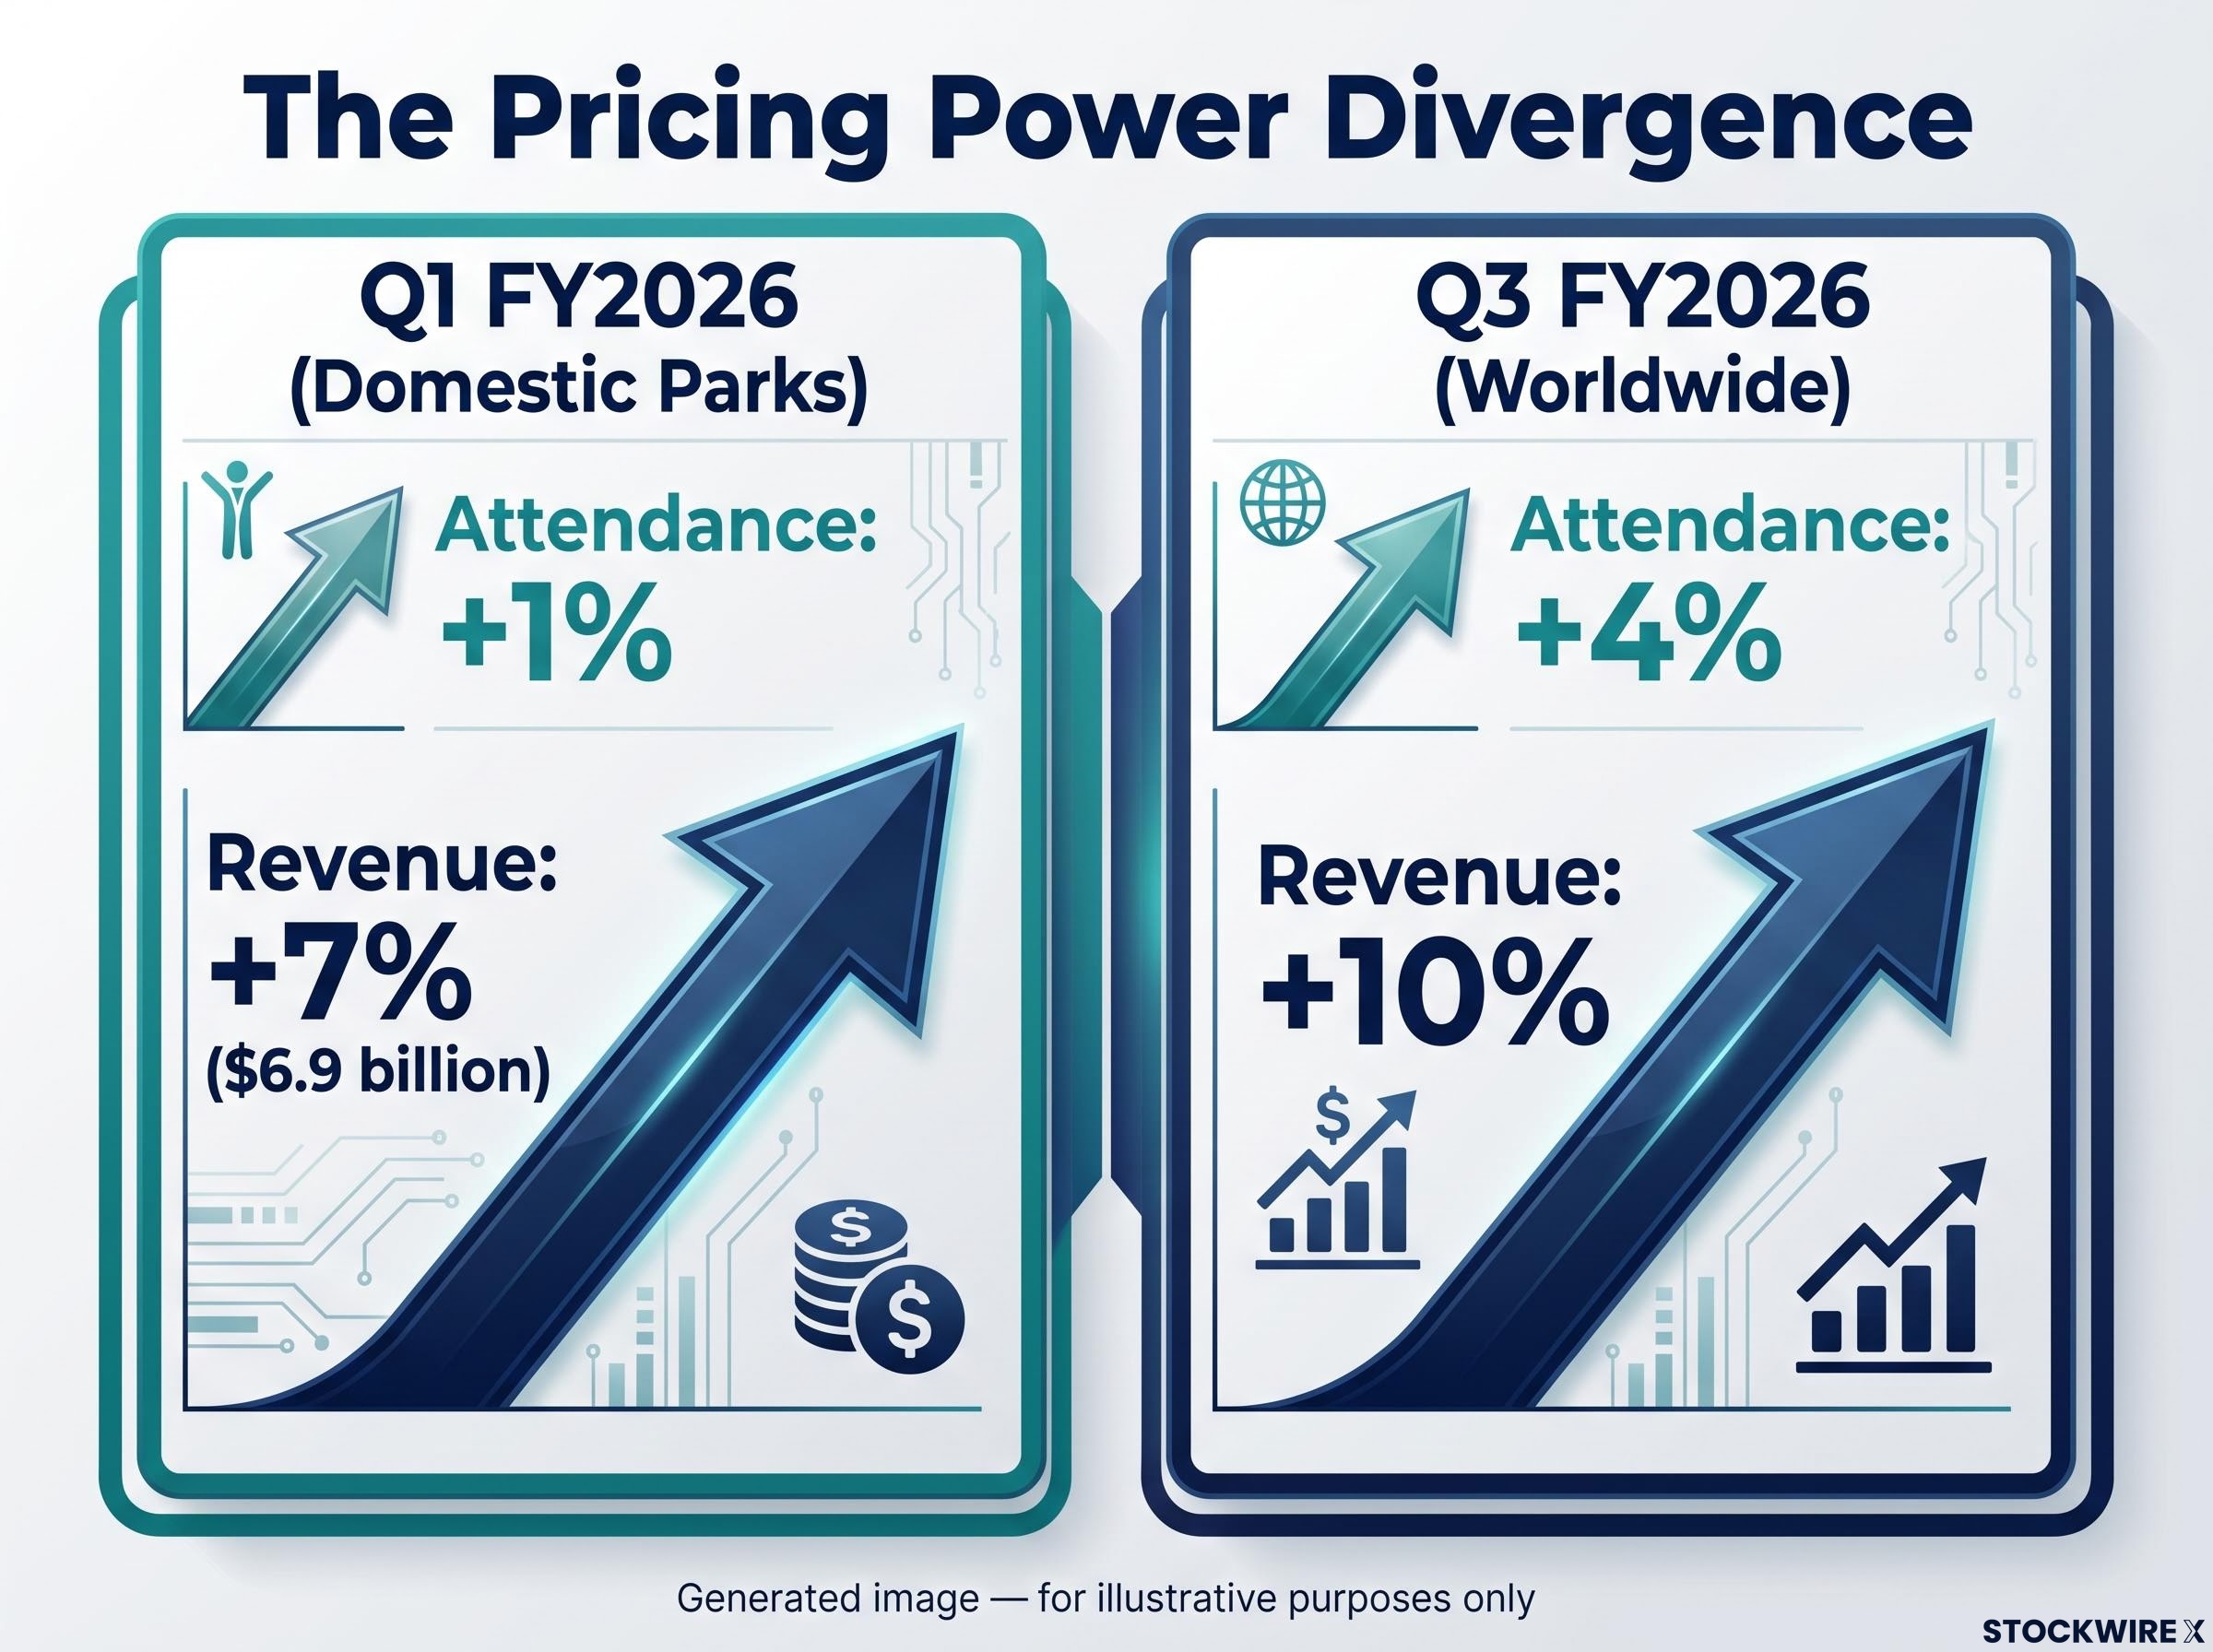
The attendance-versus-revenue divergence is where the earnings quality argument sharpens. In Q1 FY2026, domestic parks revenue rose approximately 7% to $6.9 billion while attendance increased only about 1%. Disney is extracting significantly more value from each visitor who walks through the gate, and that dynamic is structurally more durable than margin gains built on headcount reductions or supplier renegotiations.
S&P 500 earnings growth running at 27.1% for Q1 2026, nearly double pre-season analyst estimates, provides the macro context in which Disney’s 10% Experiences revenue acceleration and margin expansion landed: a broad earnings environment where the market had already re-rated for exceptional results, raising the bar for what incremental outperformance requires.
For any investor modelling Disney’s forward earnings, that distinction should carry significant weight.
How cruise expansion and new attractions become structural earnings growth
The connection between capital deployed and revenue generated in Disney’s Experiences business follows a pattern that has repeated across multiple investment cycles.
Q2 FY2026 management commentary explicitly cited “more capacity on the company’s cruise line with the introduction of two new ships” as a revenue growth driver. Those ships are not a minor side business. Cruise fleet expansion is characterised as high-margin, premium-priced capacity that leverages Disney’s intellectual property into a travel format where per-guest spending is materially higher than a single-day park visit.
Historical data reinforces the pattern. New themed lands, whether Star Wars, Marvel, or Frozen, have consistently driven measurable step-ups in both attendance and per-capita spending at the parks where they launch. Each major attraction translates into incremental visits and incremental revenue.
The visible growth runway breaks into three categories:
- New cruise ships already in service, contributing to FY2026 results across Q2 and Q3
- Additional fleet expansion in the pipeline, with further capacity publicly discussed for subsequent years
- New themed lands and attractions with a historical precedent of attendance and spending lifts at each launch
For investors, the pipeline of committed capital in ships and attractions functions as a partially locked-in earnings ramp. The assets are being built, the pricing model is proven, and the pattern of incremental demand generation from new capacity has repeated across multiple cycles. Growth here is partly a function of capacity deployment, not just discretionary consumer sentiment.
What the Asian market weakness and international tourism gap actually mean
The bull case is only as strong as the headwinds it accounts for, and two distinct drags on Disney’s Experiences results deserve specific attention.
The first is macro weakness in Asian markets. Q3 FY2026 Experiences results were partially offset by softer performance in Hong Kong and Shanghai, where local economic conditions drive tourism demand. Historical patterns show documented volatility in those markets across prior years; this is not a new development, but it is an active one.
The second is the incomplete recovery of international tourist volumes at U.S. parks. Foreign visitors have remained below historical norms throughout the FY2026 reporting period, held back by currency movements and elevated travel costs.
- Asian market softness: Driven by local macro conditions in Hong Kong and Shanghai, with tourism flows closely tied to regional economic performance
- U.S. international tourism gap: Currency headwinds and travel costs limiting the return of higher-spending foreign guests
Why the distinction between cyclical and structural matters
International visitors matter disproportionately because they stay longer and spend more per visit than domestic guests. Their below-trend return creates a measurable per-guest spending drag even when headline attendance holds steady.
The question for investors is whether these headwinds represent cyclical softness (tied to macro conditions, currency, and travel costs that will eventually normalise) or structural impairment (competitive displacement or erosion of Disney’s brand pull). Available evidence points to the former. There is no indication that Disney is losing market share to competing destinations or that its intellectual property has weakened in these geographies.
Morningstar’s Medium Uncertainty designation is relevant here. It is not boilerplate. It is the analyst’s explicit acknowledgment that tourism demand volatility and macroeconomic sensitivity of discretionary spending create real uncertainty around return timing, even when the long-term structural thesis remains intact.
Investors buying the Experiences thesis should understand what the near-term drag is, and why it is not the same as structural deterioration. Conflating the two leads to both premature exits and poorly timed entries.
Assessing the standalone value of Disney’s Experiences segment
Morningstar analyst Matthew Dolgin, CFA, has arrived at a notable valuation conclusion: the Experiences segment on its own carries an estimated worth that comes close to matching what the market currently assigns to the whole of Disney.
Morningstar fair value estimate: $125.00 per share, maintained following Q3 FY2026 results. Four-star rating out of five. Wide economic moat, reaffirmed. Stock price at time of report: approximately $101.92 (as of 5 August 2026), implying an 18-19% discount to fair value.
That “Experiences equals market cap” framing is not a promotional flourish. It is an analytical claim with computable support from public quarterly data. Run the arithmetic: Experiences segment operating income across Q1-Q3 FY2026 annualises to approximately $11-$12 billion. Apply a high-teens multiple to that run rate (reasonable for a wide-moat, growing, capital-intensive leisure business), and the standalone segment value approaches or matches Disney’s total equity market capitalisation.
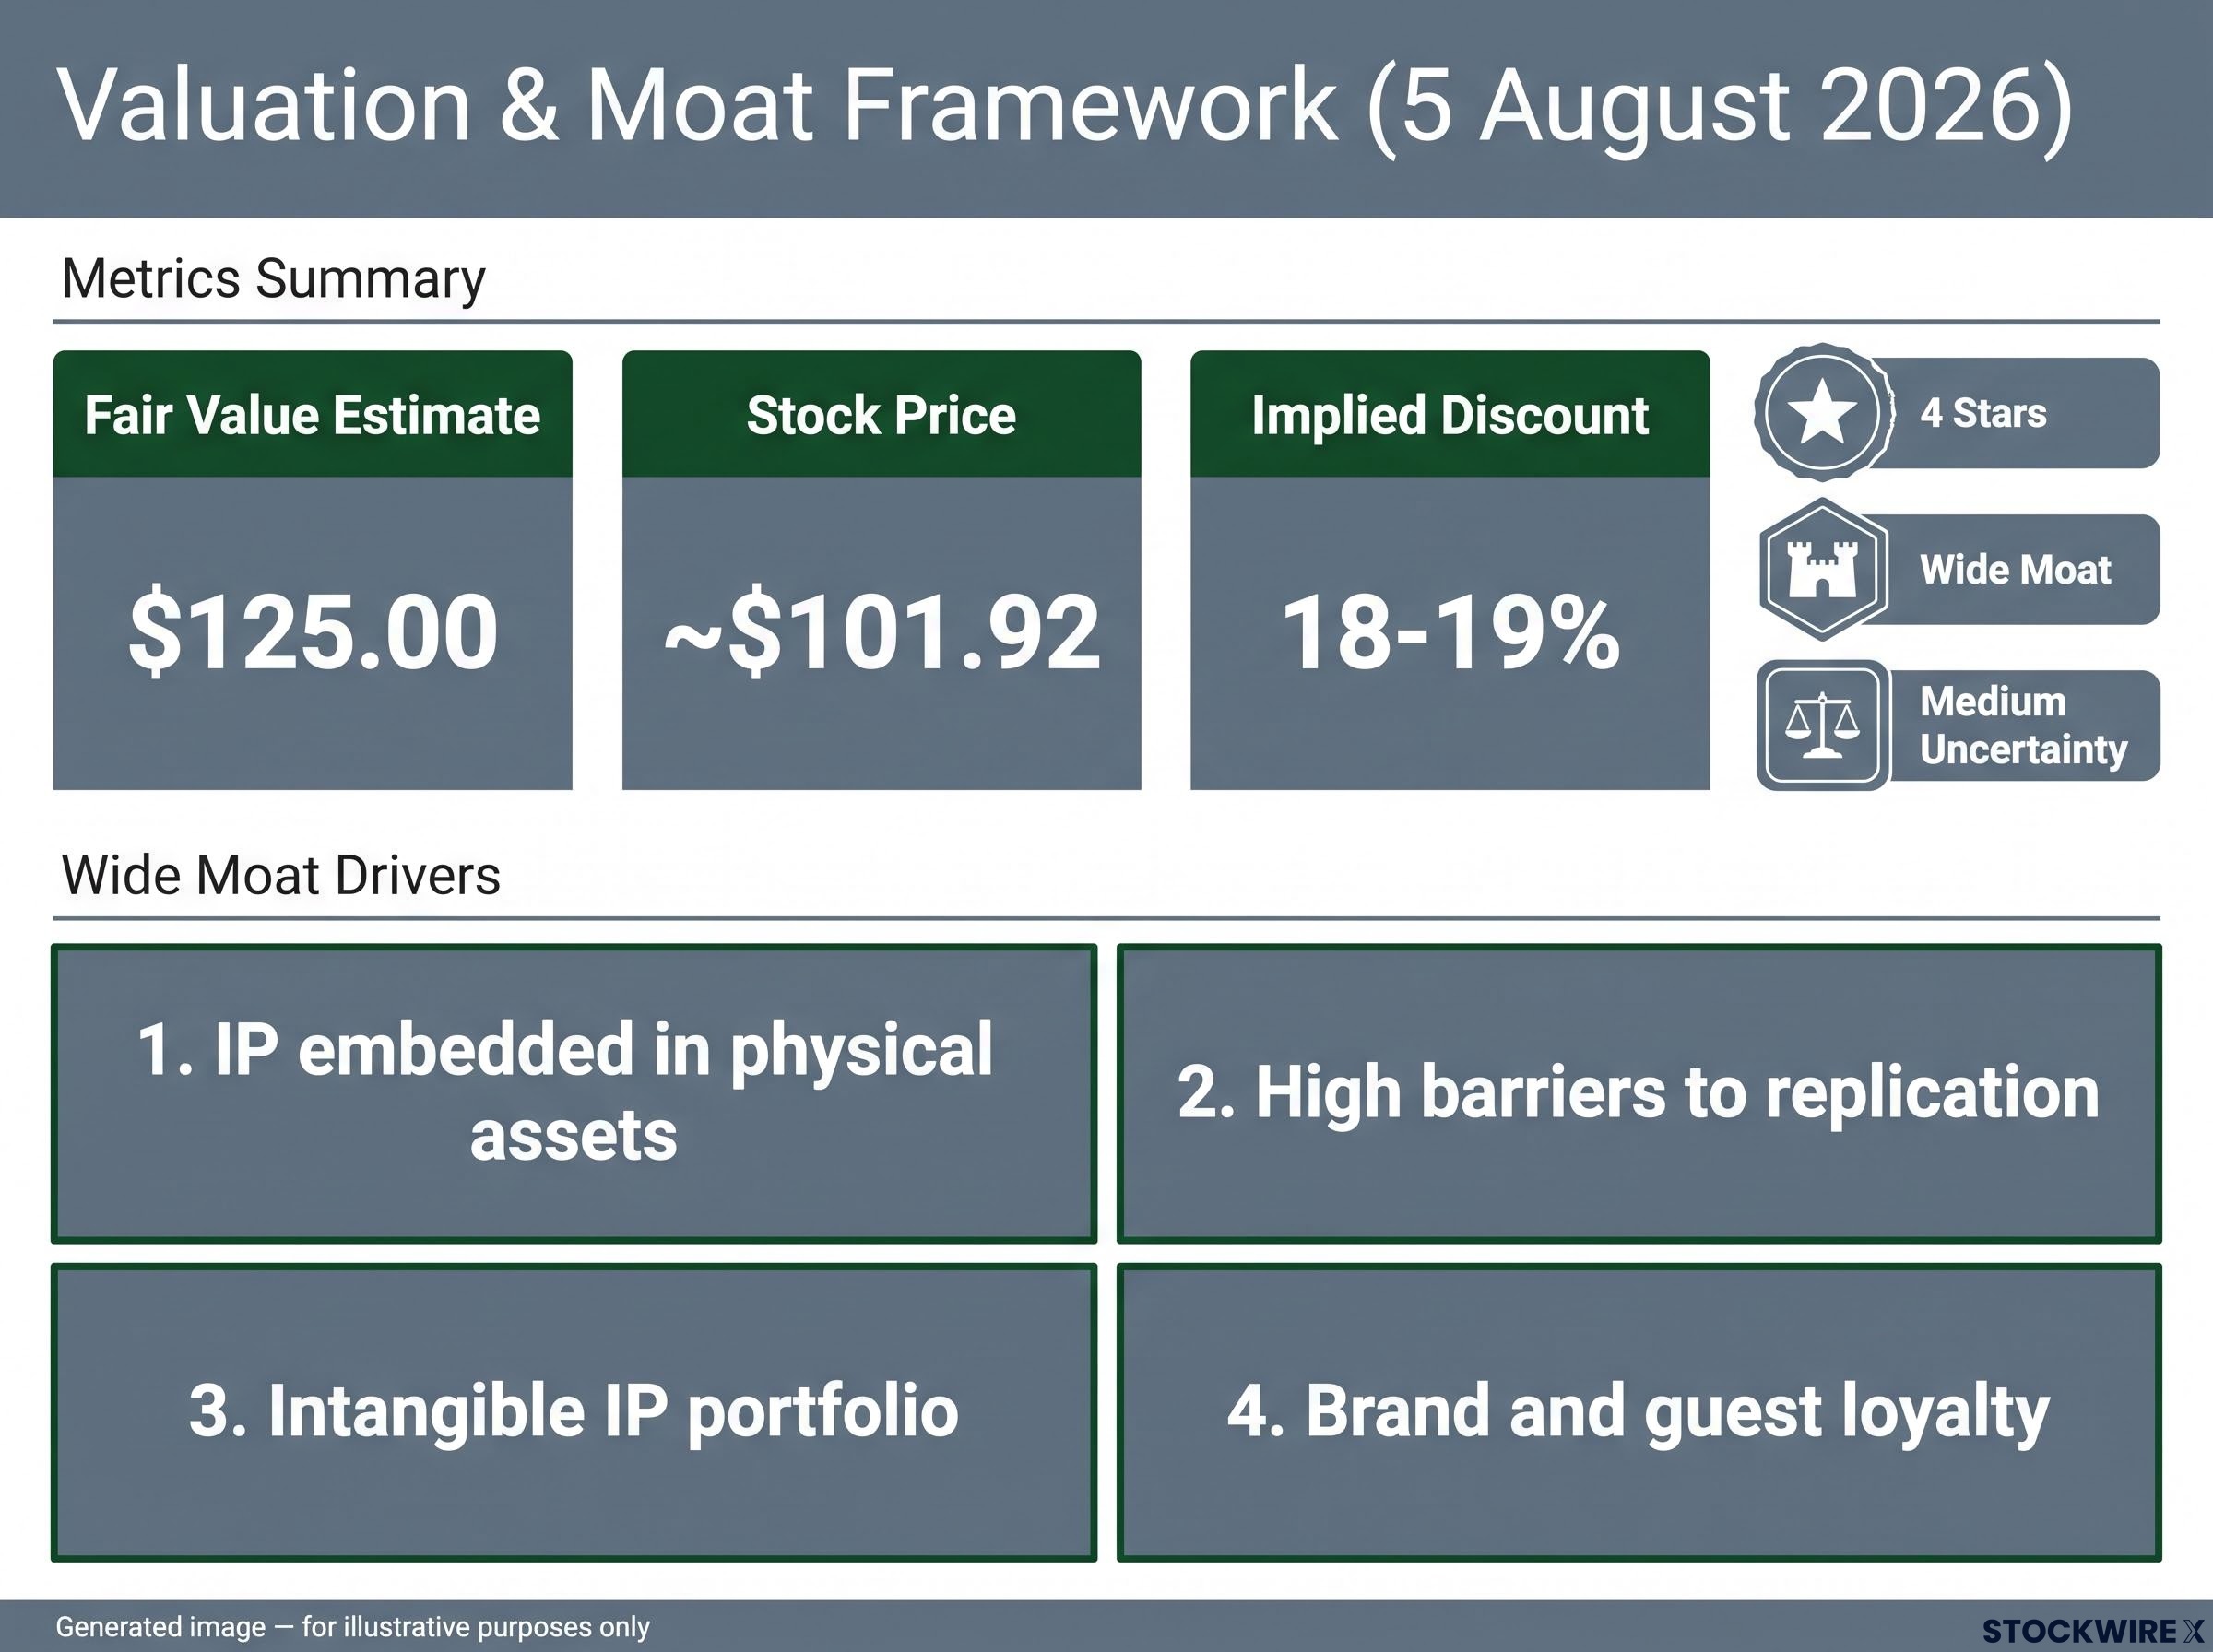
The wide moat that underpins this valuation rests on four characteristics:
- IP embedded in physical assets that cannot be easily replicated
- High barriers to replication, requiring decades and tens of billions in capital to build a competing global network
- Intangible IP portfolio, with enduring characters, stories, and franchises underpinning long-term demand
- Brand and guest loyalty, reinforcing pricing power across economic cycles
| Metric | Fair Value | Stock Price (5 Aug 2026) | Implied Discount | Star Rating / Moat / Uncertainty |
|---|---|---|---|---|
| Morningstar Assessment | $125.00 | ~$101.92 | ~18-19% | 4 stars / Wide / Medium |
If the market is currently pricing Disney as though the media and streaming businesses are worth something and Experiences is worth everything else, an investor recovering that embedded discount has a defined thesis rather than a directional bet. That specificity is what separates a position from a punt.
The margin of safety framework calibrates the required discount to business quality: high-moat, predictable businesses typically require a 30% buffer, while cyclical or capital-intensive businesses demand 40-50%, a distinction that applies directly to how an investor should approach the 18-19% implied discount in Morningstar’s current Disney assessment.
These valuation conclusions represent Morningstar’s proprietary analytical view and are attributed to Matthew Dolgin, CFA. They are not independently verifiable consensus figures.
Capital intensity and cyclical risk: the variables that complicate the bull case
The reader who has followed this analysis through five sections of favourable data may be leaning bullish. This is where the productive friction belongs.
Operating leverage is a symmetric force
The same fixed-cost structure that amplifies profit when parks are full and cruise ships are booked amplifies losses when they are not. The margin gains visible in FY2026 are the upside of fixed-cost leverage. The pandemic-era park closures, when the same infrastructure generated zero revenue against ongoing maintenance costs, illustrate the downside. Investors in parks and cruises have experienced this asymmetry in living memory.
Capital intensity changes the free cash flow picture
The annualised Experiences operating income run rate of approximately $11-$12 billion looks compelling. But this is a pre-capex figure. Disney has committed to ongoing large capital expenditures across new ships, new attractions, and park expansions. During heavy investment periods, free cash flow will diverge meaningfully from operating income. Any valuation discipline applied to Experiences must account for that gap.
Capital allocation trends across large-cap US companies in 2026 show free cash flow yield compressing to 20-year lows even as operating cash flows hit records, a backdrop that makes the gap between Disney’s Experiences operating income and its free cash flow after committed capex a more consequential variable than the headline segment profit figures suggest.
The four variables that complicate the bull case:
- Recession and consumer discretionary sensitivity, with theme park and cruise spending among the first household budget items cut in downturns
- Geopolitical exposure across international park operations in multiple jurisdictions
- Capex intensity reducing free cash flow conversion during investment-heavy periods
- Pandemic-style closure risk, a tail risk that the market may be under-pricing given recency bias
Morningstar’s Medium Uncertainty designation incorporates capital intensity and cyclical exposure explicitly. An investor building a position primarily on the Experiences thesis needs a view on cycle timing and capex normalisation, not just conviction on the structural profit dominance of the segment.
What the profit data, the pipeline, and the valuation gap tell a disciplined investor
Three analytical findings have held consistently across Q1-Q3 FY2026. Experiences generates 56-72% of segment operating profit and is expanding margins through pricing power and operating leverage. The pipeline of ships and attractions provides a partially visible earnings ramp backed by committed capital. And Morningstar’s valuation framework places an approximately 18-19% implied discount on the stock relative to a $125 fair value estimate.
Revenue growth has accelerated from 7% in Q2 to 10% in Q3. The annualised Experiences operating income run rate sits at approximately $11-$12 billion. These are not speculative projections. They are reported results.
Three consecutive quarters of data make the Experiences profit dominance story a structural baseline, not a thesis to be debated. The question is no longer whether the shift has occurred, but what an investor does with that information. Three questions require independent answers before a capital commitment is warranted:
- Where are you in the discretionary spending cycle, and what does that imply for entry timing?
- What is the capex trajectory over the next three years, and how does it affect free cash flow conversion?
- Does media and streaming represent positive optionality (upside surprise potential) or a drag on the equity story?
The structural case is supported by data. The risk variables are identifiable and quantifiable. What remains is the investor’s own work on timing, sizing, and conviction.
Entry-price discipline separates a great company from a great investment, a distinction Intel’s post-2000 trajectory illustrated with painful precision: investors who bought a genuinely dominant business at the wrong price waited over two decades to recover, even as the underlying fundamentals continued to grow.
This article is for informational purposes only and should not be considered financial advice. Investors should conduct their own research and consult with financial professionals before making investment decisions. Past performance does not guarantee future results. Financial projections are subject to market conditions and various risk factors.