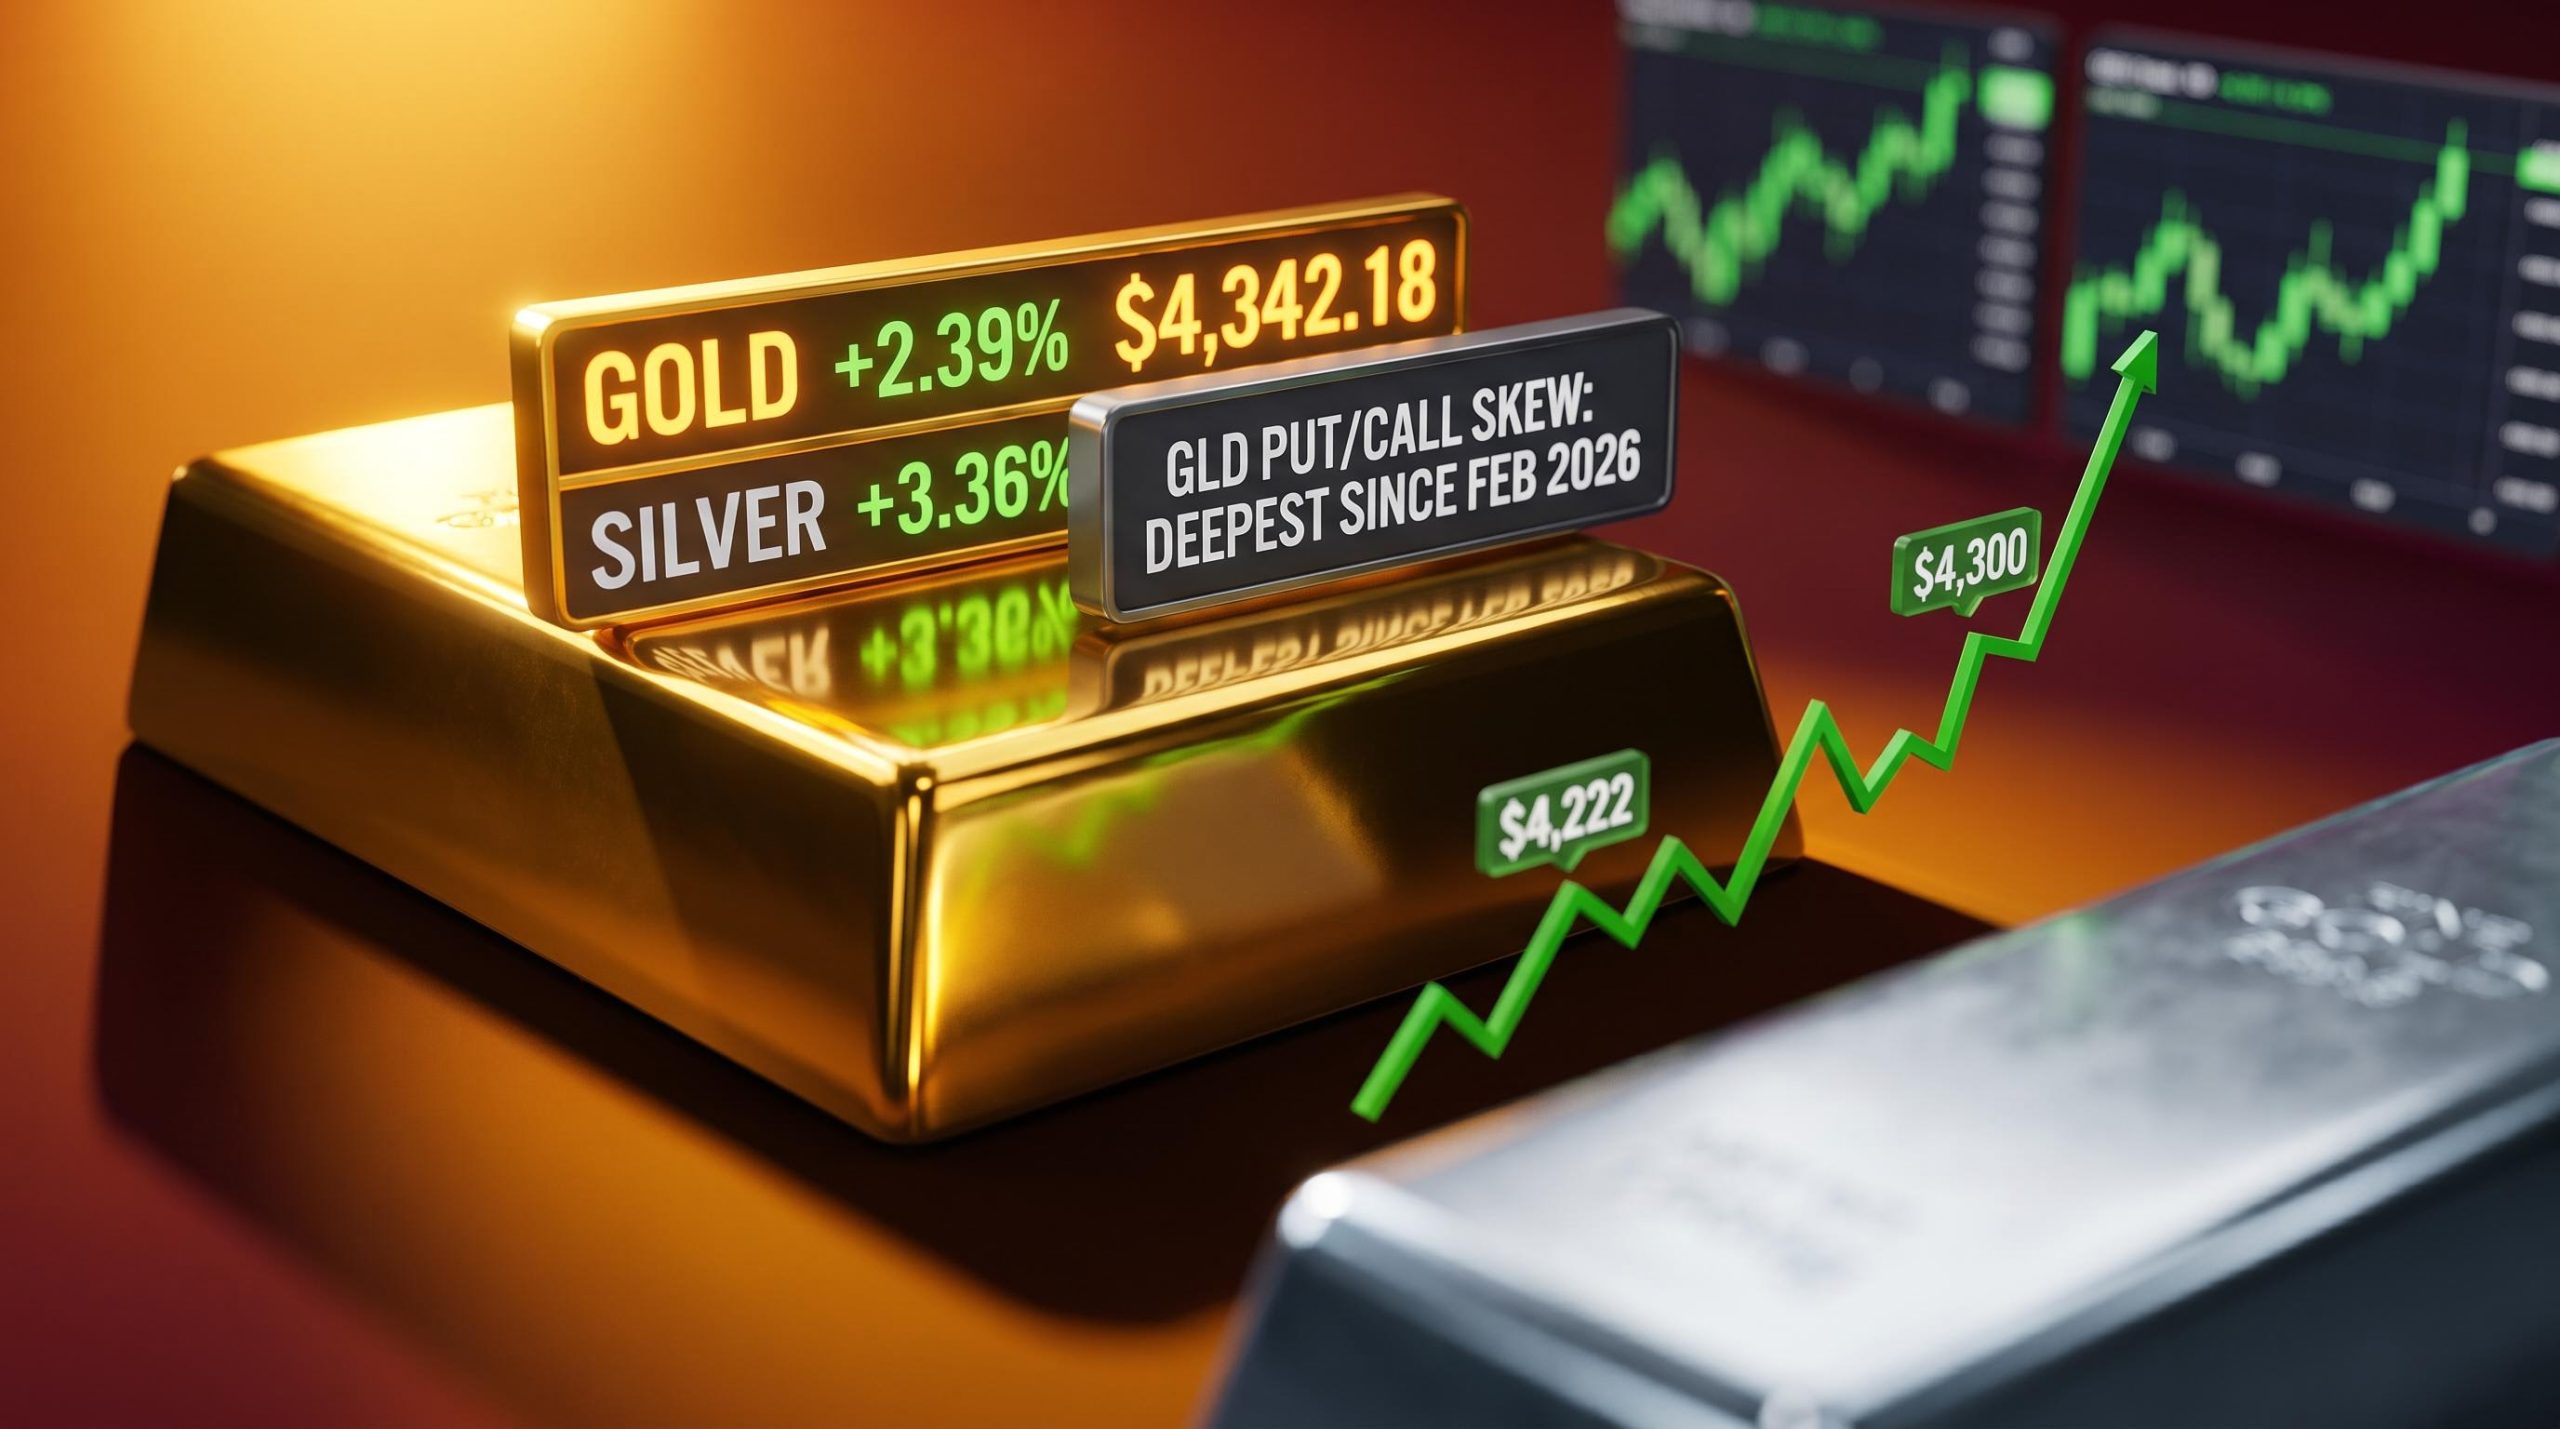
Gold surged more than 2.39% to approximately $4,342.18 on 8 August 2026, while silver jumped 3.36% in the same session. The moves were sharp, simultaneous, and backed by volume. Behind both was a single institutional call that landed on desks the previous evening.
Scott Rubner of Citadel Securities published his first bullish case for precious metals in 2026 on 7 August, arguing that conditions in the gold and silver markets were among the most attractive he had seen in some time. The call is built on five catalysts that Rubner describes as converging simultaneously, an alignment he considers uncommon. This is not a routine analyst note. It is a structured, multi-factor thesis issued on a day when gold futures hit $4,401.30 (up 2.37%) and silver futures climbed 3.56%, with prices already moving in the direction the thesis predicts.
Here is what each of those five catalysts actually means for you if you are weighing exposure to GLD or SLV today, along with an honest read on where the risks sit and what could go wrong.
How Rubner’s five catalysts stack together
Rubner’s argument is not about any single driver. It is about the rarity of five distinct forces, macro, positioning, flow, and structural demand, arriving at the same time. Any one of them could be dismissed as noise. Their convergence is what gives the thesis its weight, and that distinction matters before you decide whether to take the call seriously.
The five catalysts break into two categories. Three are macro forces:
- Dovish Federal Reserve repricing
- U.S. dollar weakness
- Accelerating central bank gold demand
Two are positioning and flow dynamics:
- Options skew inversion in GLD and SLV
- CTA net short exposure in both gold and silver
The macro catalysts set the direction. The positioning catalysts determine how fast and how far prices could move once the direction is established. Both GLD and SLV are the instruments Rubner examined in detail, which means retail investors have a straightforward path from his thesis to a tradeable position.
When big ASX news breaks, our subscribers know first
What options positioning and CTA short exposure mean for the rally
The options skew signal in GLD and SLV
In GLD, the put/call skew has inverted to its deepest reading since February 2026, while implied volatility has been lifting from a low base, a combination that Citadel Securities considers historically associated with building bullish institutional conviction.
When call implied volatility trades above put implied volatility, it tells you institutions are paying for upside exposure rather than buying downside hedges. They are positioning for a move higher, not protecting against a move lower. Across both GLD and SLV, implied volatility has been climbing off subdued levels, a development that points to a market shifting out of a quiet, directionless phase and into one with clearer momentum.
That shift matters because it is institutional money, not retail speculation, driving the repricing.
CTA positioning as a mechanical accelerant
Trend-following funds, known as CTAs (commodity trading advisers), held net short positions in both gold and silver as of 6 August 2026. Citadel Securities considers that short positioning to be out of step with the strengthening macro environment, which means it represents potential buying pressure waiting to be unlocked rather than a constraint on the rally.
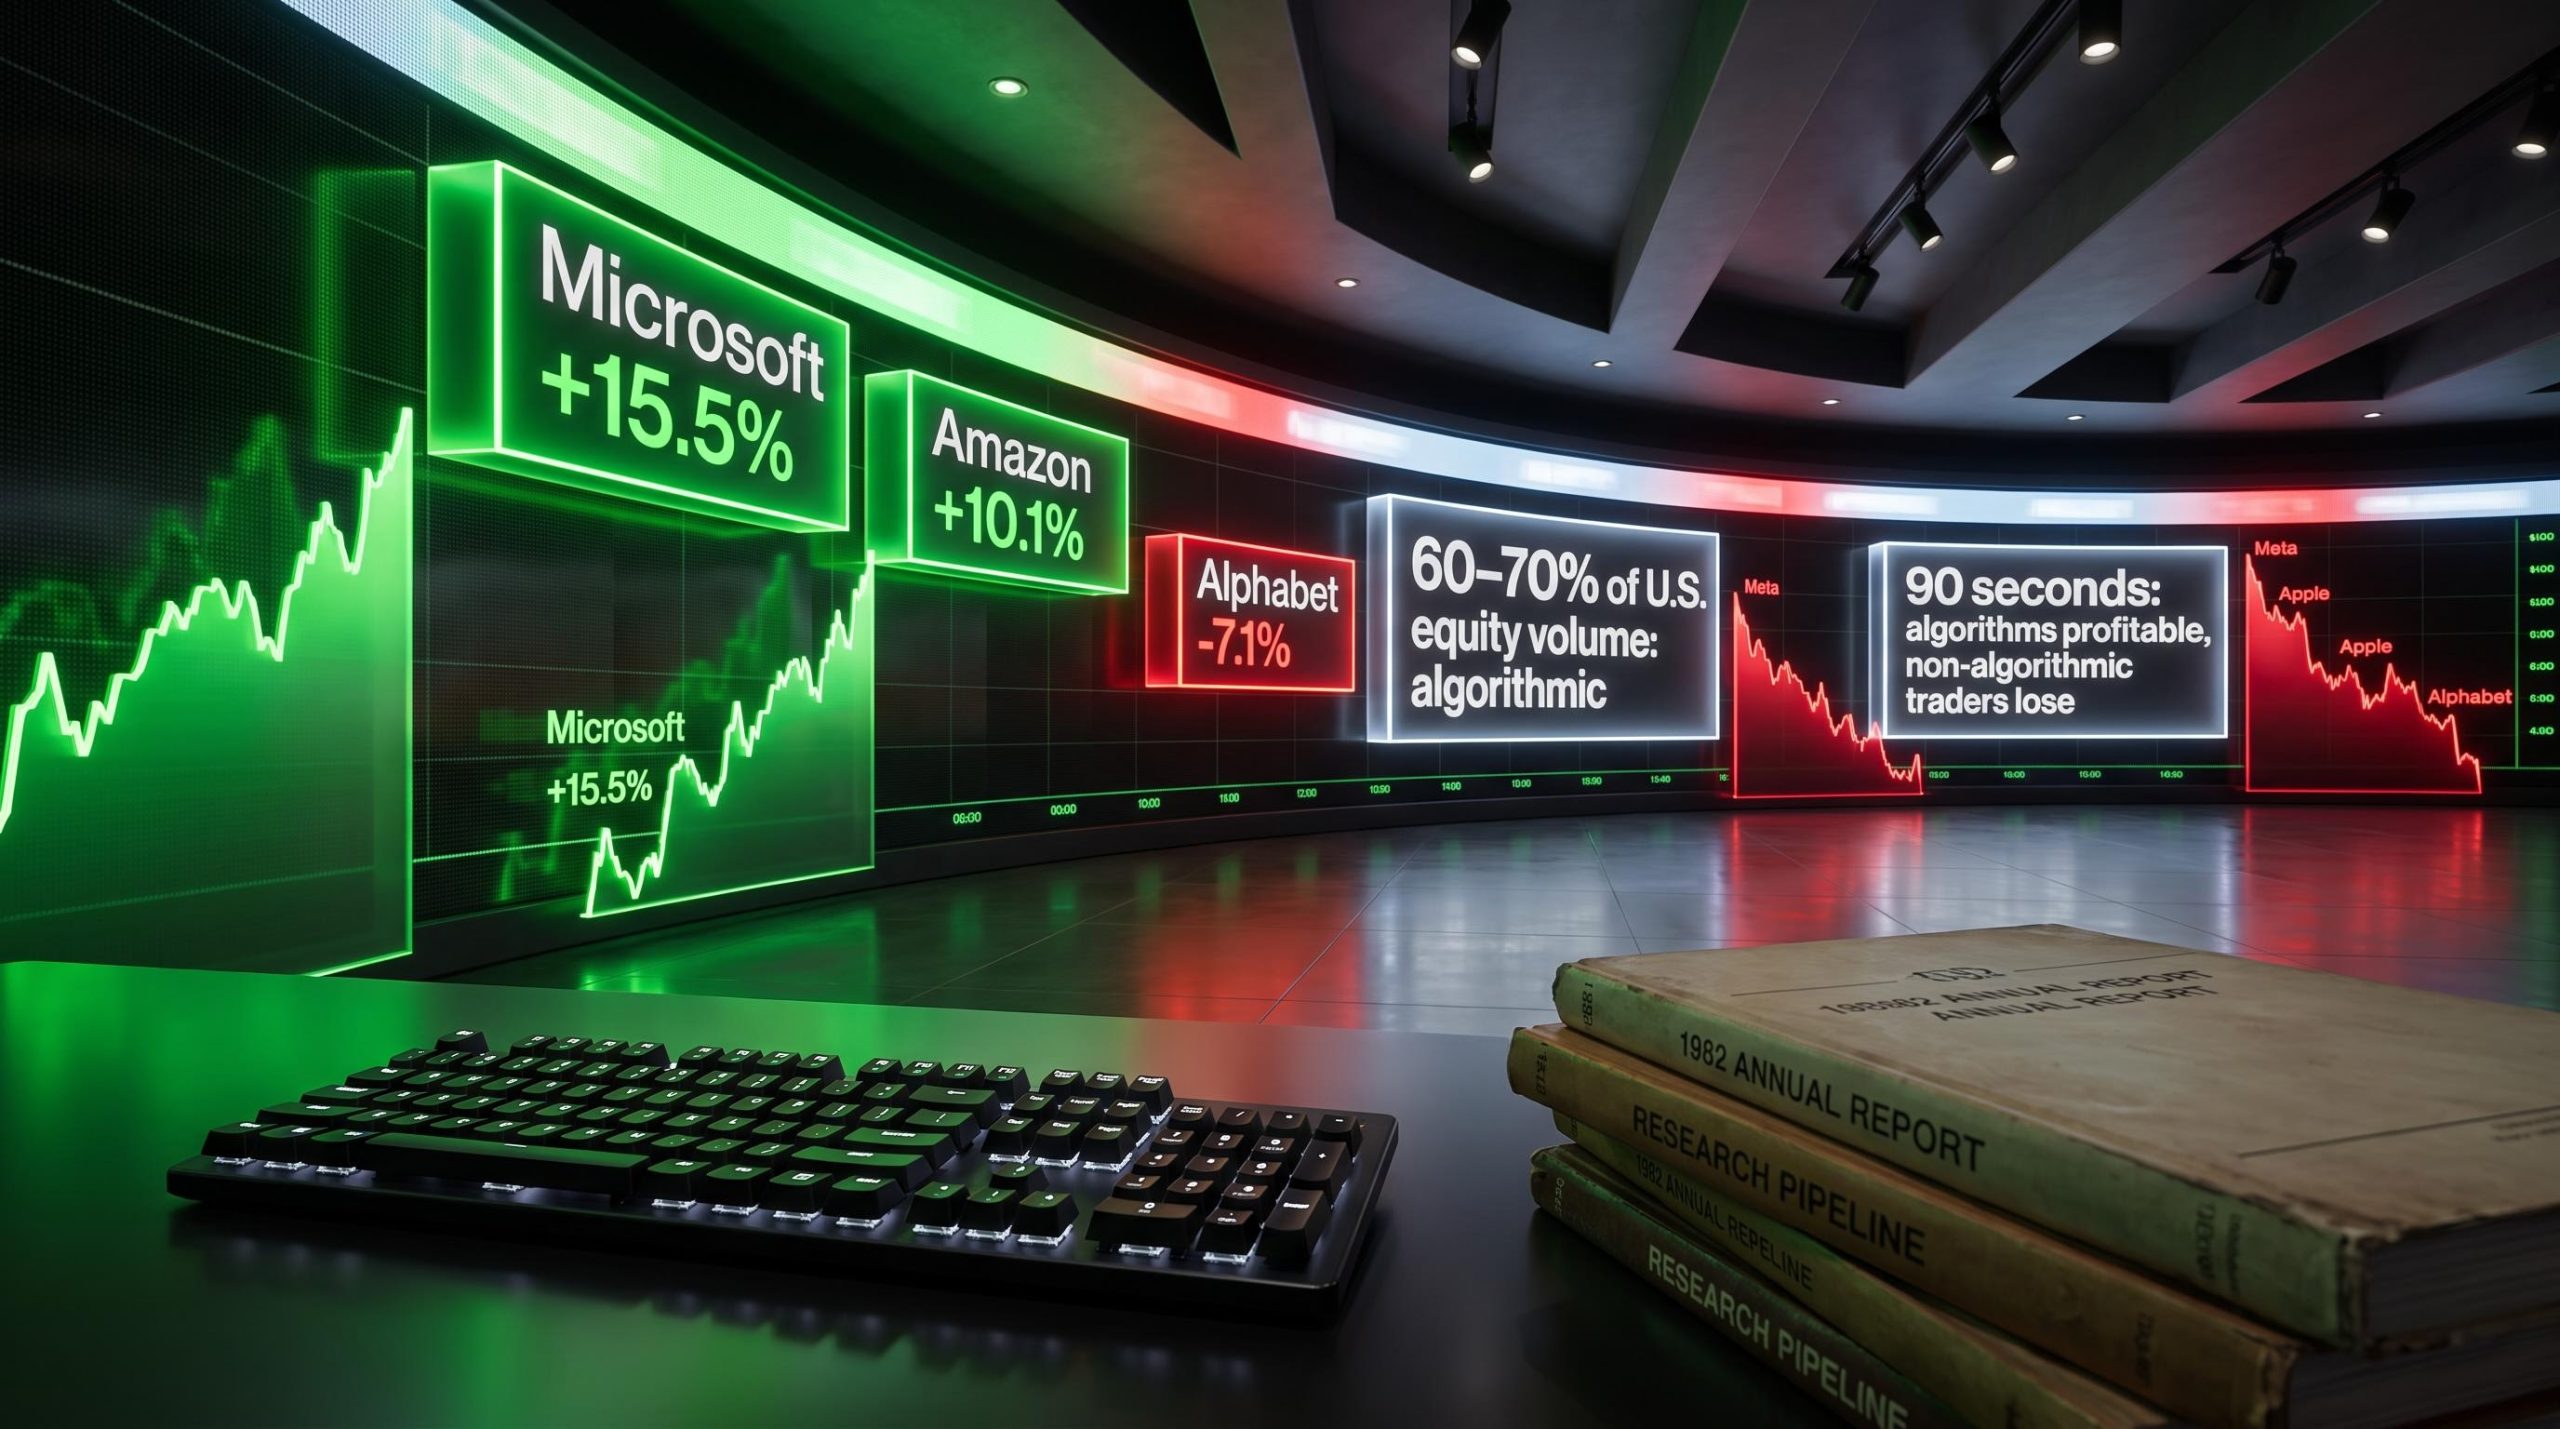
CTA positioning mechanics operate identically across asset classes: Goldman Sachs documented how the same rules-based threshold logic that can trigger $100 billion in mechanical equity selling also applies to commodity futures, with algorithm-executed flows compounding faster than any fundamental-driven market participant can respond.
The mechanics are straightforward. CTAs use systematic, rules-based models. Once gold futures clear specific price thresholds, around $4,222 and $4,300 according to Topstep’s weekly positioning note, those models flip from sell to buy. The buying is non-discretionary: it happens regardless of the trader’s opinion because the algorithm demands it. For you, that means if gold clears those levels, a wave of mechanical buying kicks in on top of whatever fundamental demand already exists, potentially amplifying the move.
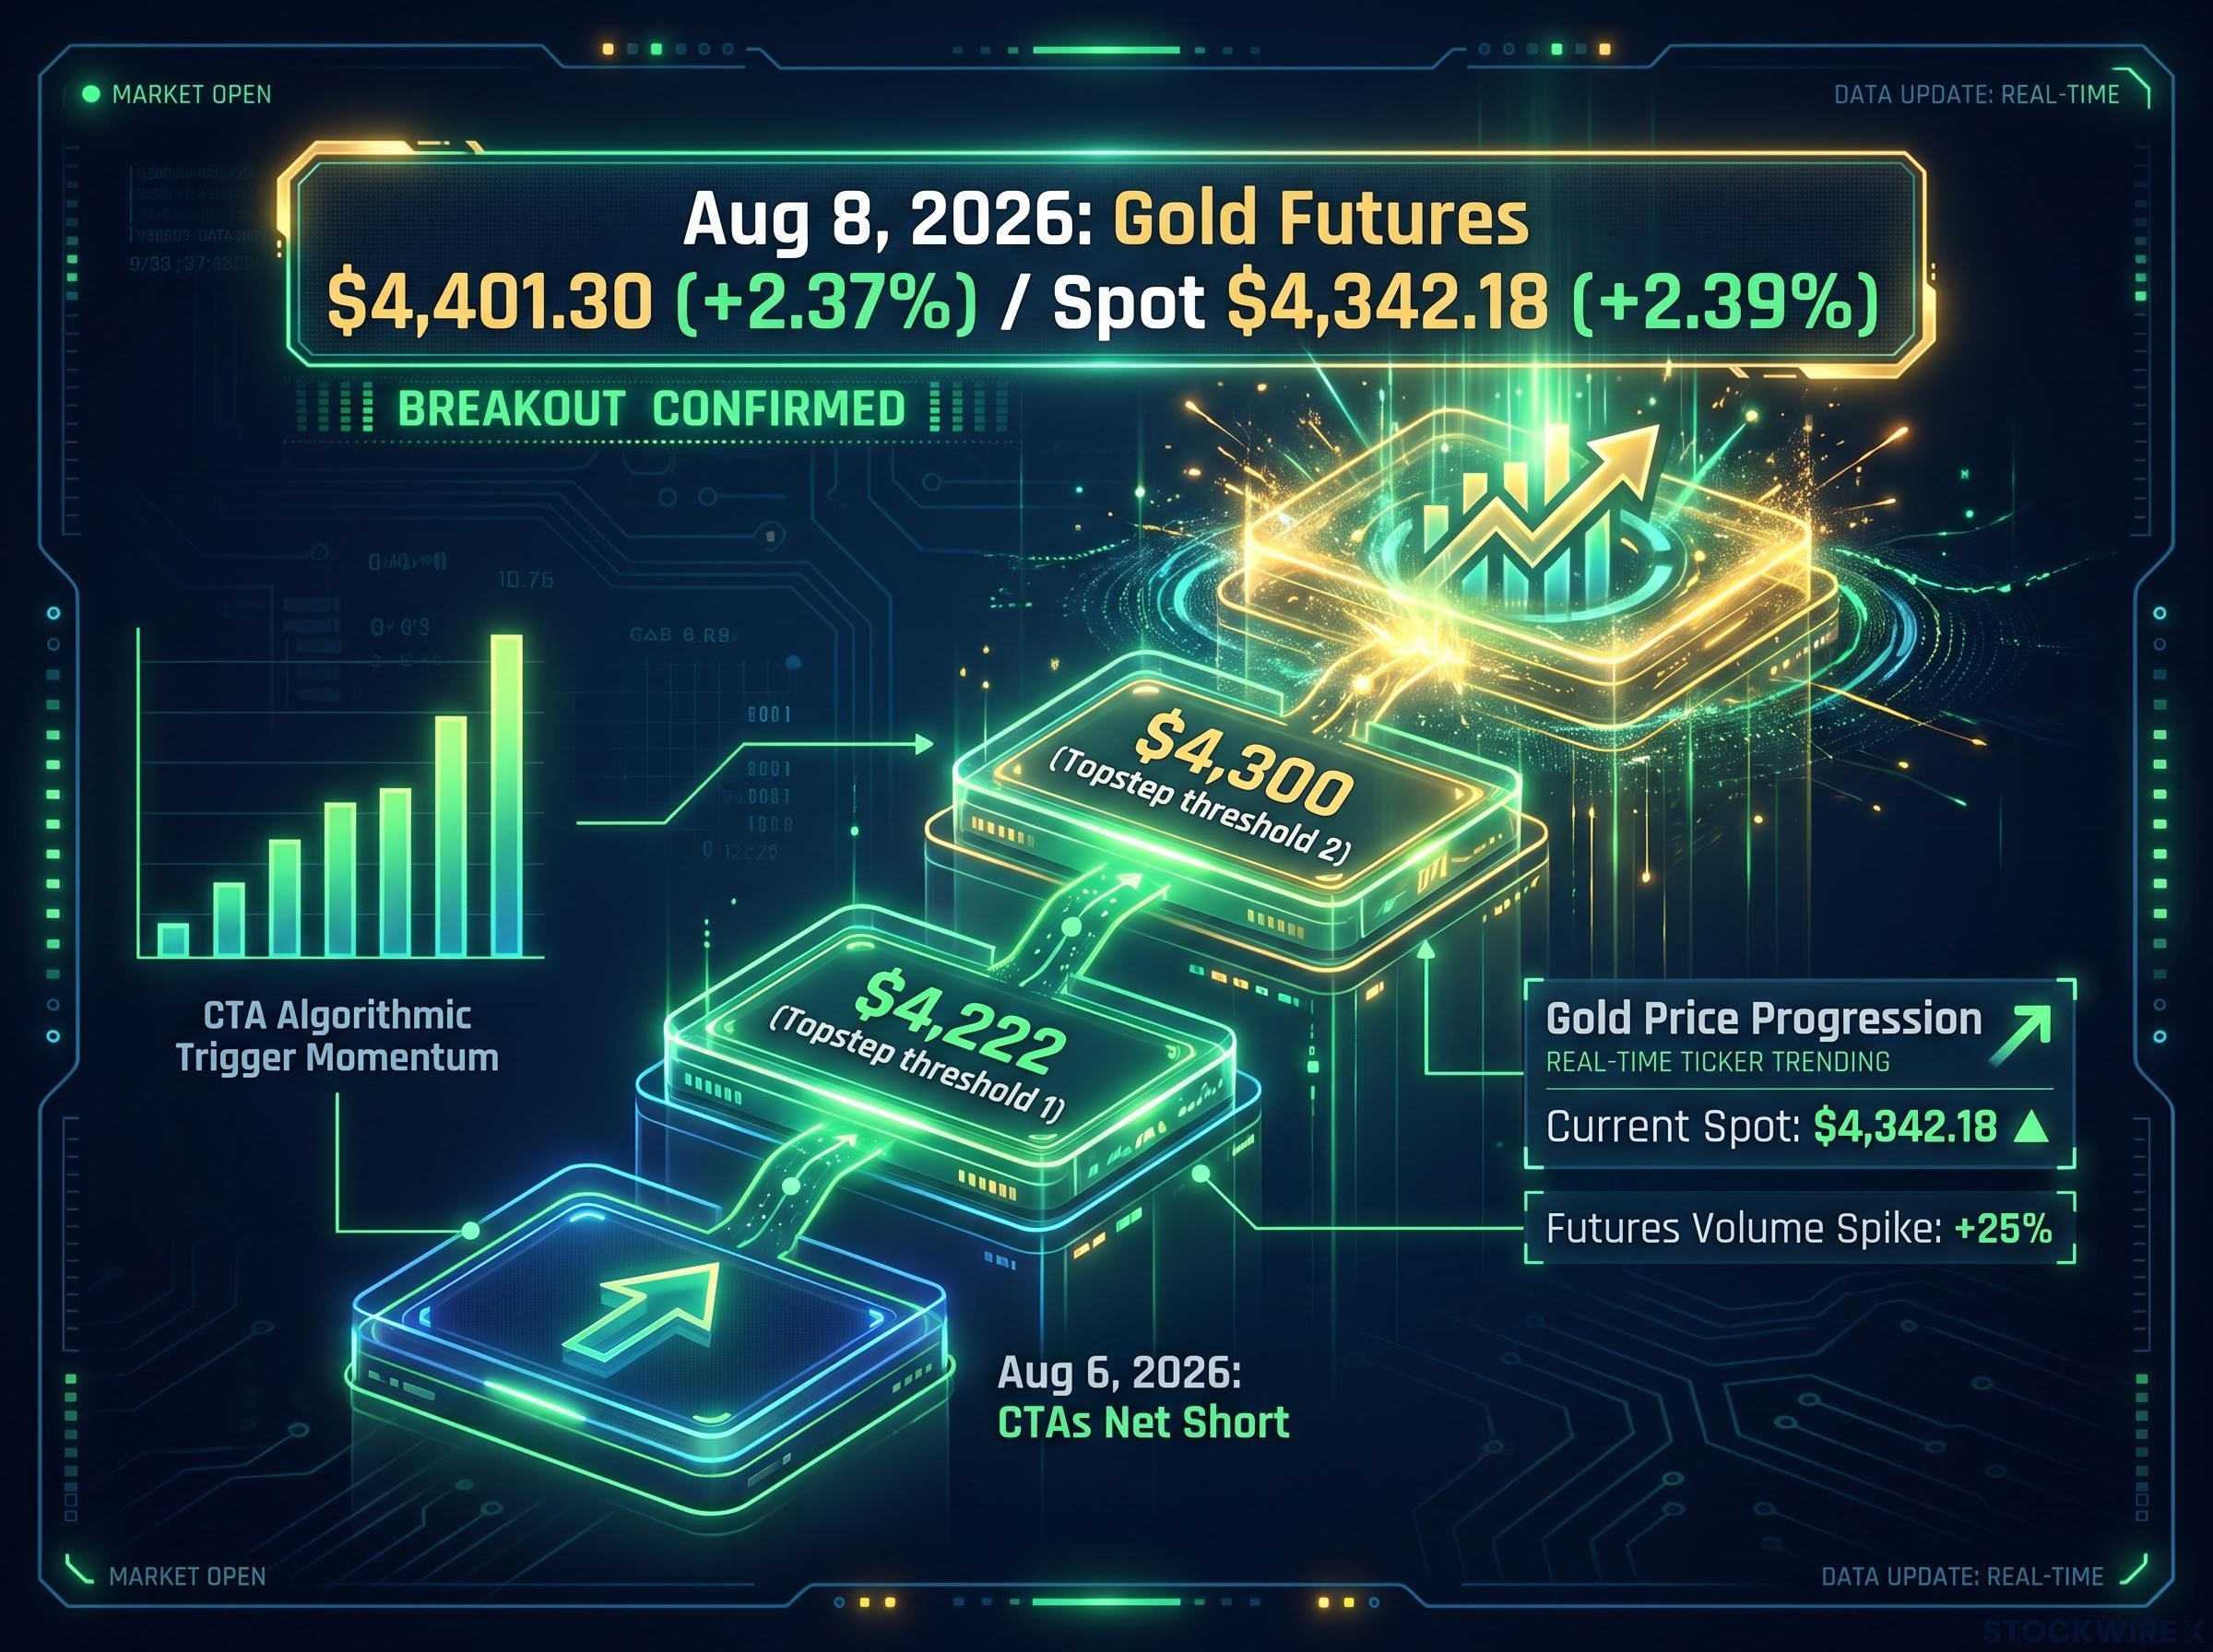
One point to hold for later: this fuel is finite. Once the shorts are covered, that tailwind disappears.
How the Fed and the dollar combine to lift gold demand
These two catalysts are not separate forces. They are a single compounding mechanism, and understanding the chain reaction is how you judge whether the setup is durable or a one-day spike.
The transmission works in three steps:
- Dovish Fed repricing pushes expected real yields lower, which reduces the opportunity cost of holding non-yielding assets like gold and silver (if bonds pay less, the penalty for holding gold instead shrinks)
- Lower rate expectations weaken the U.S. dollar
- A weaker dollar makes gold and silver cheaper in every other currency, widening global demand for dollar-denominated commodities
The real-time expression of this chain was visible on 8 August: the U.S. Dollar Index sat at approximately 99.48, down roughly 0.33% on the session.
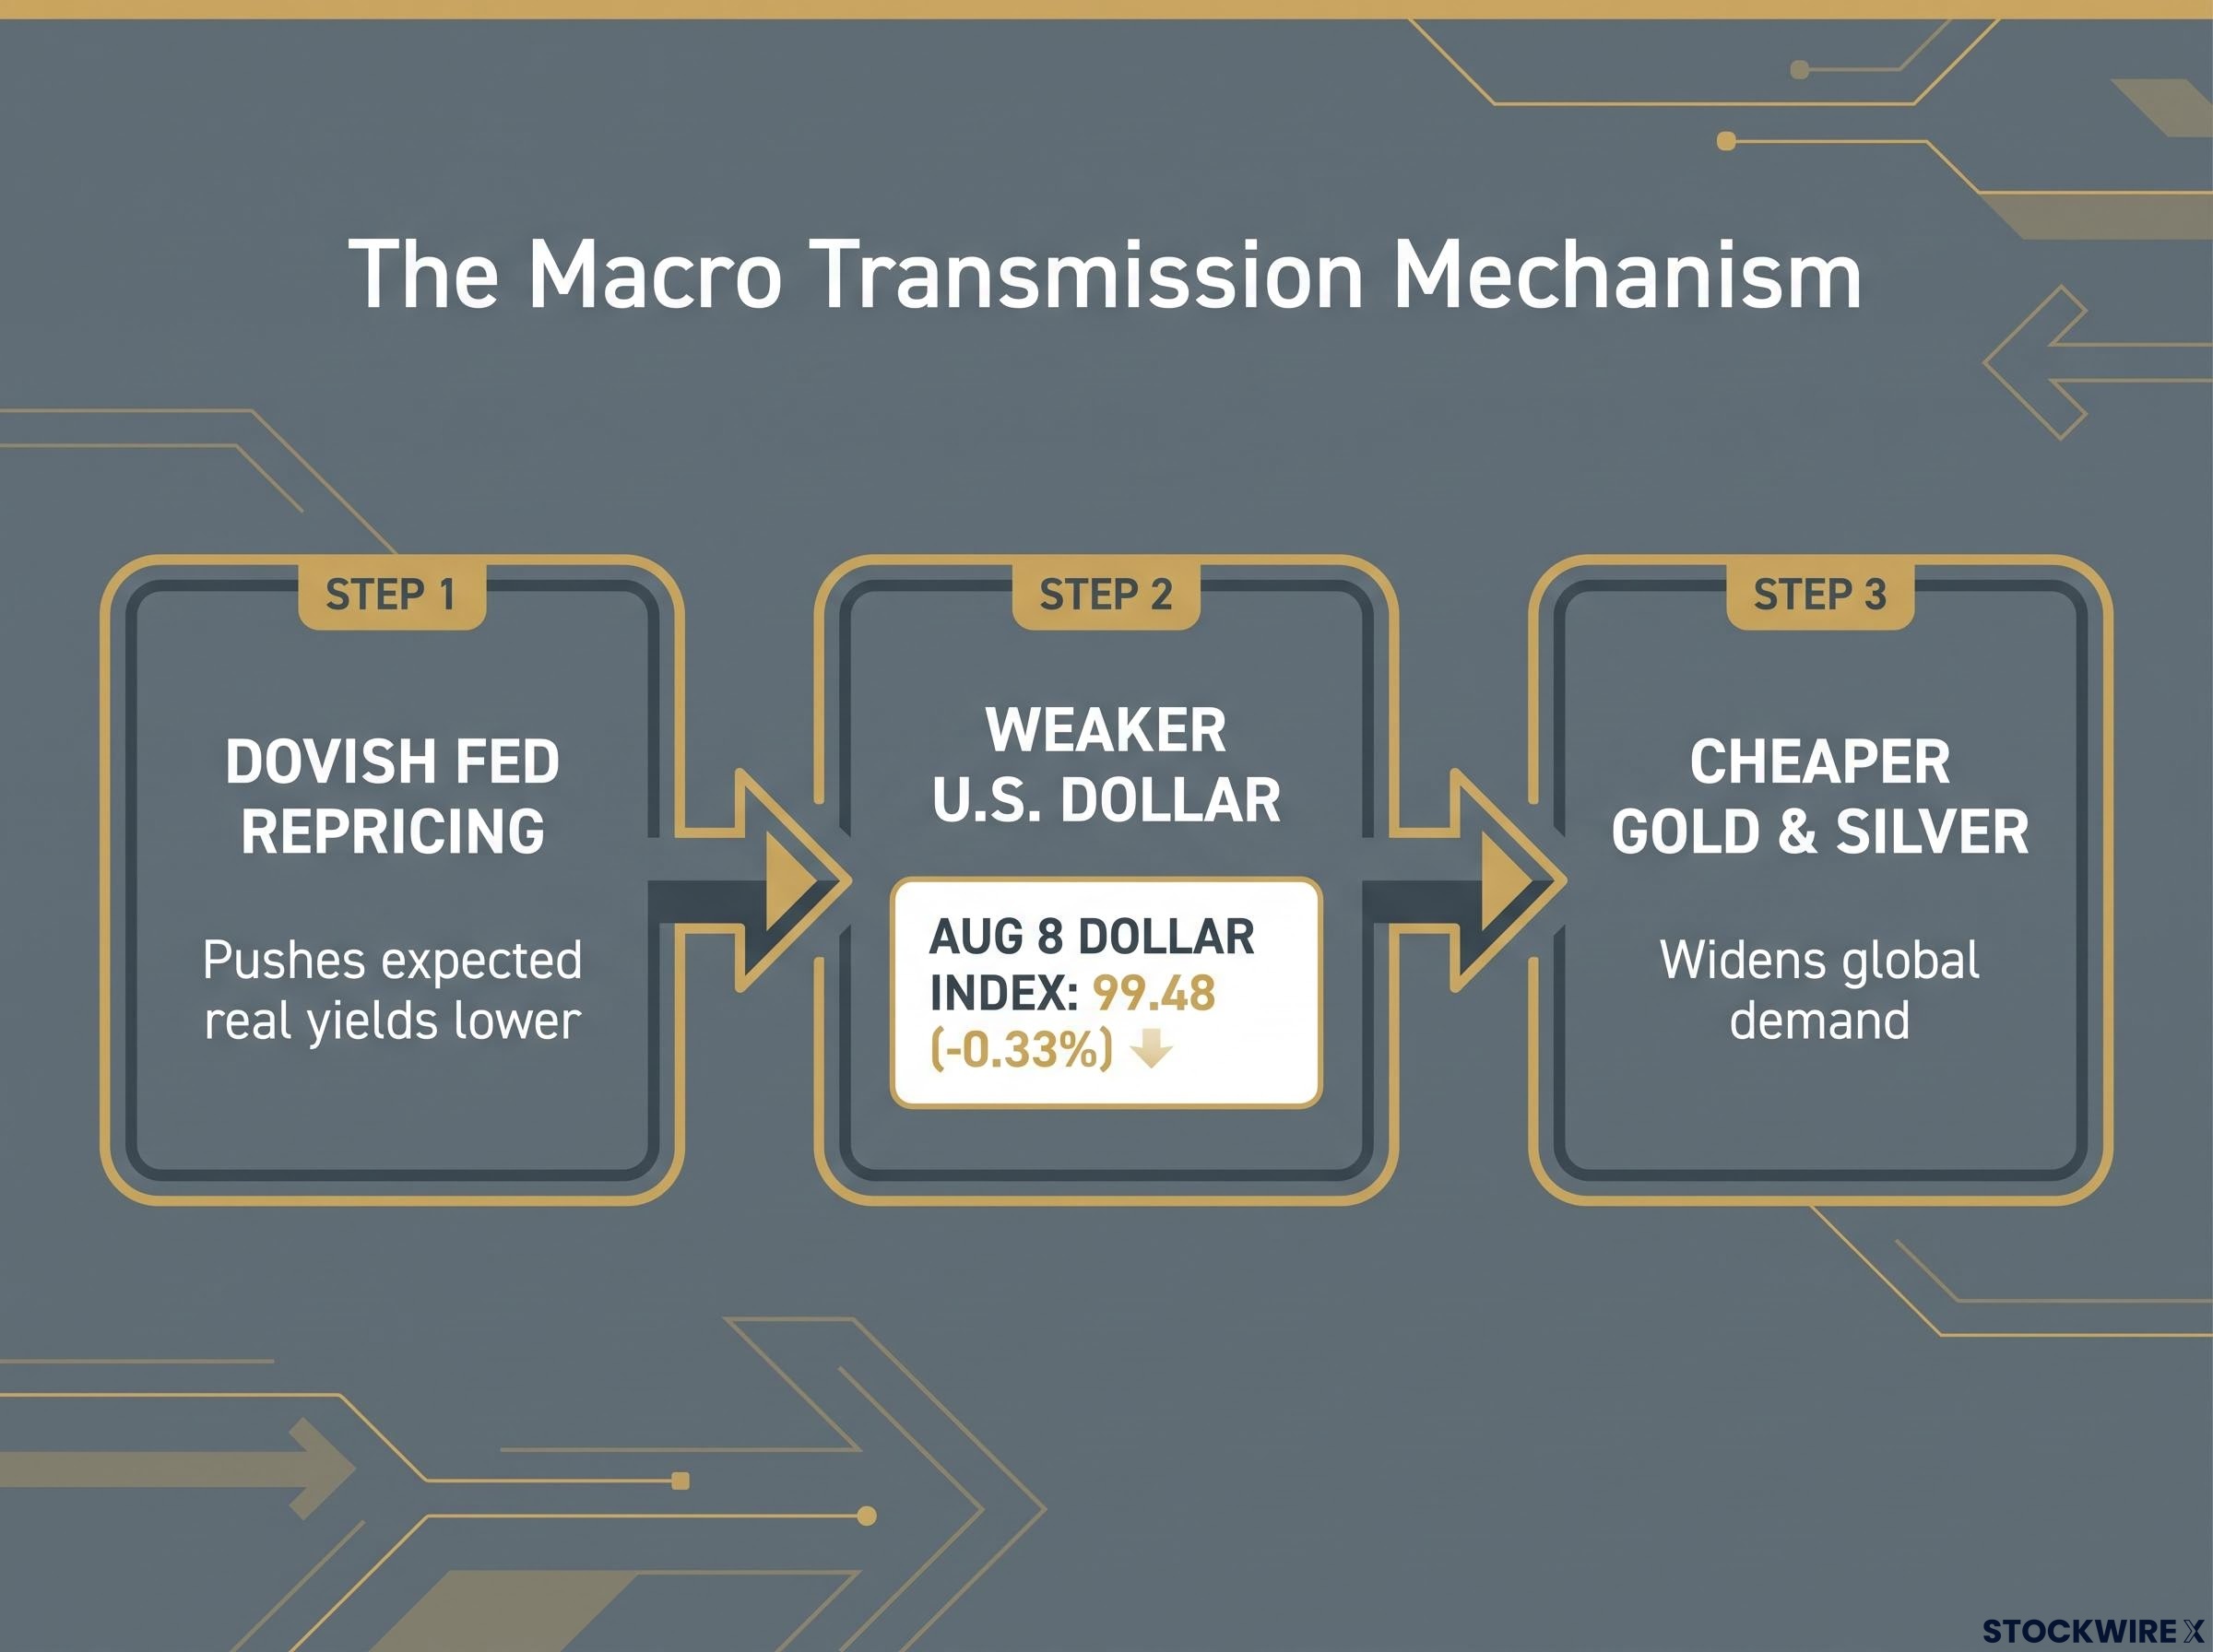
What matters for you is that both levers are pushing in the same direction simultaneously. Historically, that compounding effect, lower real yields plus a softening dollar, is among the most reliable setups for sustained precious metals strength rather than a single session’s enthusiasm.
The Federal Reserve FOMC policy calendar shows the committee held the federal funds rate steady at its most recent meeting, with a minority dissent favouring a cut, a posture that markets have interpreted as the opening of a dovish pivot window and the basis for Rubner’s repricing argument.
Central banks and sidelined retail: the structural floor and the latent fuel
Official-sector demand as a price floor
Central bank gold buying operates on a completely different clock to the positioning dynamics discussed above. Official-sector buyers are allocation-driven. They purchase gold as part of long-term reserve diversification strategies, not as tactical trades. That means they buy through corrections, not just at breakouts.
Figures compiled internally by Citadel Securities indicate that China has been stepping up its gold purchases on a month-by-month basis since at least December 2024. It is worth noting that this specific claim originates from Rubner’s internal data and has not been independently confirmed by external sources. The note from Citadel Securities also highlighted worries around Treasury and foreign exchange intervention as factors pushing official-sector buyers to increase their gold holdings as a reserve diversification measure.
Central bank de-dollarisation has accelerated since the 2022 freezing of Russian sovereign assets, with the OMFIF Global Public Investor survey recording the first instance on record of net dollar-reduction intent outnumbering net dollar-increase intent among sovereign institutions, a structural shift that makes the official-sector gold bid largely price-insensitive.
The practical effect is a structural floor beneath prices. Central banks are not going to sell into a dip; they are more likely to buy it.
Retail investors as latent upside fuel
In Rubner’s assessment, retail investors have largely directed their attention and capital toward the AI trade rather than precious metals, which has left a substantial pool of buyers who could yet re-engage with gold and silver.
The January-February 2026 rally is something Rubner cites as evidence of how rapidly retail participation can build once momentum in gold attracts broader attention. SLV is specifically identified as the higher-beta instrument where retail tends to concentrate once gold is already trending. Central bank demand creates the floor during selloffs. Retail re-engagement, when it arrives, tends to drive the acceleration phase, and silver is historically where that force lands hardest.
What Rubner’s framework gets right, and where the risks sit
The five-catalyst framework is internally coherent and corroborated by multiple independent sources. That does not make it a certainty. The honest framing is that it represents a high-conviction probability skew: the odds of upside have improved, but the risks are structural, not just tail events.
The setup improves the probability of upside but does not eliminate the risk of a sharp correction. Position sizing relative to the volatility of these instruments matters as much as the directional call itself.
Three specific risks deserve the same attention as the bullish case:
- Finite CTA fuel: Once mechanical short-covering is exhausted, that source of demand disappears entirely and the market becomes dependent on fundamental and discretionary buyers
- Silver volatility: Even within a broadly bullish scenario, silver is capable of significant drawdowns. Elevated and rising implied volatility in SLV means shakeouts can be abrupt and large.
- Macro persistence required: The compounding effect of dovish repricing and dollar weakness only works if those conditions persist. A hawkish surprise from the Fed or a dollar reversal could unwind the macro leg of the thesis rapidly.
Being right about direction without managing position size can still produce a poor outcome in instruments this volatile.
For investors wanting to stress-test the Rubner thesis against historical precedent, our full explainer on gold price prediction failures examines three documented rate cycles where gold produced outcomes that directly contradicted the most widely cited trading rules, including a 20% decline during the 2022-2023 period despite simultaneously positive macro conditions.
What the Rubner call actually changes for investors watching GLD and SLV
The thesis operates on two distinct time horizons, and separating them is how you turn an institutional call into a personally relevant decision.
| Time Horizon | What Drives It |
|---|---|
| Tactical (days to weeks) | CTA short-covering, options flow dynamics, momentum-driven buying |
| Structural (months) | Central bank demand, dovish Fed repricing, dollar weakness, retail re-engagement |
The tactical layer suggests the current move may have more to run as mechanical buyers are forced in. The structural layer argues that dips are more likely to be consolidations than secular tops, assuming the underlying macro drivers persist.
The gold price outlook for H2 2026 hinges on whether the Federal Reserve delivers one rate adjustment or initiates a multi-hike cycle, with the World Bank’s full-year average forecast near $4,700 per ounce representing the most conservative major institutional anchor and still implying significant upside from the levels that preceded the August rally.
The price action already underway on 8 August, with gold up 2.39% and silver up 3.36%, tells you that at least part of this thesis is already being priced in. The question is not whether Rubner is right. It is what your own time horizon and risk tolerance imply about whether this setup is relevant to your situation, and whether your entry point, position size, and exit plan are calibrated for the volatility that GLD and SLV carry even in a favourable environment.
This article is for informational purposes only and should not be considered financial advice. Investors should conduct their own research and consult with financial professionals before making investment decisions. Past performance does not guarantee future results. Financial projections are subject to market conditions and various risk factors.