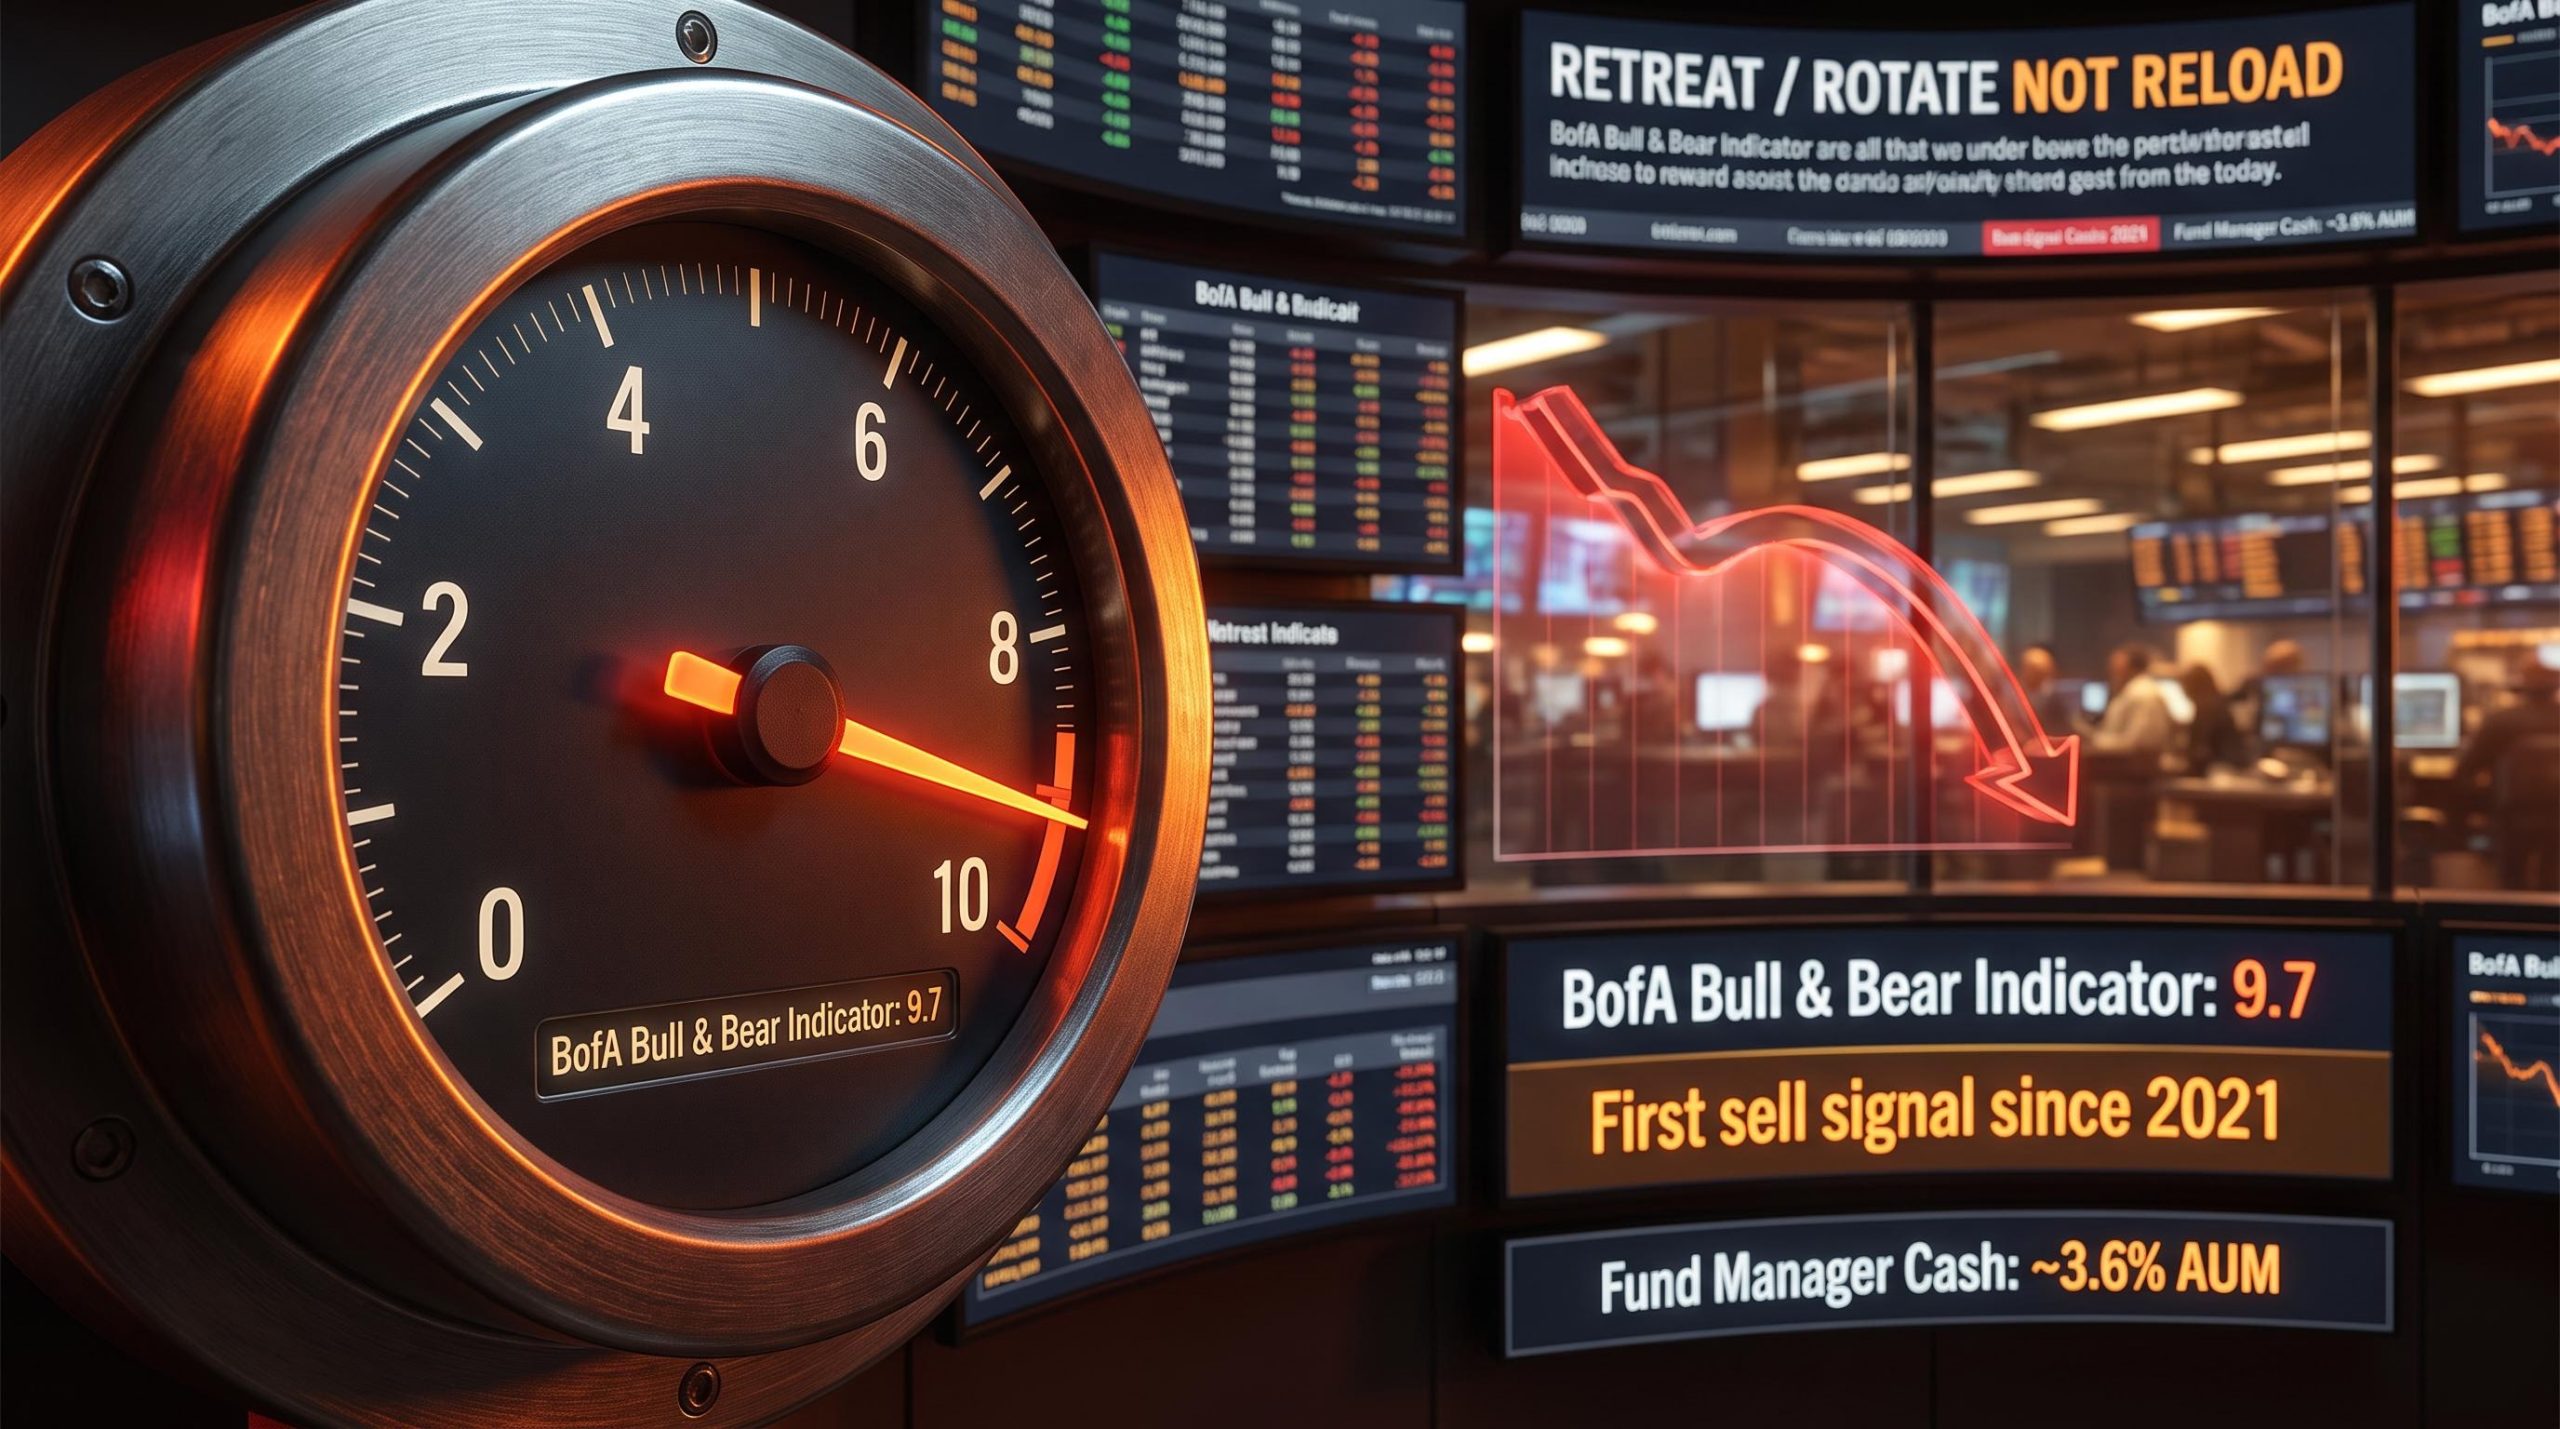
Bank of America’s proprietary sentiment gauge just hit 9.7 out of 10, and the firm’s chief investment strategist Michael Hartnett has issued the first formal sell signal for equities since 2021.
The BofA Bull & Bear Indicator is one of the most closely watched institutional positioning gauges on Wall Street. When it crosses into extreme-bullish territory, it historically signals that crowded optimism has pushed markets to a point where the risk-reward tilts toward caution. A reading of 9.7 does not mean a crash is coming. It means sentiment and positioning have left almost no room for disappointment.
Here is what the signal actually means for how you are positioned right now: what triggered it, what BofA is favouring and avoiding, and how to think about your own portfolio exposure heading into the second half of summer.
What the BofA Bull and Bear Indicator actually measures
The indicator is a proprietary blend of four inputs: institutional and hedge fund positioning, equity and bond flows, global stock index breadth, and credit market technicals (the spread and flow data from high-yield and investment-grade credit markets). It runs on a 0-to-10 scale. A reading near 0 signals extreme bearishness and acts as a contrarian buy signal. Readings above approximately 8 signal extreme bullishness and trigger a contrarian sell.
The word “contrarian” is the part that matters most. This is not a momentum tool. It is designed to flash a warning precisely when confidence is at its highest, because that is when the fewest new buyers remain and the market is most exposed to disappointment.
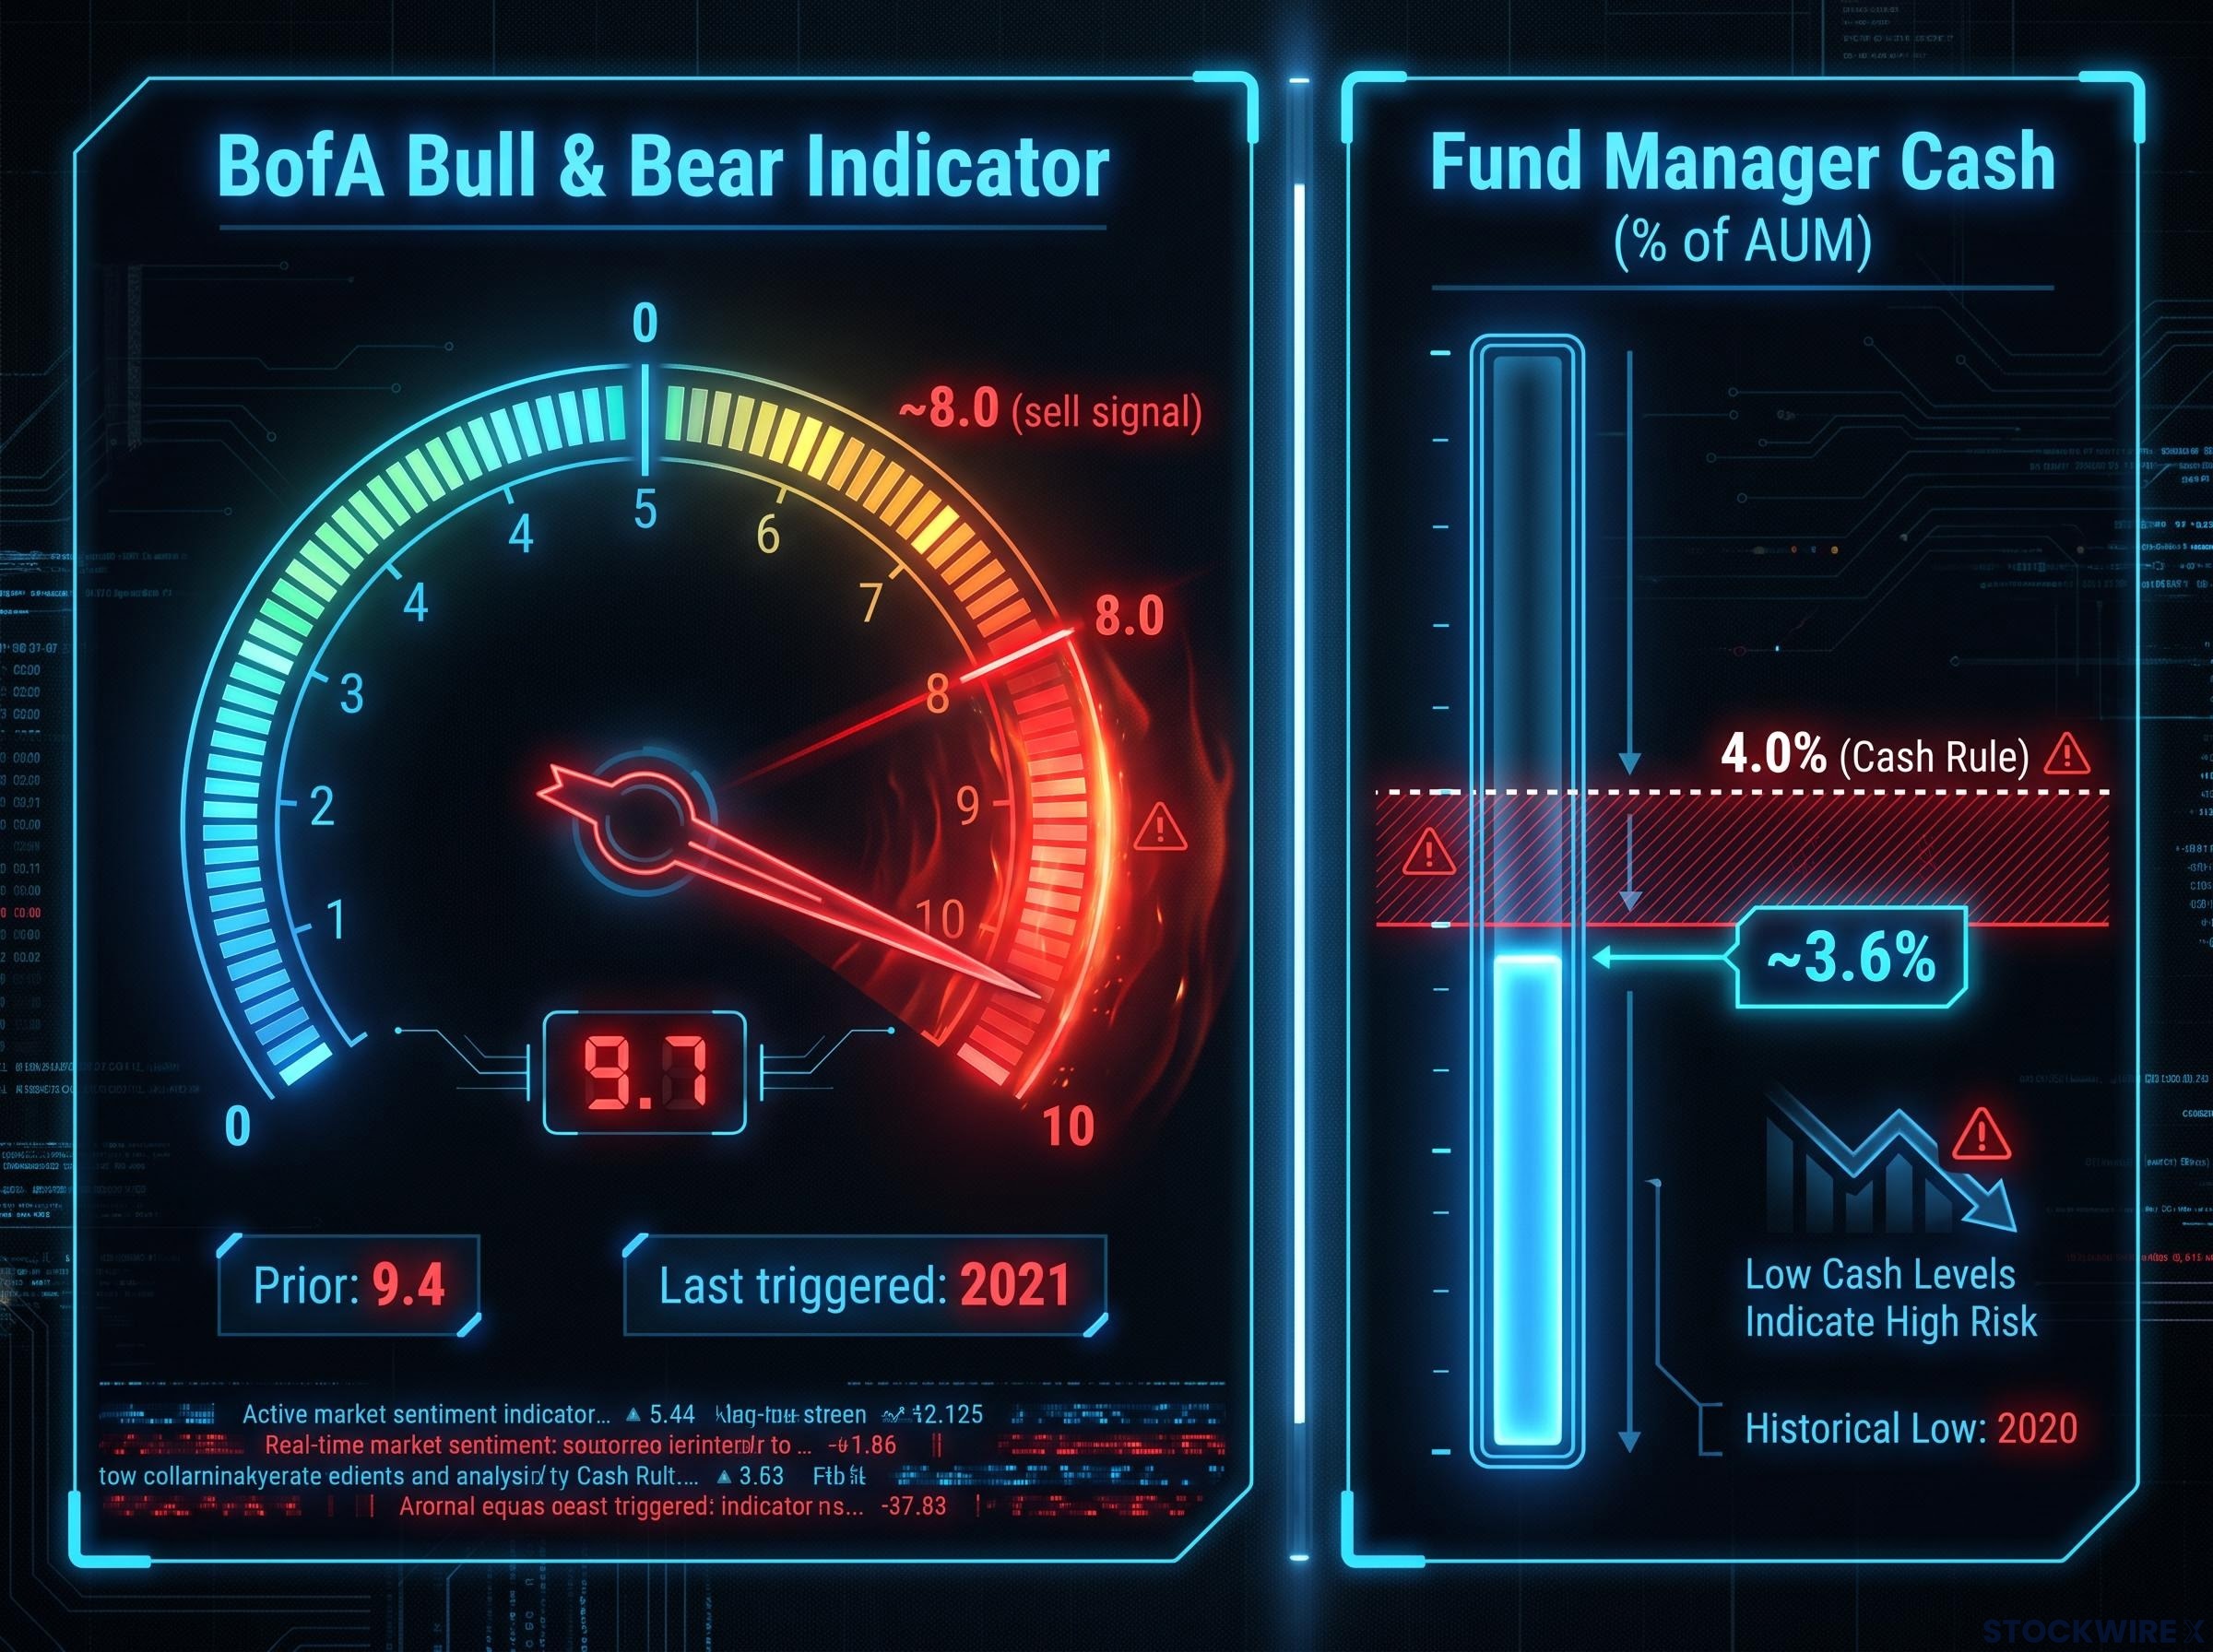
The gauge moved up from 9.4 to reach 9.7, a level not seen since 2021. That alone places the current reading well above the sell-signal threshold. But the indicator was not the only BofA gauge that fired.
The Cash Rule: a second sell signal firing alongside the indicator
Fund manager cash has dropped to approximately 3.6% of assets under management (AUM), the total value of investments a manager oversees. That sits below BofA’s Cash Rule threshold of 4.0%, which independently triggers its own sell signal. Low cash means managers are fully invested, leaving little dry powder to absorb a drawdown or deploy into a correction.
Two separate BofA thresholds firing simultaneously tells you the warning is not a single-metric quirk. It is a convergence of signals pointing in the same direction.
The BofA Global Fund Managers survey confirmed that cash levels fell to 3.6% of AUM in July, triggering the Cash Rule sell signal independently of the Bull and Bear Indicator reading, with the survey describing the cash level as ‘uber-low’ relative to recent history.
| Metric | Current Value | Threshold | Last Triggered |
|---|---|---|---|
| Bull & Bear reading | 9.7 | ~8.0 (sell signal) | 2021 |
| Prior reading | 9.4 | — | — |
| Sell signal threshold | — | ~8.0 | 2021 |
| Fund manager cash (% of AUM) | ~3.6% | 4.0% (Cash Rule) | — |
| Cash Rule threshold | — | 4.0% | — |
When big ASX news breaks, our subscribers know first
The specific factors behind the indicator’s recent surge
The jump from 9.4 to 9.7 was not driven by a single input spiking. It was a broad-based wave of risk appetite showing up across asset classes simultaneously. Four factors pushed the reading higher:
- Significant capital moving into high-yield funds, as investors sought exposure to below-investment-grade credit
- Credit spreads compressing across global high-yield and AT1 instruments (contingent convertible bonds issued by banks), indicating that risk premiums have been pushed to very thin levels
- Wider participation across global equity markets, with capital flowing into risk assets on a broad front
- Heavy inflows into technology equities specifically, cited directly in BofA’s analysis
When sentiment extremes appear across bonds, equities, and credit at the same time, the risk is more systemic than if only one asset class were overheated. That breadth is what pushed the reading so close to the gauge’s ceiling.
The current reading did not emerge in isolation; the fund manager survey warnings that preceded it documented the largest single-month equity allocation surge ever recorded, a 37-percentage-point jump to a net 50% overweight, providing the institutional positioning backdrop against which the 9.7 reading now sits.
The BofA strategy team, led by Michael Hartnett, described their summer positioning as “retreat/rotate not reload”, a signal to trim the most crowded positions rather than add fresh risk.
Tight credit spreads deserve particular attention. When investors accept thin compensation for lending to riskier borrowers, it historically marks late-cycle crowding, not healthy confidence. That pattern is visible right now across global high-yield markets.
Understanding the contrarian logic: why extreme optimism is a warning signal
The instinct is natural: strong markets and confident investors feel like reasons to buy. The contrarian logic runs in the opposite direction. When nearly all investors are already bullish and positioned long, the marginal buyer pool shrinks. There are fewer participants left to push prices higher, and any negative catalyst can trigger selling from a crowded position.
BofA’s own framing captures this dynamic in a single phrase: “priced for perfection.” The market is currently pricing in four consensus assumptions:
Sentiment indicators from major banks have been converging on the same cautionary reading across institutions; Goldman Sachs’s US Equity Sentiment Indicator reached 1.7 at its own threshold, a level historically linked to below-average S&P 500 returns over the next two to eight weeks, reinforcing that BofA’s signal is not an isolated institutional view.
- A soft or non-existent economic landing, with no recession materialising
- The Federal Reserve holding rates steady rather than resuming hikes
- Sustained AI capital spending with no meaningful cutbacks from major players
- No significant political headwinds from upcoming electoral cycles
For your existing positions, “priced for perfection” is the most important phrase in this section. It means holdings may already reflect the best plausible outcome, and even mildly disappointing news could disproportionately affect prices.
What history says about how these signals have played out
A sell signal is not a crash forecast. According to research compiled by Perplexity (not independently verified by StockWire X), the MSCI All Country World Index has historically experienced average pullbacks of approximately 2-3% following extreme sell signals, with maximum drawdowns around 8-9% over the subsequent three months. Those figures describe consolidation risk, not catastrophe.
The last time the indicator reached this territory was 2021, giving useful recency context but a limited sample size. Understanding that post-signal outcomes have historically been manageable helps calibrate the appropriate response: review and adjust, not panic.
Where BofA sees risk concentrated this summer
The sectors BofA considers most exposed share three characteristics:
- Large, sustained inflows over recent months
- High beta, meaning high sensitivity to growth expectations and liquidity conditions
- Stretched valuations relative to earnings fundamentals
Those three features converge in mega-cap growth and AI-linked technology, which attracted the equity inflows that drove the indicator’s latest jump. Semiconductors, banks, and industrials are identified by BofA as areas carrying greater cyclical vulnerability, making them candidates for reduction or avoidance. Consumer cyclicals, while not singled out by name, typically underperform when financial conditions tighten.
The compression of credit spreads alongside heavy equity inflows compounds the risk. Both signals point to crowded optimism in the same direction, meaning a sentiment reversal would hit these positions from multiple angles at once.
If you hold a technology-heavy portfolio or a broad market index with significant mega-cap concentration, your current exposure sits where the most crowded positioning is.
| Favoured | Less Preferred |
|---|---|
| Consumer staples, healthcare | Mega-cap growth, AI-linked technology |
| REITs, biotech | Semiconductors |
| Small-cap equities | Banks, industrials |
| High-quality bonds | Consumer cyclicals |
| US dollar | High-beta thematic ETFs |
New portfolio focus: BofA’s guidance for a defensive tilt
Hartnett’s team is not recommending an exit from equities. The guidance is a tactical tilt, rotating away from the most crowded high-beta trades and toward assets with lower correlation to a sentiment-driven pullback. The five favoured categories, each with a specific rationale:
- Consumer staples and healthcare: Resilient earnings streams and dividend income provide a buffer, with limited sensitivity to growth disappointments
- REITs and biotech: Longer-duration assets that stand to benefit as capital rotates away from crowded trades; both are specifically highlighted in BofA’s repositioning framework
- Small-cap equities: Identified as a target for redeployed capital, pointing to a rotation that seeks upside from a regime change rather than mere capital preservation
- High-quality bonds: Yield collection with lower equity volatility, a way to maintain income while reducing portfolio beta
- US dollar: Positioned to hold value during risk-off periods, and explicitly referenced within BofA’s defensive recommendations
Record bond inflows of $39 billion in the week ending 5 June 2026 captured the early phase of this defensive rotation in real time, with the Bull and Bear Indicator already sustaining a sell signal for three consecutive weeks and US growth equity funds recording their largest single-week outflow since December 2025.
Fund manager cash sitting at 3.6% of AUM, below the 4.0% Cash Rule threshold, reinforces why building a cash or bond buffer matters at this stage. Managers themselves have almost no dry powder left.
The inclusion of small-cap equities and biotech alongside traditional defensives signals that BofA’s rotation is not purely about surviving a pullback. It is about positioning for assets that could benefit from a regime shift, not just endure one.
What this signal means for how you are positioned right now
The practical translation starts with three steps, in order:
- Audit concentration in crowded risk trades. Check your portfolio weight in large-cap growth, AI-heavy technology, high-beta thematic ETFs, and any leveraged strategies. If these positions have drifted to a disproportionately large share, the risk-reward math has shifted.
- Assess whether your portfolio has ballast. Defensives, bonds, or a cash buffer all serve this function. If your entire allocation is pointed in the same direction as the crowded consensus, a single assumption breaking down affects everything simultaneously.
- Avoid adding new leverage or doubling down on the most crowded trades at this stage. The “retreat/rotate not reload” principle means the conviction threshold for new high-beta commitments is higher than it was a month ago.
Two metrics to watch as the summer unfolds
Two forward indicators will confirm or contradict the signal in real time:
- High-yield credit spreads: A sudden widening would be consistent with the risk-off scenario the indicator warns about. If spreads stay compressed, the cautionary signal weakens.
- Equity fund flow data: A reversal from inflows to outflows would reinforce the sell signal. Sustained inflows would suggest the crowding has further to run before reversing.
The practical takeaway for most readers is not that you need to act today, but that this is a moment to review, not a moment to add. The risk-reward has shifted enough that new commitments to the most crowded trades require stronger conviction than they did four weeks ago.
For investors wanting a step-by-step framework for executing the concentration audit the signal demands, our dedicated guide to portfolio rebalancing after an equity rally covers drift identification, rebalance triggers, and tax-efficient execution sequencing for portfolios carrying oversized equity positions.
This article is for informational purposes only and should not be considered financial advice. BofA’s signal and commentary are tactical in nature and are not personalised investment advice. Investors should conduct their own research and consult with financial professionals before making investment decisions. Past performance does not guarantee future results.
The signal fired, but the summer is not over
The BofA Bull & Bear Indicator at 9.7 is the first sell signal since 2021, and it represents a genuine shift in risk-reward. But it is not a binary event. It is a prompt for recalibration rather than panic.
The governing principle remains: “retreat/rotate not reload.” That means incremental adjustment, watching real-time data, and steering away from the most crowded trades. It does not mean liquidation.
As fund flows and credit spreads evolve over the coming weeks, they will tell you whether the signal is being validated or fading. That is the watch item for the second half of summer.