The S&P 500 and the Nasdaq Composite are sitting at record highs. Yet on 6 October, the Russell 2000 fell 0.6% to 2,830.30, slipping while the big indexes climbed. That split is the signal to decode in any Fed minutes market analysis before today’s release, because it shows how rate expectations are landing across the market.
The minutes from the September Federal Open Market Committee (FOMC) meeting are due today, 7 October, at 2:00 p.m. ET. The FOMC is the Federal Reserve committee that sets US interest rates. The minutes arrive after a rapid collapse in October hike odds, a softer dollar and a broad rally in risk assets.
That backdrop raises the stakes. If the committee’s reasoning differs from what markets have priced, positions built on the recent rally could reprice quickly.
Here is how to read the minutes against current pricing, which assets carry the most exposure in each scenario, and how one macro trader is using defined-risk option spreads to hold his views through the event.
What do record large caps and a lagging Russell 2000 really say about rate expectations?
On the surface, 6 October looked like a clean win for bulls. The S&P 500 rose 0.6% to a record close, and the Nasdaq Composite added 0.4% to 27,599.79, extending the high it set a day earlier.
Record confirmed According to AP, the S&P 500 “topped its prior record set in August.”
Sources differ on the exact S&P 500 close. Investing.com reported 7,820.85, while another market report put it at 7,818.93; both agree it was a record.
| Index | 6 October move | Level | Signal |
|---|---|---|---|
| S&P 500 | +0.6% | 7,818.93-7,820.85 (sources differ) | First record close since mid-August |
| Nasdaq Composite | +0.4% | 27,599.79 | Extending prior day’s record |
| Russell 2000 | -0.6% (-16.84 points) | 2,830.30 | Downtrend since Jackson Hole |
The Russell’s timing is the giveaway. Its downtrend began after the hawkish Jackson Hole speech by the Fed chair, the same moment the two-year Treasury yield hit its low and started rising. Small-cap weakness has tracked rising rates.
Three mechanisms explain the gap:
- Debt structure: small caps carry more floating-rate or short-maturity debt, so higher policy rates reach their funding costs faster.
- Cyclical earnings: their profits cluster in industrials, consumer discretionary and regional financials, which suffer first when growth slows or credit tightens.
- Mega-cap concentration: a handful of cash-rich technology and communication-services giants drive the S&P 500 and Nasdaq, so records can coexist with weak breadth.
Views split on the meaning. Some see a warning that policy is already restrictive enough to hurt leveraged firms; others see a repricing of weak balance sheets after a strong run.
Small-cap quality is another reason weak balance sheets are being repriced: nearly half of Russell 2000 companies are now unprofitable, so the index is more exposed to tighter credit than its history suggests.
Either way, record index levels can hide narrow leadership. For you, the Russell is the better gauge of how tight financial conditions feel to leveraged companies, and it is likely to react differently to the minutes than the large caps.
When big ASX news breaks, our subscribers know first
How far have hike odds really fallen, and what do the dot plot and PCE say?
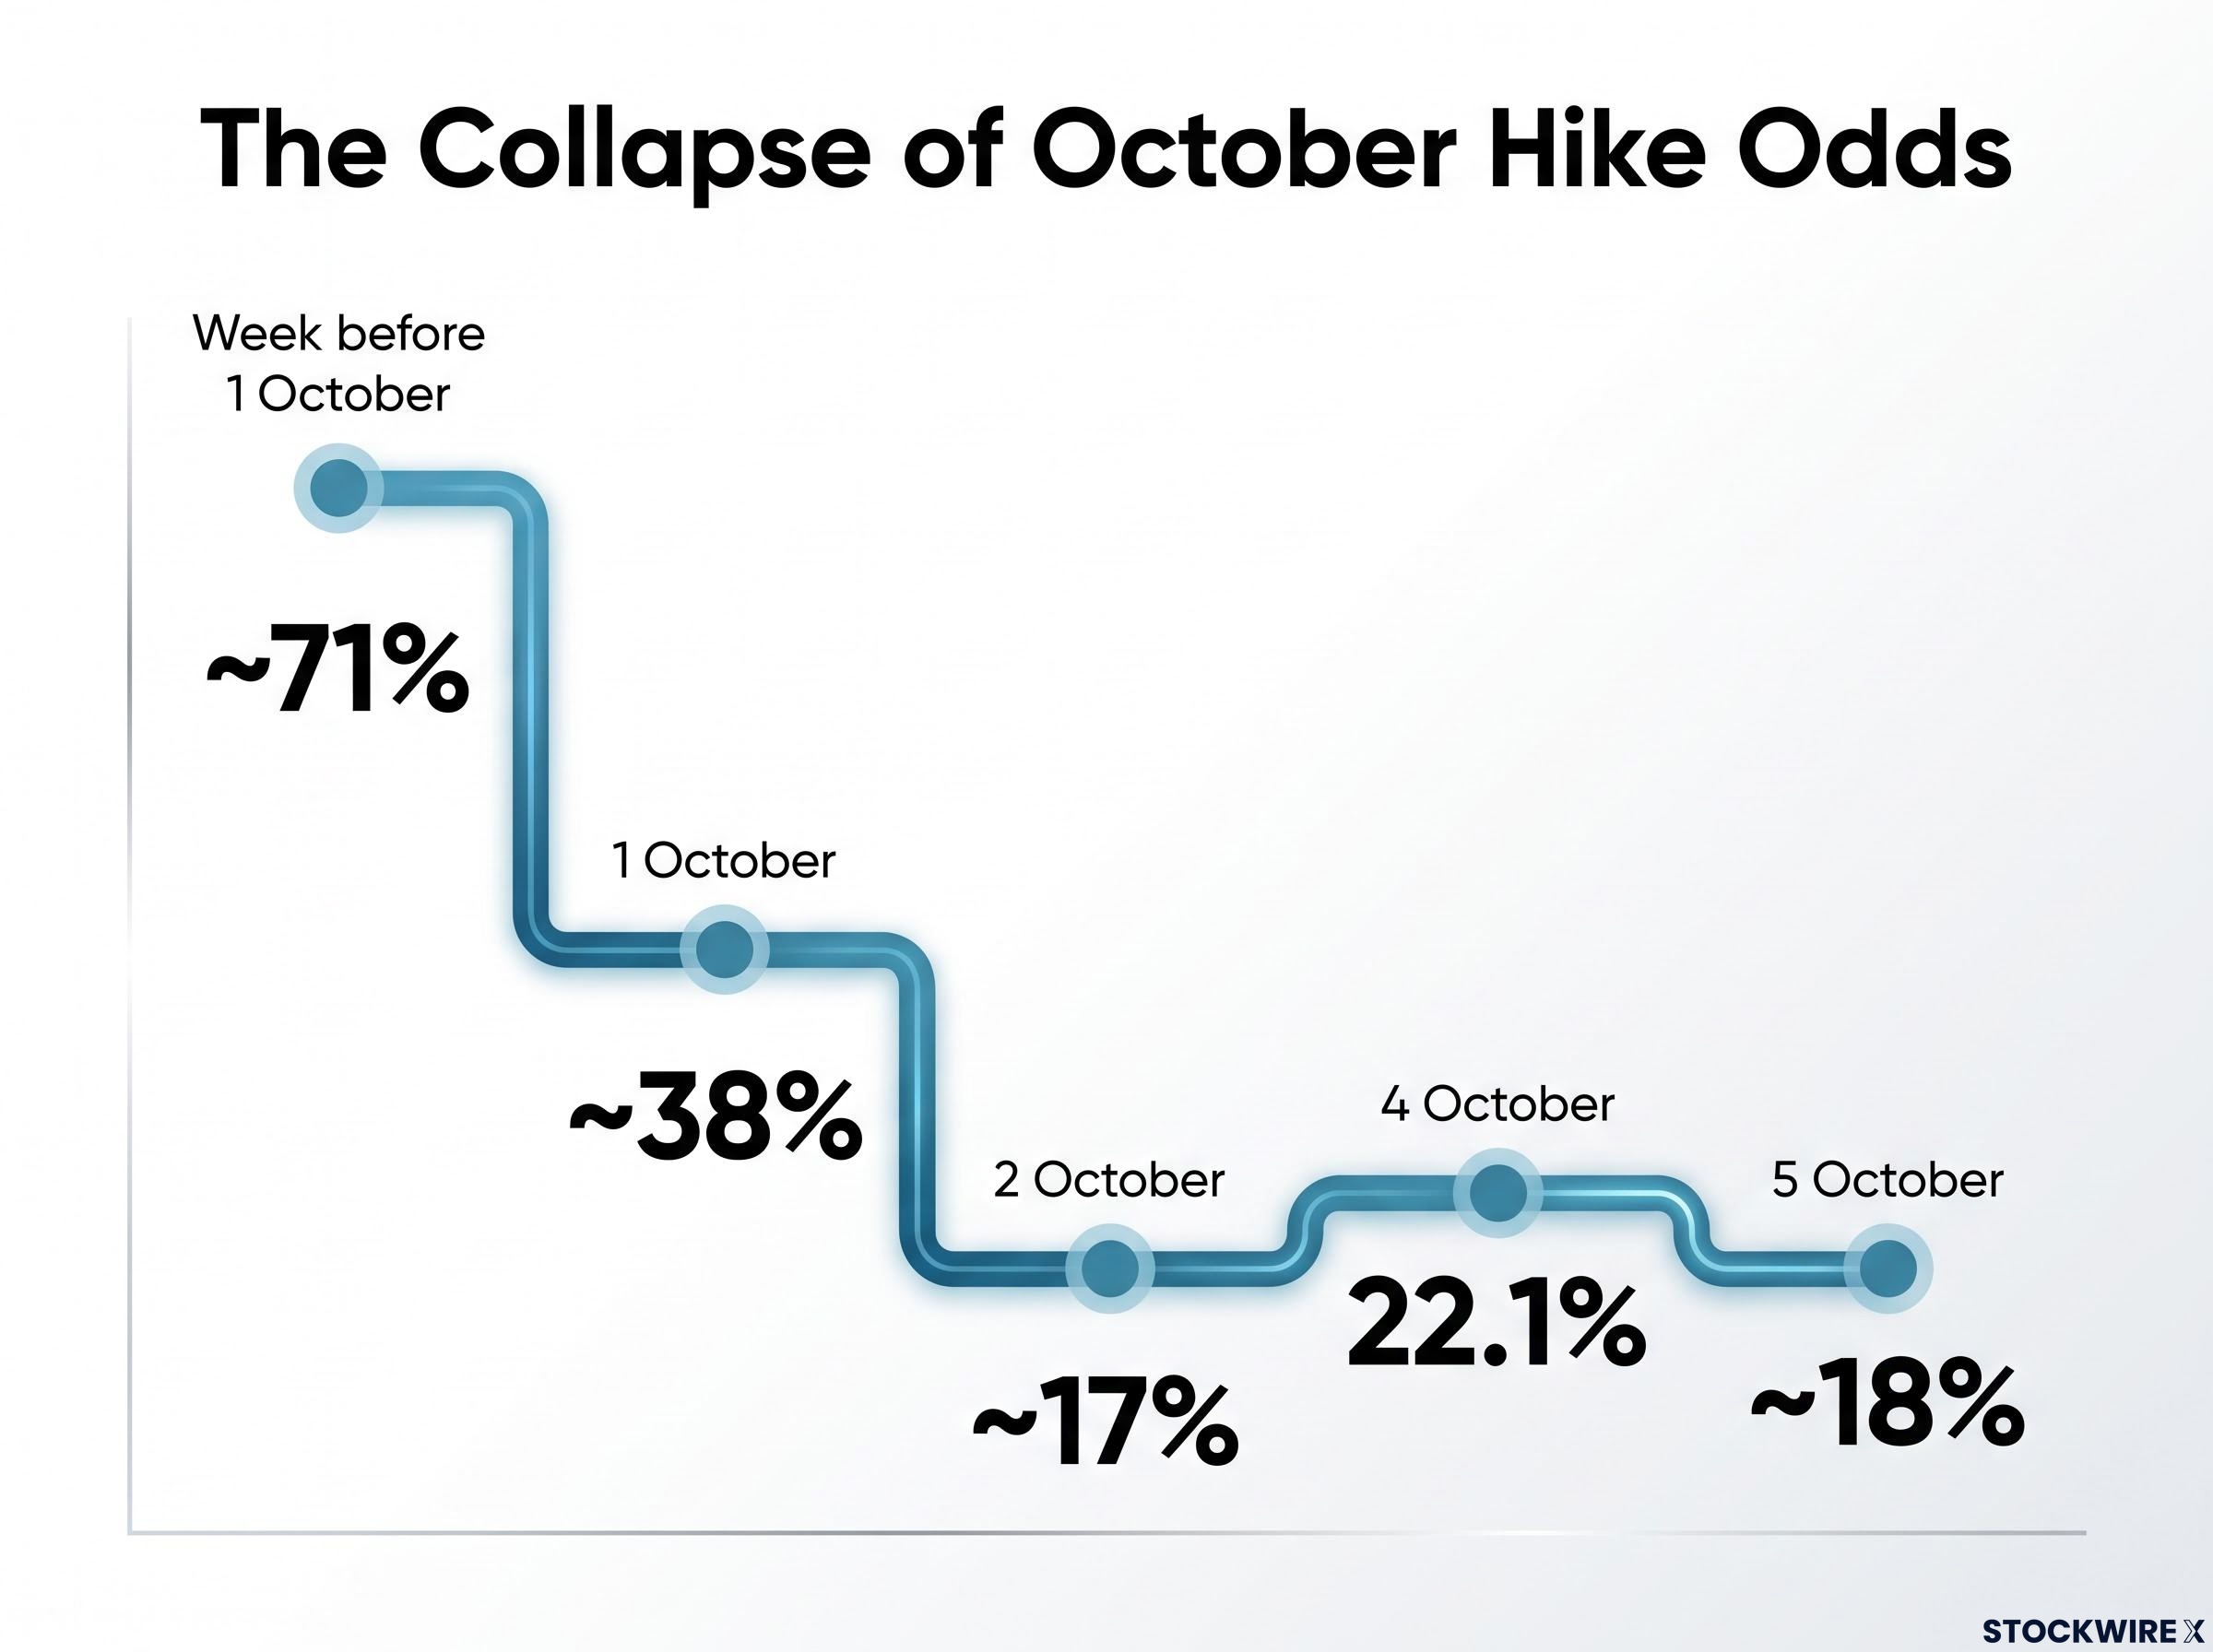
A week before 1 October, futures markets priced nearly 71% odds of an October quarter-point hike. By the prior session the figure was roughly 51%. On 1 October, Reuters reported about 38%, as Goldman Sachs pushed its next-hike forecast out to December after a softer inflation reading.
Then the September jobs report came in weaker than expected, and October odds fell to between 17% and 22%.
| Date | Source | October hike odds | December hike odds |
|---|---|---|---|
| 1 October | Reuters | ~38% | Goldman moved forecast to December |
| 2 October | CNBC (CME FedWatch) | ~17% | Above 75% |
| 4 October | Gate.com and other reports | 22.1% | 67.3% for 25bp (unconfirmed) |
| 5 October | Financial Express (CME FedWatch) | ~18% | ~69% |
December odds sit mostly around 67-69%, though the original source cited about 98%. That gap likely reflects a different measure, such as cumulative hike probability, or a different date.
What the dot plot and PCE add to the odds
At its 15-16 September meeting, the Fed raised its target range to 3.75-4.00%. Exact median projections were not restated in the commentary reviewed, but the dot plot shows two hikes this year, steady rates next year and cuts afterward. Markets and the Fed still differ by 50 basis points for 2027.
Inflation data pulls both ways. August personal consumption expenditures (PCE) inflation, the Fed’s preferred price gauge, showed headline at 3.4% and core at 3.0% year-over-year, yet three-month annualised PCE has reached the Fed’s 2% target and the six-month rate peaked in May. The Atlanta Fed’s GDPNow estimate for Q3 growth was 3.7% on 1 October, down from higher levels.
What this tells you is that the Fed has room to stop, but only if it reads recent disinflation as durable.
What should you look for in the minutes, and why could a dovish read still cause repricing?
The consensus expects the minutes to stress data-dependence, balancing progress on inflation against the risk of overtightening. Some commentary frames it as “one more and done”, though that view has not been independently confirmed.
FOMC structure matters for reading the minutes: only 12 members vote, so comments from non-voting regional presidents are context rather than binding policy signals.
The September statement said activity is growing solidly and uncertainty is elevated. The more useful question is why the committee might limit hikes.
The overlooked distinction Signalling limited hikes because inflation is genuinely cooling carries more weight than markets assume, compared with limiting hikes out of simple caution.
Caution suggests a pause the Fed could abandon. Disinflation-driven restraint suggests a shorter path altogether, and markets still price another hike by March and one more by June-July.
When the release lands, scan for:
- How participants describe inflation progress, and whether short-term cooling is treated as durable
- Language on the risk of overtightening
- Discussion of financial conditions and credit
- Any reference to geopolitics and energy
- How many participants favour further hikes
Compare each answer against December pricing. If the minutes show broad confidence in disinflation, they imply fewer hikes than the market assumes, which is why a dovish message is not automatically a quiet one for your positions.
How do rate shifts transmit to gold, silver, bonds and small caps?
When rate expectations soften, the screen shows it first: metals bounce and the dollar slips. That is broadly the current picture. The dollar looks weaker, gold has bottomed and is holding, silver is trying to base, Bitcoin is testing its late-September swing high, the euro is rising, the Aussie and Canadian dollars are firm, and long-end bond declines have stopped. Verified closing levels for these assets were not available.
The mechanics start with real yields, which are bond yields after subtracting expected inflation. When real yields fall, the cost of holding gold and silver (which pay no income) drops, and the dollar tends to weaken.
Long-duration bonds gain because their prices rise as expected policy rates fall. Small caps are different: they respond more to growth and credit conditions, so a soft-landing repricing helps them while a slowdown scare can leave them lagging.
| Asset | Dovish minutes | Hawkish minutes | Key driver |
|---|---|---|---|
| Gold and silver | Supported | Pressured | Real yields and the dollar |
| Long-duration bonds | Supported | Pressured | Expected policy rates |
| Small caps | Mixed; depends on growth signal | Pressured | Growth and credit conditions |
| Large caps | Supports records | Vulnerable given narrow leadership | Soft-landing confidence |
Lessons from 2013, 2018 and 2019-2020
- 2013: minutes pointing to faster tapering fed the “taper tantrum”, spiking yields and unsettling risk assets.
- 2018: hawkish dot-plot and minutes messaging, despite slowing growth, hit cyclicals and small caps before the Fed turned dovish in early 2019.
- 2019-2020: dovish minutes citing global risks lifted gold, long bonds and growth stocks, while small caps moved unevenly.
None is a perfect parallel. For you, the lesson is that dovish minutes most directly support gold, silver and long bonds, while small caps benefit only if growth and credit reassurance comes too.
How does a macro trader use option verticals around the minutes, and what could go wrong?
Event risk cuts both ways, which is why many traders prefer structures where the worst case is known before entry.
Options market signals add another cross-check on how much downside risk is priced: December SPX puts carry a sizeable premium over equivalent calls, even while spot volatility looks calm.
How verticals define risk
A bull call spread means buying a call option and selling a higher-strike call. It profits from a rise, but the gain is capped and the loss is limited to the net premium paid.
A bear put spread means buying a put and selling a lower-strike put. It acts as a cheaper hedge against a hawkish surprise or growth scare than an outright put.
Ilias Spac, head of Global Macro at tasty live’s Macro Money, offers a working case study. His book reflects a weaker-dollar, stabilising-yields view, mostly through verticals:
- Equities: closed an SPY put vertical; keeps an IWM (Russell ETF) put vertical; slightly short European stocks; new exploratory short in XBI.
- Metals: long gold; long silver with 10 days to expiry.
- Currencies: adding to long Aussie dollar; long pound; newly long euro; exited short CAD.
- Other: long Bitcoin via call verticals; long bonds via a TLT call vertical; long crude via a call vertical.
Verticals cap your loss if the minutes are a non-event. Copying someone else’s book without understanding its timing and expiry risk, such as a silver position with days left, is a very different thing. This is educational context, not personalised advice.
Where the soft-landing story could break
A hawkish read would pressure small caps, long bonds and risk trades. Broader threats include:
- Inflation stalling while year-over-year PCE stays above target
- Weaker jobs data
- A falling GDPNow estimate
- Geopolitical energy shocks
- Narrow mega-cap leadership and stretched valuations
What the minutes can confirm, and what they cannot settle
Record large caps, a lagging Russell, a softer dollar and collapsing October odds all rest on one belief: that disinflation is durable. The minutes can strengthen or weaken that belief, but they will not settle it.
The harder tests come with the Q3 GDP release on 29 October and further PCE data. Before changing exposure, weigh the minutes’ reasoning for limited hikes against December pricing, not just the headline tone.
Check live levels for the dollar index, gold, silver, Bitcoin and Treasury yields, because verified closing levels were not available for this analysis.
This article is for informational purposes only and should not be considered financial advice. Investors should conduct their own research and consult with financial professionals before making investment decisions. Past performance does not guarantee future results. Financial projections are subject to market conditions and various risk factors.