On Tuesday, 6 October 2026, the S&P 500 closed at a record 7,818.93 and the Nasdaq Composite set its own record at 27,599.79. On the same day, the 10-year Treasury yield sat near 5.28%, close to its highest level since 2002. Much of the rally ran through AI and nuclear power stocks, which challenges a common market rule: that 5% yields put a ceiling on equities.
The leaders were not the usual megacap names. Utilities jumped 3.01% and a uranium exchange-traded fund (ETF) rose 4.01% after Google signed a large nuclear power deal with Constellation Energy.
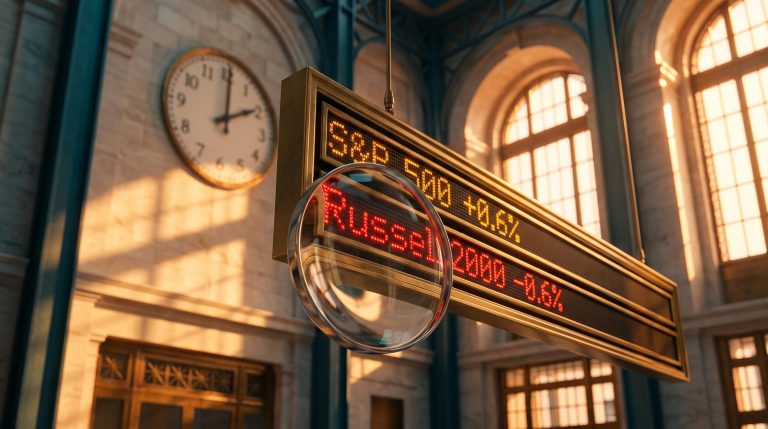
The Russell 2000, the main small-cap benchmark, fell 0.59%. That gap matters as much as the records.
Using this one session as a worked example, you will see how equities, bond yields, oil, the dollar and Fed expectations push on each other. You will also see which of those forces could decide whether the records hold.
Why did stocks hit records with the 10-year yield above 5%?
The numbers look contradictory at first. The S&P 500 gained 0.58% for its first record close since 13 August and its fourth straight gain. The Nasdaq added 0.45% for a second consecutive record. The Dow Jones Industrial Average rose 0.49% to 51,521.28.
| Index | 6 Oct close | Daily change | Note |
|---|---|---|---|
| S&P 500 | 7,818.93 | +0.58% | First record since 13 August |
| Nasdaq Composite | 27,599.79 | +0.45% | Second straight record |
| Dow Jones | 51,521.28 | +0.49% | Broad gains |
| Russell 2000 | 2,830.30 | -0.59% | Only major index lower |
Bond markets were sending a different signal. The 10-year yield eased about 2 basis points to roughly 5.28%, a day after closing at 5.31%, the highest since 2 April 2002, according to Dow Jones Market Data. A basis point is one hundredth of a percentage point. The CBOE Volatility Index (VIX), a gauge of expected market swings, fell to 15.01, which points to calm rather than stress. There was one caveat: the indexes closed below their intraday peaks.
Earnings help explain why both trends can run together. A strong economy tends to push yields higher, but it also lifts expectations for company profits. Market Index commentator Kerry argued that this mix can support selective gains in equities as long as US growth holds up.
Valuation signal Yardeni Research puts the S&P 500’s PEG ratio at a 30-year low. The PEG ratio divides a stock’s price-to-earnings multiple by its expected earnings growth rate.
Profits back up the story. New York Comptroller Thomas DiNapoli reported that first-half profits at NYSE member firms rose 51% to $49.5bn, already above New York City’s full-year forecast.
A low PEG ratio and strong profit growth suggest the market is pricing in earnings that could offset a higher discount rate. For you, that means treating yields as one input, not a final verdict. This is tolerance, not immunity. The research found no named strategist framework that fully squares records with 5% yields, so the case rests on these data points and on earnings continuing to deliver.
The discount-rate channel explains why a higher 10-year yield mechanically trims what future profits are worth today, which is why the earnings strength behind this rally has to keep delivering to offset it.
When big ASX news breaks, our subscribers know first
How the Google-Constellation deal put AI and nuclear power stocks in front
The clearest signal of the day came from Constellation’s share price. The size of the move depends on the source and the time of day. Reuters, Bloomberg and The Wall Street Journal put the intraday gain at roughly 14-15%, while the closing market wrap showed about 12%. The likely explanation is that shares gave back some ground before the close.
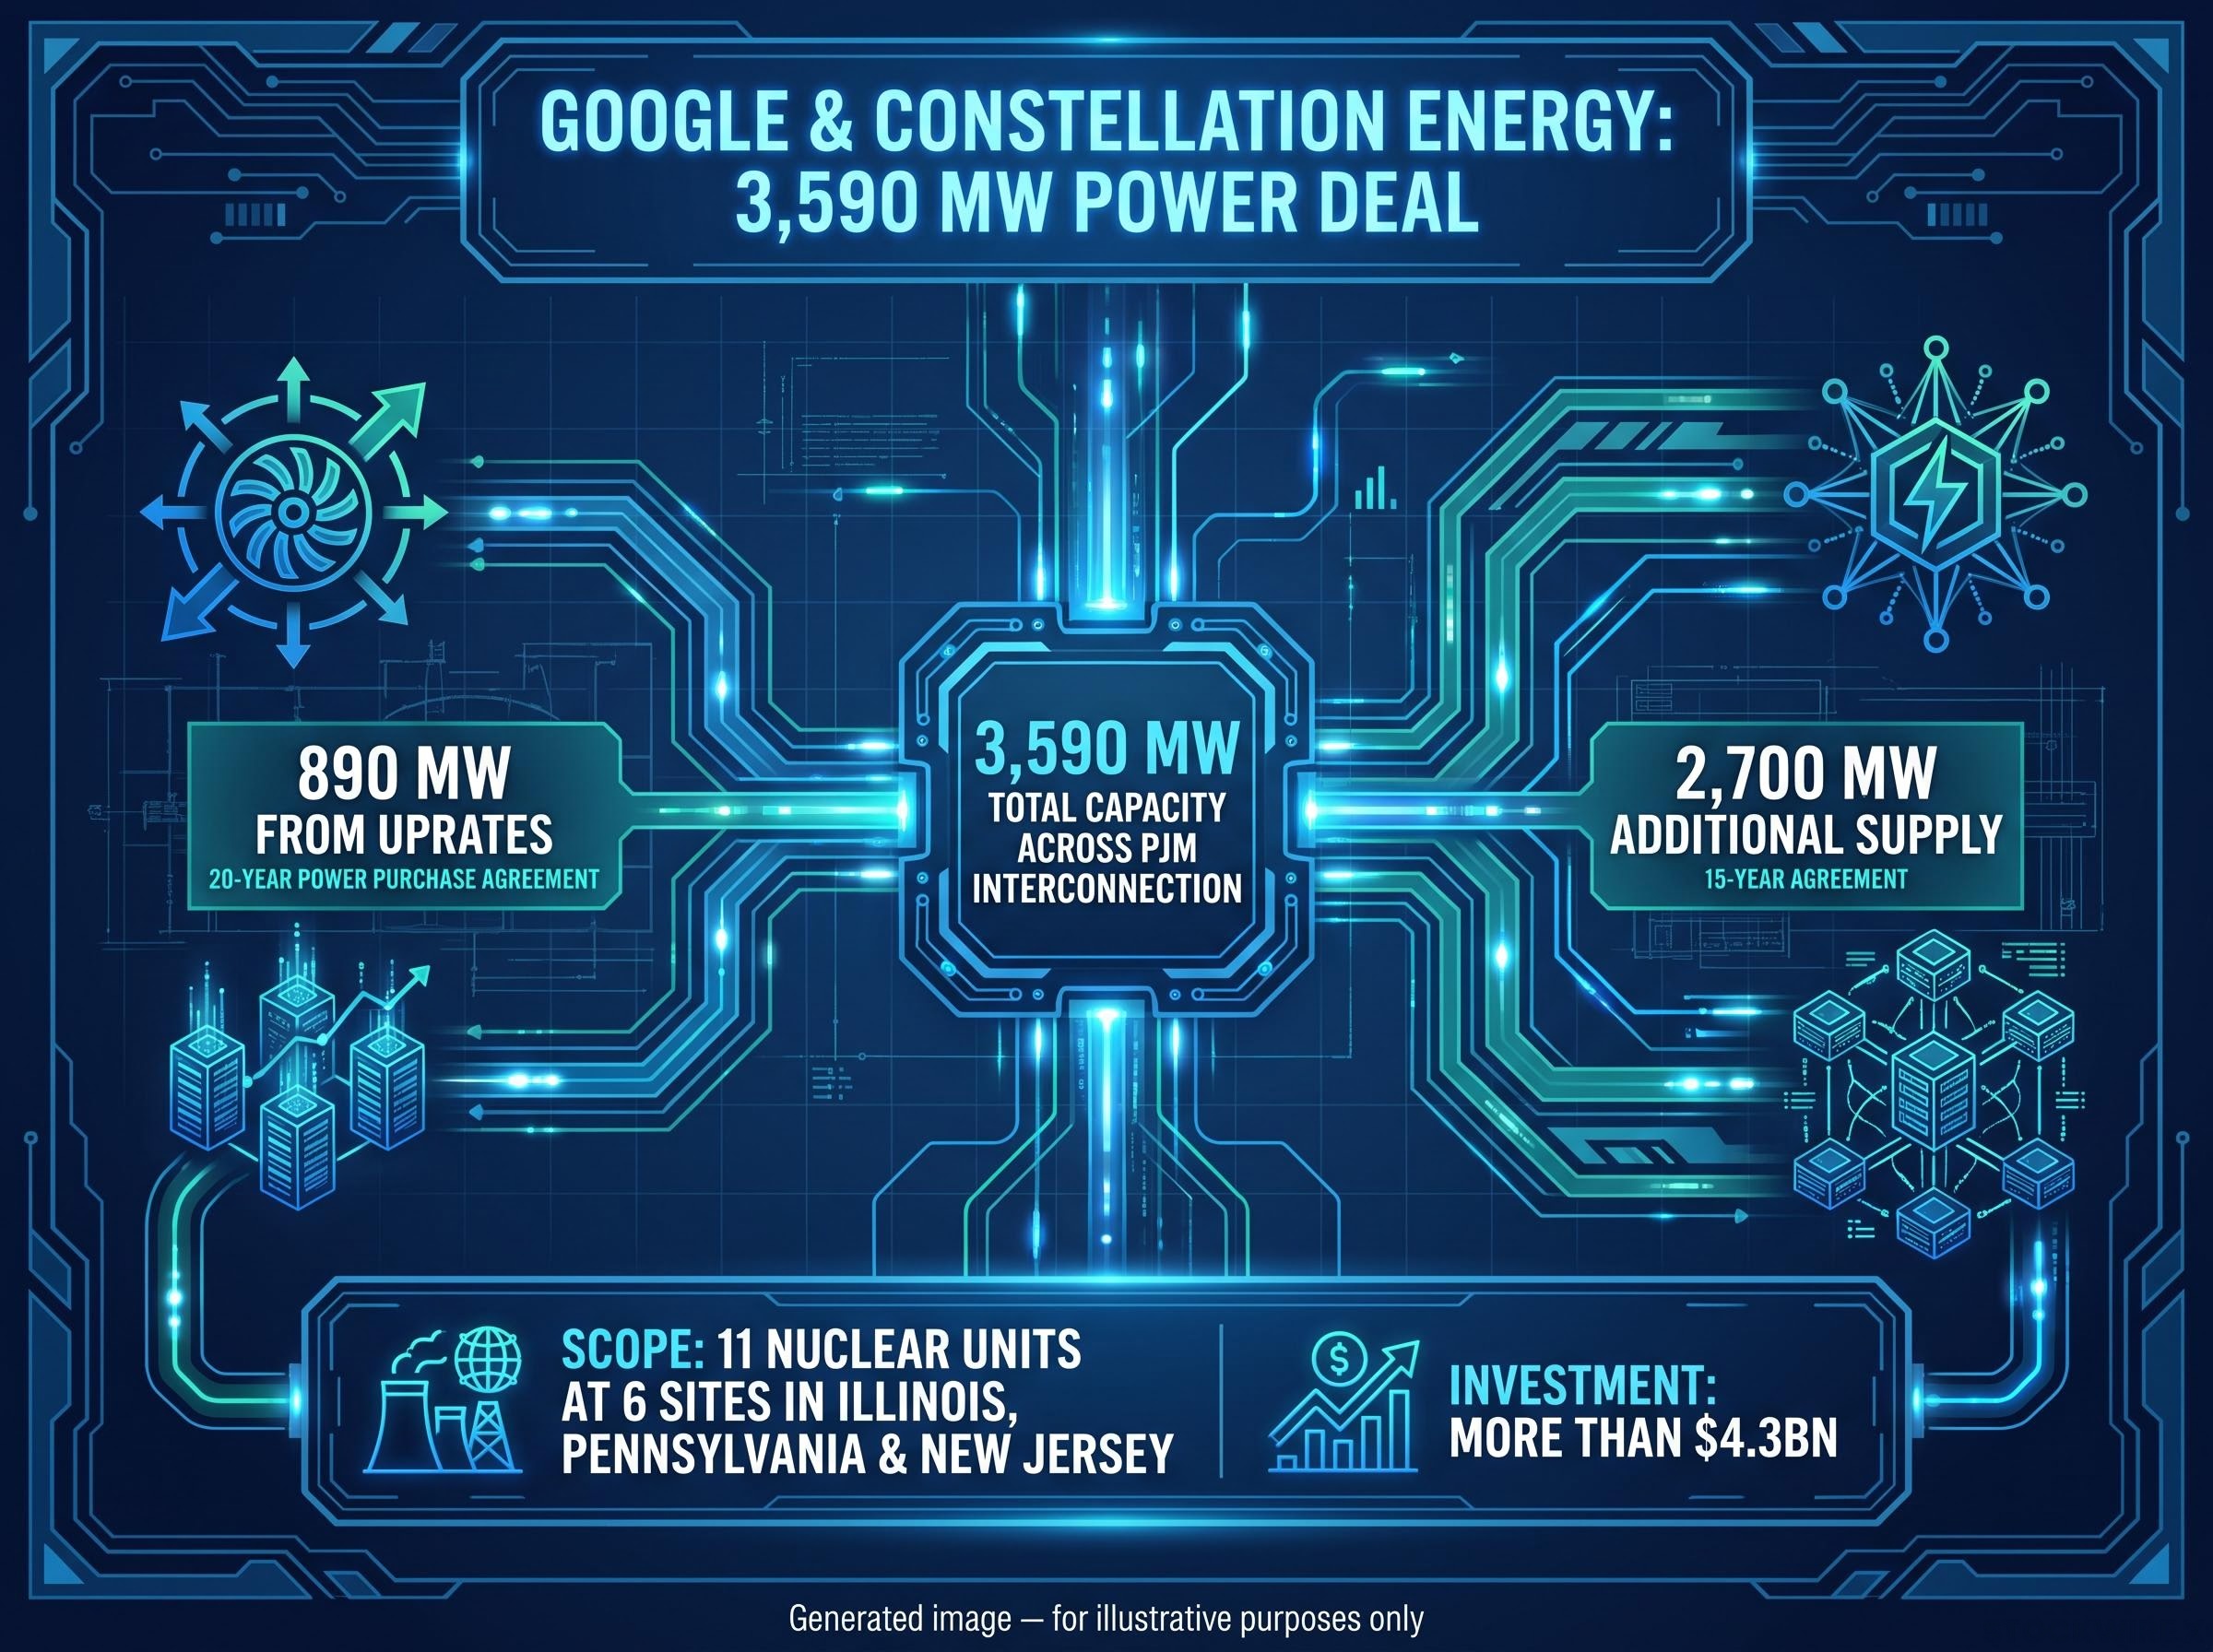
The deal itself is large. Google will take 3,590 MW from Constellation across PJM Interconnection, the largest grid operator in the US:
- 890 MW of new nuclear capacity from uprates at existing reactors, under a 20-year power purchase agreement
- 2,700 MW of additional long-term supply under a separate 15-year agreement
The upgrades cover 11 nuclear units at six plant sites in Illinois, Pennsylvania and New Jersey. Constellation describes the programme as more than $4.3bn of new investment. Bloomberg-cited reporting referred to a contract potentially worth at least $1bn in power purchases. Those two figures do not conflict. One measures capital spending and the other measures contract value.
Why AI data centres need nuclear power
Data centres run around the clock, so they need power that never switches off. Baseload power is electricity supplied steadily at all hours. Intermittent sources such as solar and wind produce power only when the sun shines or the wind blows.
Nuclear plants provide 24-hour, carbon-free baseload power, which suits always-on AI computing. An uprate is an upgrade that lets an existing reactor produce more electricity. A power purchase agreement (PPA) is a long-term contract in which a buyer agrees to buy power at set terms.
PJM has suggested that large data-centre customers may need to “bring your own power” or face constraints at peak demand. Long, fixed-price PPAs give operators the revenue visibility to justify multi-billion-dollar upgrades. That is why coverage describes the link as structural rather than a one-day trade.
AI energy demand is projected to push data centre electricity use past 1,000 TWh, which is why hyperscalers are locking in firm power from nuclear operators rather than relying on intermittent sources alone.
Google’s nuclear scale Google says its nuclear-related agreements enable more than 1.5 GW of new nuclear capacity by lifting output at existing reactors and restarting dormant facilities.
Google has done similar deals before. Meta reportedly signed a 20-year deal with Constellation in June 2025, and Google has a reported partnership with Kairos Power and the Tennessee Valley Authority. Evercore sees the new agreement as positive for other plant owners and uranium enrichers.
The deal suggests AI spending is now flowing into the power sector. You can treat utilities and uranium as a second-order route into the AI theme, one that carries different risks from chip stocks.
Why small caps lagged while megacap tech and AI led
Against a page of green, one number stood out in red. The Russell 2000 fell 0.59% to 2,830.30, ending a three-day winning run as investors rotated back into megacap tech and AI.
Smaller companies usually rely more on borrowed money and floating-rate debt, so a 10-year yield above 5% tends to weigh on them harder. That is general market context rather than a finding specific to this session, but it fits the pattern.
The breadth figures make the headline record less reassuring. Ten of eleven S&P 500 sectors rose, yet most megacap tech stocks gained less than 1% and the indexes finished below their intraday highs.
| Sector or ETF | 6 Oct move | Driver |
|---|---|---|
| Utilities | +3.01% | Google-Constellation deal |
| Uranium ETF | +4.01% | Nuclear demand outlook |
| Semiconductors | -0.01% | Flat despite AI leadership |
| Health Care | -0.16% | Only falling sector |
| Biotech | -2.34% | Vaccine makers reversed gains |
Health Care fell because Novavax dropped 9.8% and Moderna lost 7.7%. Both gave back gains from Monday’s Russia plague scare after the World Health Organization judged the risk to be low.
The broader AI story is concentrated in a few giants. Nvidia hit a record and is nearing a $6tn valuation. AMD recently passed $1tn, and CEO Lisa Su said supply will increase substantially in 2027. Meanwhile, pricing pressure is building for OpenAI and Anthropic, as startups move toward lower-cost open models.
The gap between large and small caps shows that the market is paying for scale and visible AI earnings. It is worth checking how much of your own exposure depends on a handful of names.
What bonds, oil, the dollar and the Fed mean for the rally’s staying power
The rally depends on several pressure points holding at once. Each one is worth looking at in turn.
Bonds and the dollar
Treasury supply is the first concern. BNP warned that Treasury Secretary Scott Bessent’s decision to scrap the 20-year bond could raise borrowing costs. JPMorgan CEO Jamie Dimon has flagged that sticky inflation could push rates higher.
The US dollar index (DXY), which tracks the dollar against major currencies, fell 0.25% to 101.8. It is still up 3.1% since early September. A stronger dollar tightens financial conditions for both US companies and global markets.
| Asset | 6 Oct level | Move | Why it matters |
|---|---|---|---|
| 10-year yield | ~5.28% | Down ~2 bps | Sets the discount rate for equities |
| DXY | 101.8 | -0.25% | Tightens global financial conditions |
| Brent crude | $101.12 | +0.9% | Feeds inflation and rate odds |
| Gold | 4,164.34 | +0.59% | Hedge against risk and inflation |
Oil and rate expectations
Brent settled at $101.12 after falling as much as 3.1% during the session. The dip came as Saudi Arabia restored East-West pipeline capacity to 5.8m barrels per day. Supply through the Strait of Hormuz remains tight. Windward estimates flows at 9-10m b/d, against a pre-war baseline of 14.5m, and Iran has stepped up attacks on tankers. WTI closed at 89.91.
Oil feeds directly into rate expectations. CME FedWatch shows about 21% odds of an October rate hike and nearly 70% for December. Traders also priced roughly 80% odds of a hold at the next meeting. Those figures are consistent because they refer to different meetings: markets expect a pause first and a possible hike later.
Rate hike expectations have been shaped by an oil shock hitting a supply-side problem with a demand-side tool, and that tension is why December odds could swing quickly if inflation data surprises.
Other central banks are leaning hawkish too. Bank of Japan Governor Kazuo Ueda signalled further rate rises. The ECB’s Philip Lane called the energy surge a “second wave” of the supply shock. The Reserve Bank of Australia has lifted its cash rate to 4.60%. In the US, the August trade deficit came in above $100bn, against $89.8bn expected, as importers kept buying AI data-centre components.
Rising hike odds combined with oil near $100 mean an inflation surprise could hit bond prices and equity valuations at the same time. Watch these variables in order:
- Inflation releases, for any pickup driven by energy
- Hormuz flows and tanker security, alongside Houthi activity in Yemen
- Treasury auction demand after the 20-year bond decision
- December hike odds on CME FedWatch
These scenarios are speculative and could change with market developments. Past performance does not guarantee future results.
What the records change, and what they do not
The session showed that AI demand is no longer limited to chips. It is now reaching the grid, nuclear plants and uranium suppliers through long-term contracts. That is a real change in where the theme shows up.
Some things have not changed. Yields remain near their highest levels in decades, oil is close to $100 and market leadership is narrow, so the rally stays conditional. Three variables matter most: the 10-year yield against 5.3%, Brent and Hormuz flows, and the December Fed hike odds.
For your own portfolio, one useful test is to list your holdings that depend on AI spending. That includes chips, megacap platforms and now power producers. Then ask whether they would all fall together if rates moved higher.
This article is for informational purposes only and should not be considered financial advice. Investors should conduct their own research and consult with financial professionals before making investment decisions.