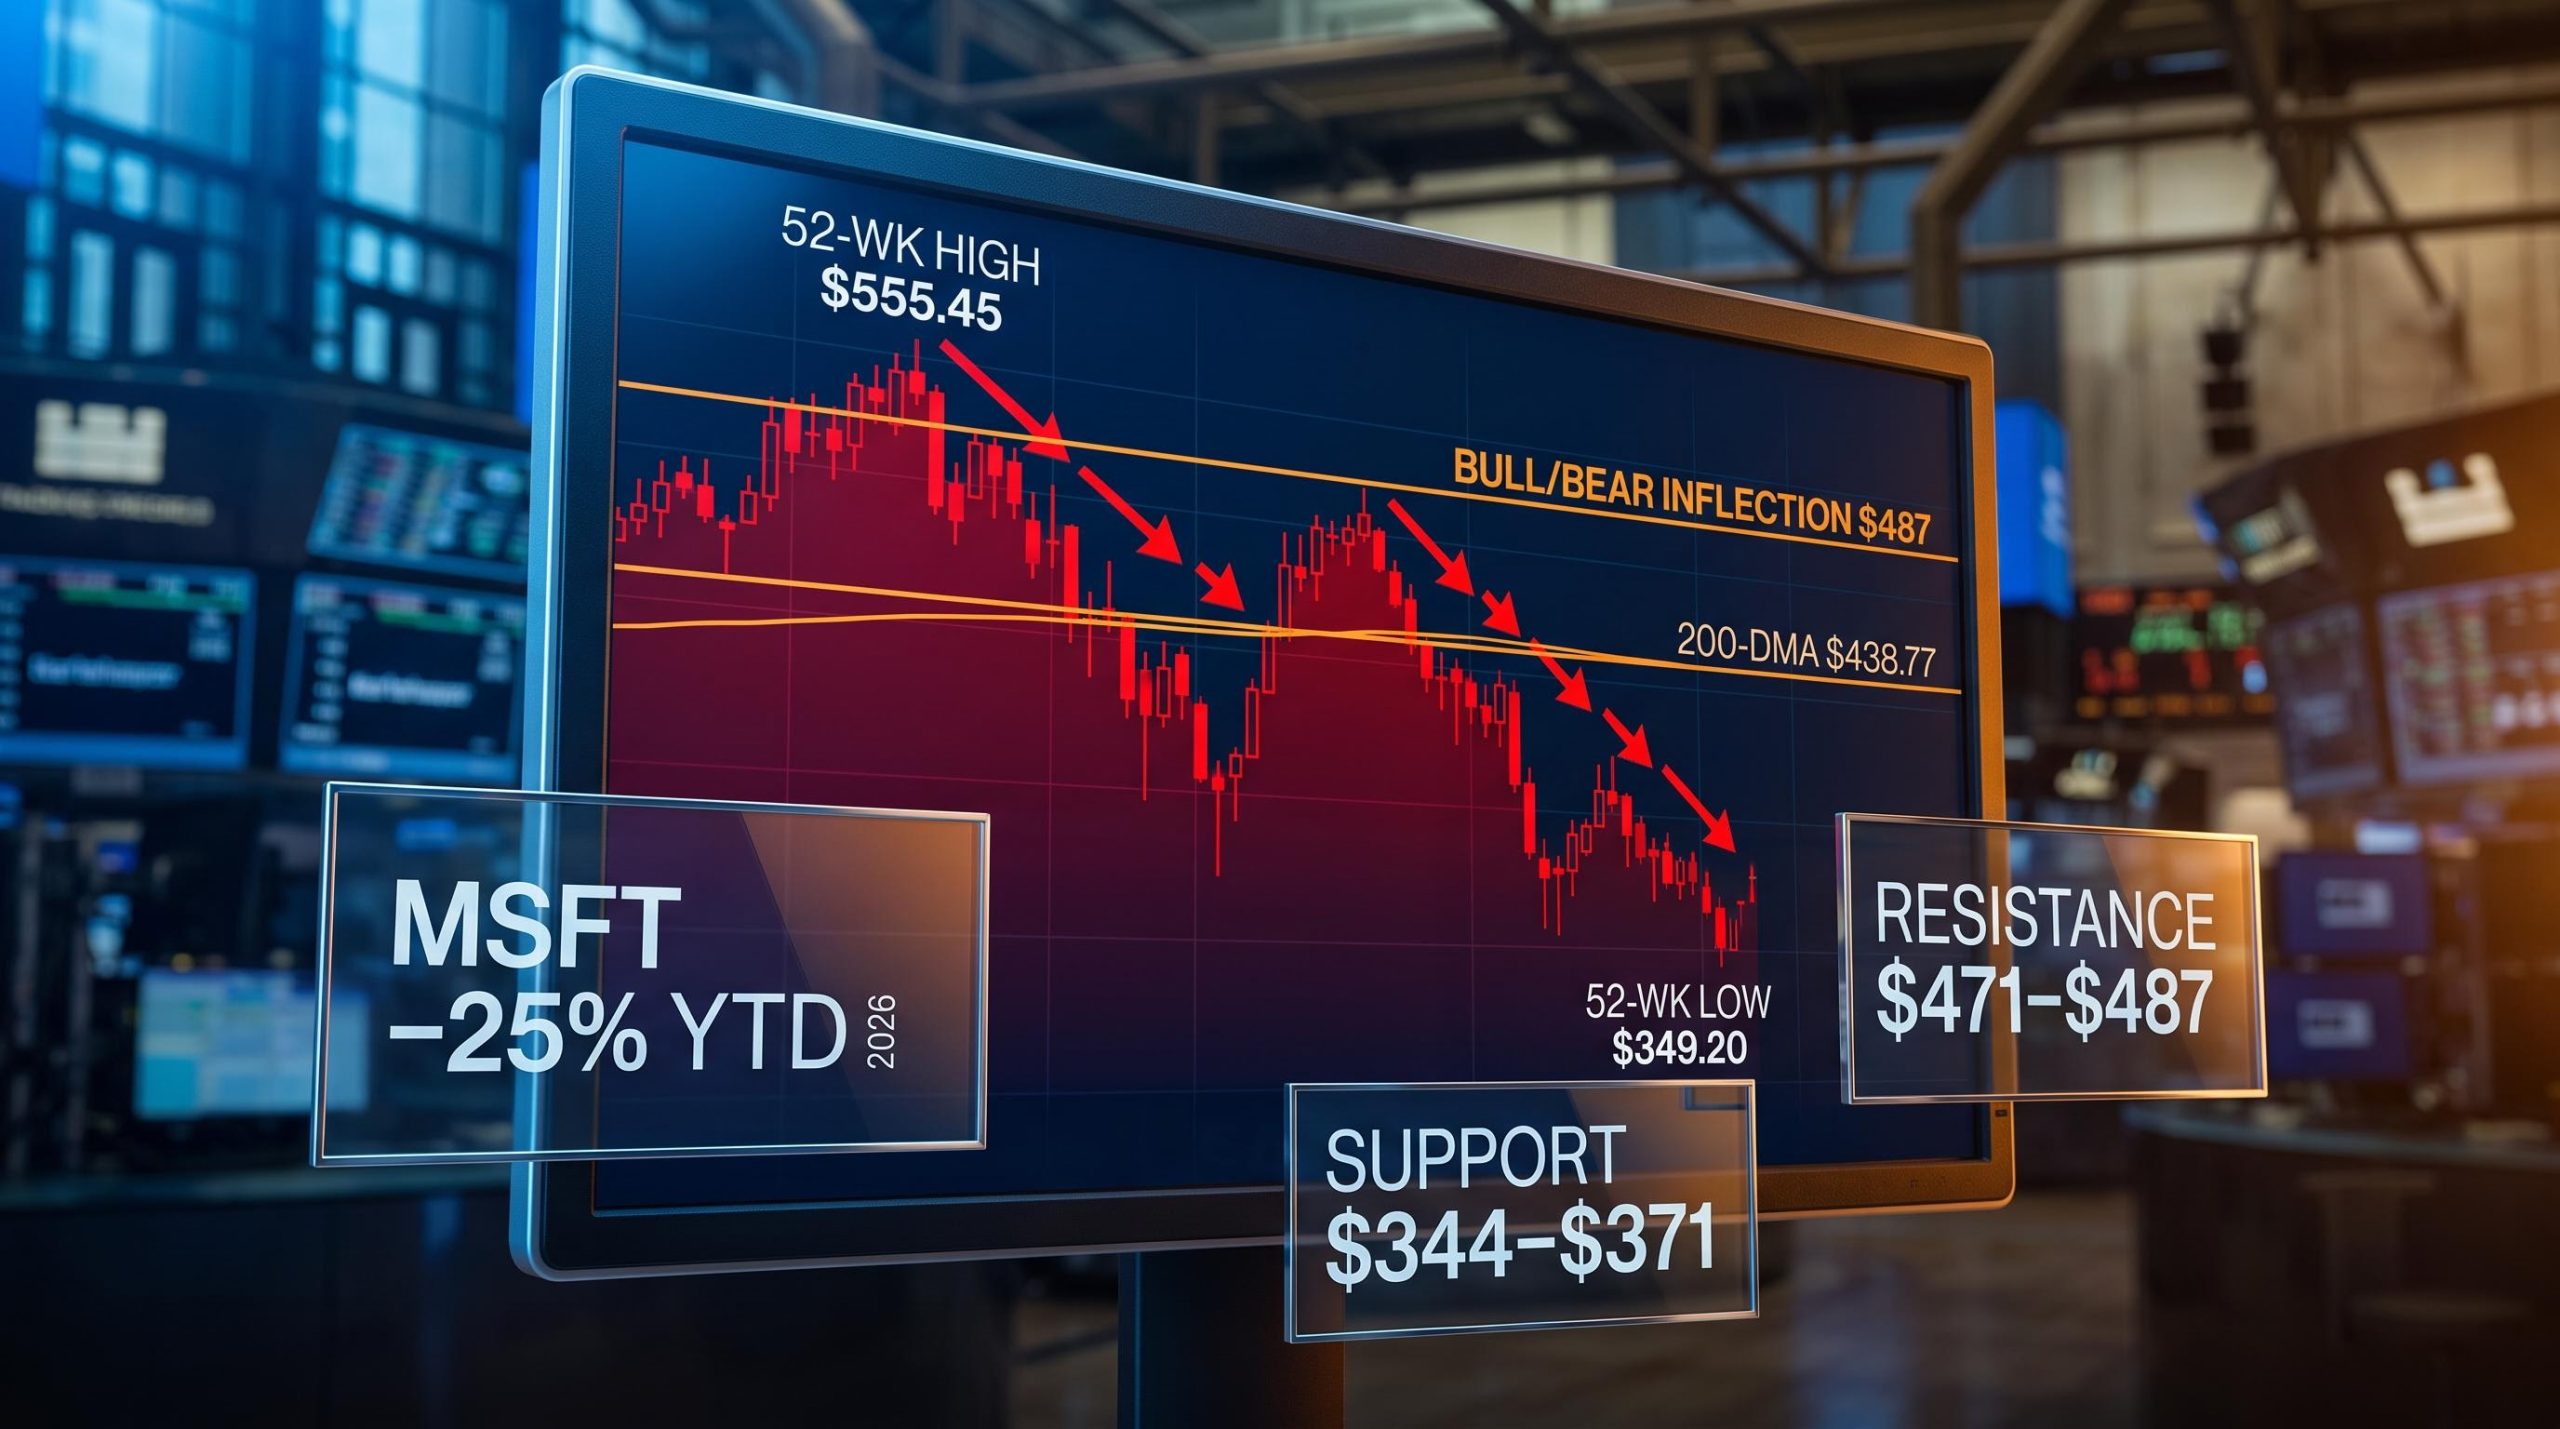
Microsoft has lost roughly 25% of its value so far in 2026, hit a 52-week low of $349.20 in June, and ended a three-year run of consecutive annual gains. None of that happened because the company missed an earnings estimate. It has beaten consensus in each of the prior four consecutive quarters.
The decline is a valuation and macro repricing event playing out on the chart, and the technical structure heading into tomorrow’s Q4 FY2026 earnings report on 29 July 2026 is unusually readable. A well-defined support cluster sits in the mid-$340s to $370s. A layered resistance sequence runs from $420 through $487. The 200-day moving average at $438.77 sits between them, acting as both an intermediate hurdle and a sentiment barometer.
Here is the framework for both outcomes: what the chart says about the bull path, the bear path, and where each one breaks. The goal is to give you specific reference points for interpreting the earnings reaction, so the first hour of trading tomorrow becomes a data point you can act on rather than a move that catches you off guard.
From peak to near one-year low: how deep is Microsoft’s correction?
The numbers tell a stark story. From its 52-week high of $555.45 in July 2025 to the 52-week low of $349.20 set on 25 June 2026, Microsoft shed approximately 30% of its market value. That is the kind of drawdown that forces a reassessment of positioning across institutional and retail portfolios alike.
Three data points anchor the scale of the decline:
- 52-week high: $555.45 (July 2025)
- 52-week low: $349.20 (25 June 2026)
- Year-to-date decline in 2026: approximately 24-25%, the worst sustained stretch in well over a decade
The fundamental tension: Microsoft has not missed an earnings estimate across the prior four consecutive quarters. This correction has been driven by valuation and macro repricing, not by deteriorating business performance.
That distinction matters for everything that follows. A 30% drawdown in a stock with an intact earnings record tells you this is a repricing event, not a deterioration story. It changes how the support zones below should be interpreted: as levels where investors are weighing Microsoft’s future growth rate against its valuation, not questioning whether the business itself is broken.
Microsoft’s near decade-low valuation of roughly 21x forward earnings is the macro context that explains why a 30% drawdown could occur alongside four consecutive earnings beats; the repricing has been about the multiple, not the business.
A strong earnings report tomorrow may provide justification for a technical reversal attempt. It will not, on its own, erase a macro-driven correction.
The broader momentum factor unwind that hit high-beta technology stocks in June 2026 provides important context for Microsoft’s June low, because forced de-risking from factor-based strategies can push prices below what fundamentals alone would justify.
When big ASX news breaks, our subscribers know first
What the moving averages are telling investors right now
Two moving averages define the structural picture at different time horizons, and they are telling slightly different stories.
The 200-day moving average: medium-term trend barometer
The 200-day moving average (200-DMA) is the most widely followed single indicator of medium-term trend direction. It calculates the average closing price over the past 200 trading days. When price trades below it, the conventional reading is that the trend bias is corrective or bearish.
Microsoft’s 200-DMA sits at $438.77, and the stock has traded below it throughout the correction period. That level is not just a line on a chart. In a post-earnings rally scenario, $438.77 represents the first significant overhead test where selling pressure from investors who bought during the decline and are looking to exit near breakeven would be expected to intensify.
The 200-week moving average: structural signal from the long view
The 200-week moving average (200-WMA) captures roughly four years of price history. Across large-cap equities, major cycle lows frequently occur near this level, and recoveries from it are commonly interpreted as shakeouts rather than permanent trend destruction.
Following the June 2026 low, Microsoft’s price recovered above the 200-WMA. The character of that recovery points to substantive demand rather than a short-covering bounce with no follow-through. This is the constructive signal within an otherwise corrective structure.
The two-timeframe summary:
- 200-DMA ($438.77): Price remains below. Medium-term bias is corrective. This is the ceiling to reclaim.
- 200-WMA: Price has recovered above. Long-term structural picture remains intact. The most extreme bearish scenarios are less probable.
Both signals matter heading into a binary event like earnings. The 200-DMA tells you the correction has not reversed. The 200-WMA tells you the long-term structure has not broken. The stock is stabilising, not yet turning.
Microsoft’s multi-layered support zone ahead of earnings
The $344-$371 range is not a single price level. It is a cluster where three distinct technical frameworks converge, and each layer adds weight to the zone’s significance.
Start with the floor. The 52-week low of $349.20, set on 25 June 2026, is the most recent point where buyers stepped in aggressively enough to halt the decline. Two older price references converge tightly around that level: the April 2025 swing low of $344.79, which marked the deepest point of the prior tariff-driven selloff, and the November 2021 prior all-time high near $349.67, a price that served as resistance for years before the stock broke through. When former highs and former lows compress into the same narrow band, the zone carries the combined memory of both events.
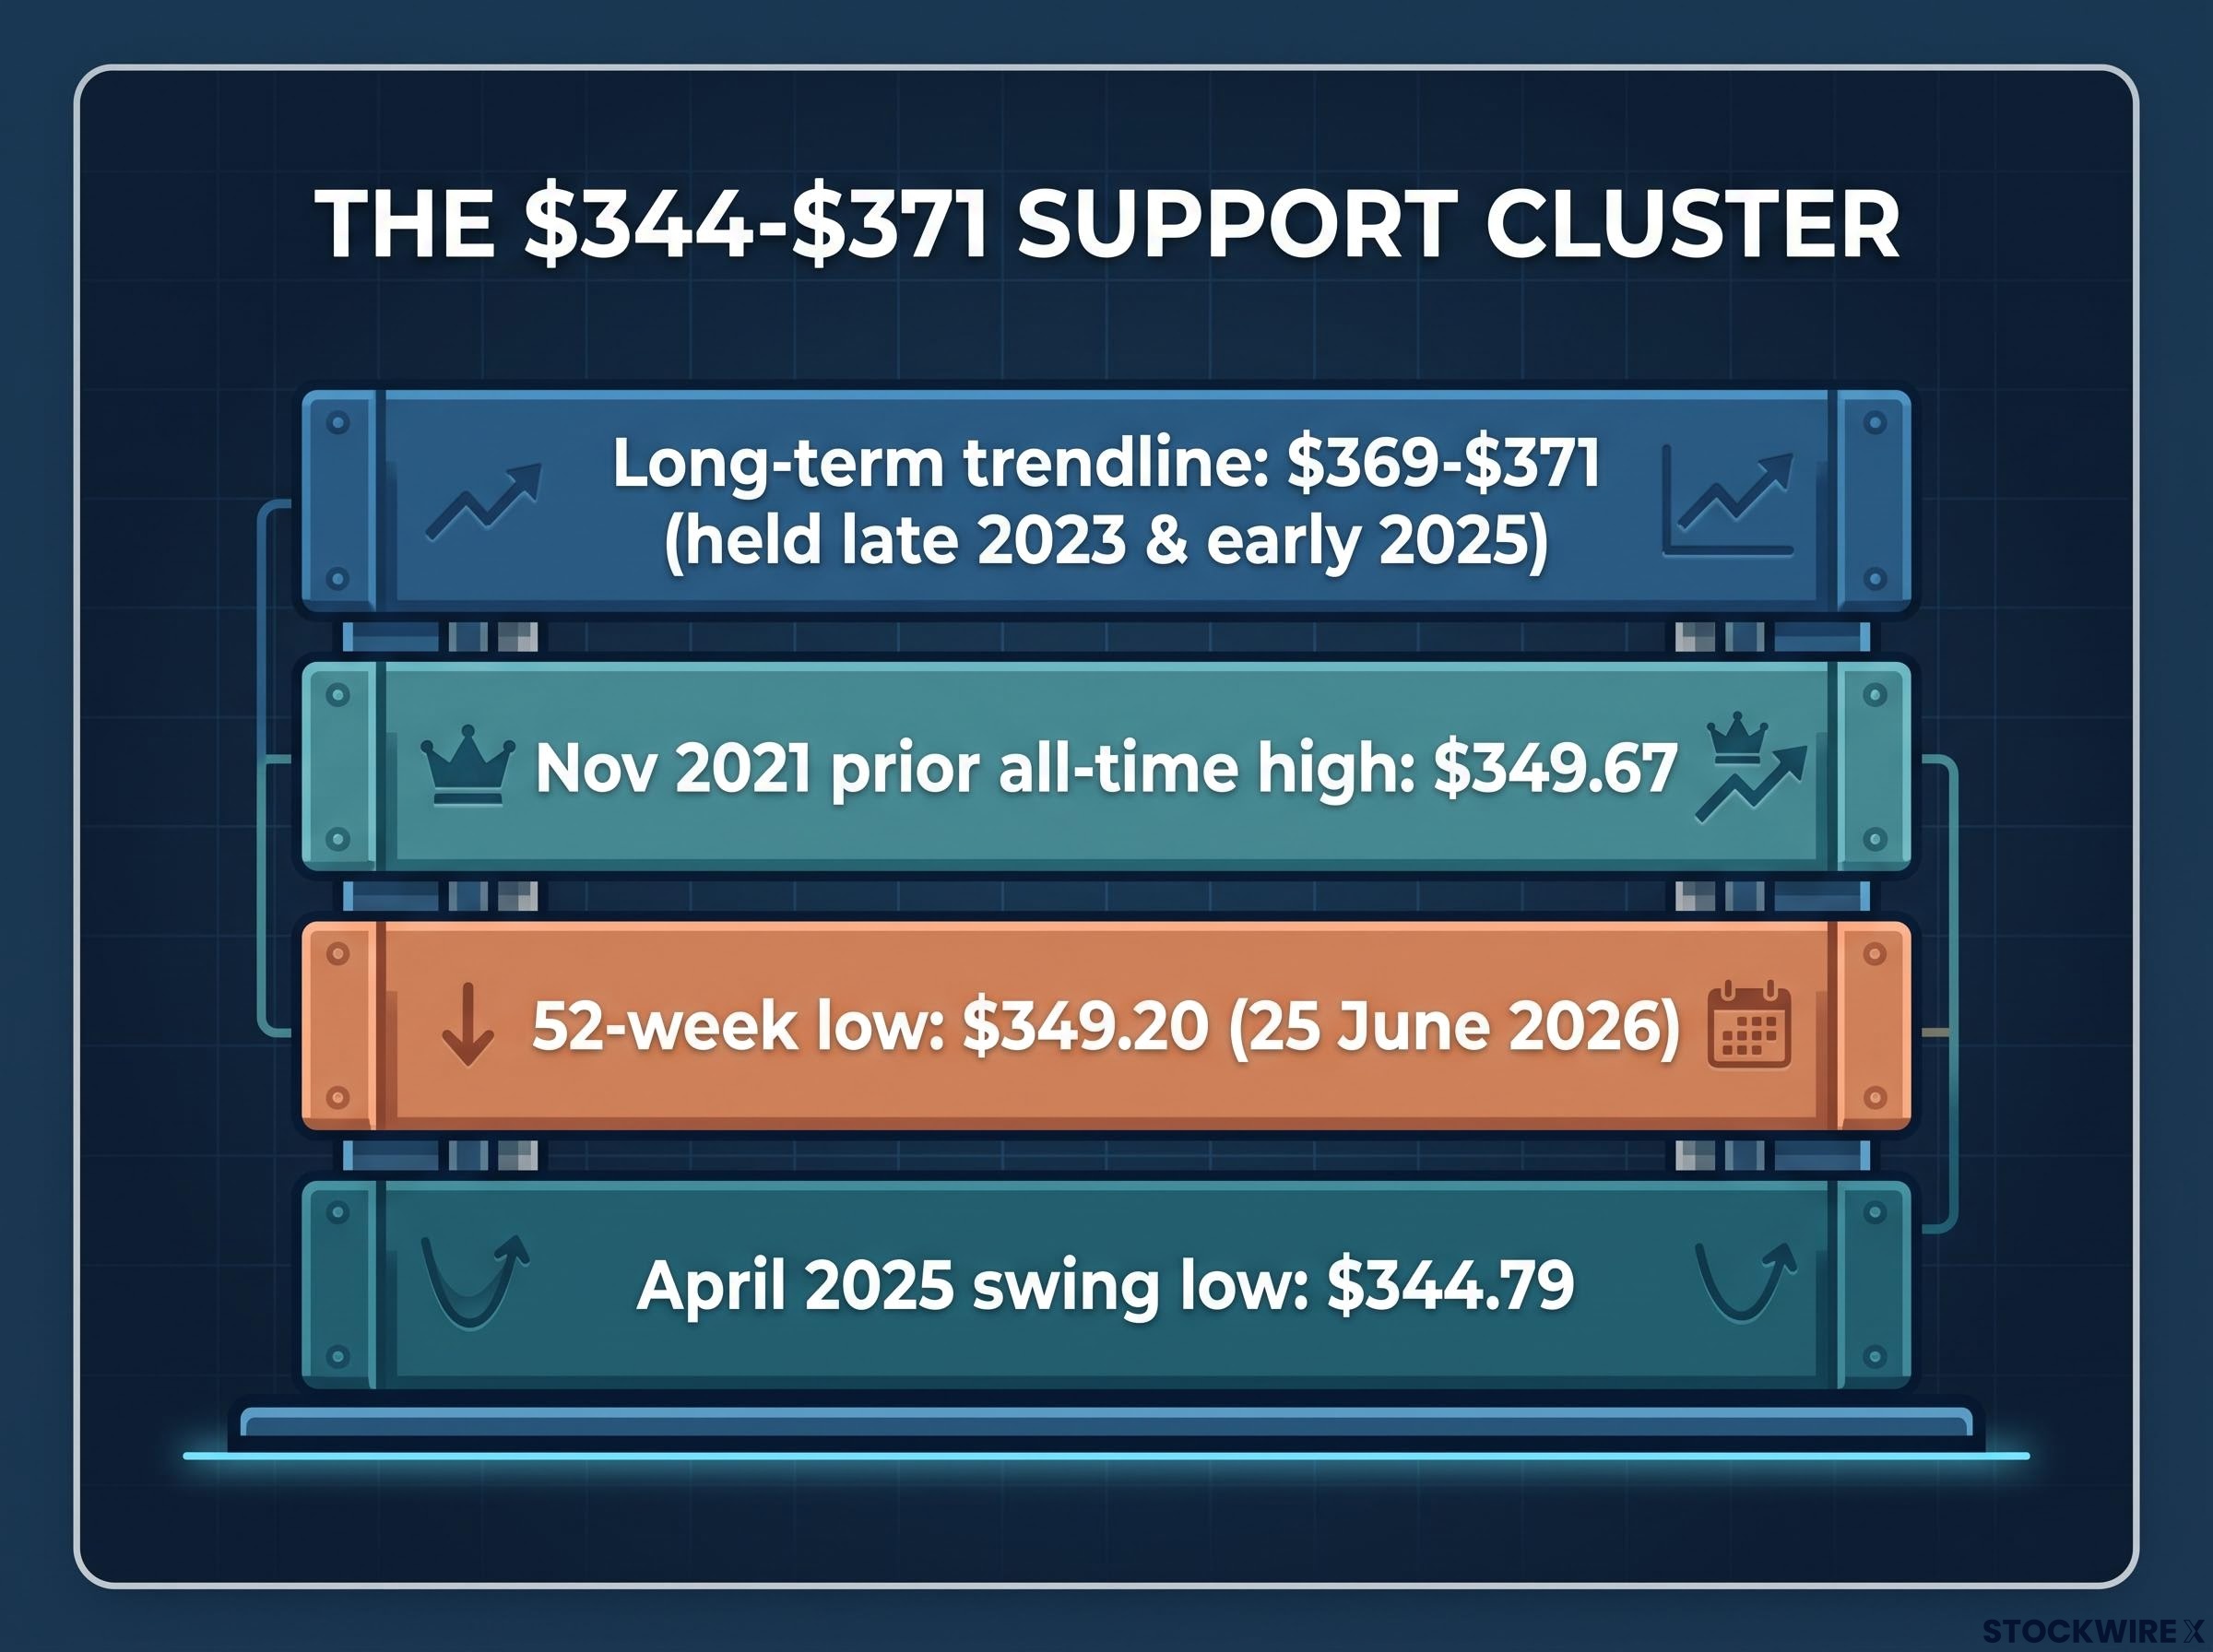
Then there is the structural layer. The long-term ascending trendline support at $369-$371 marks the lower boundary of a multi-year upward channel. This level held during pullbacks in late 2023 and early 2025, and it is widely watched by trend-following investors.
| Level | Price | Why it matters |
|---|---|---|
| 52-week low | $349.20 | Most recent buyer response; near November 2021 prior all-time high |
| April 2025 swing low | $344.79 | Deepest corrective reference from the prior cycle |
| Long-term trendline | $369-$371 | Base of multi-year ascending channel; held in late 2023 and early 2025 |
The broader $350-$389 demand zone is where a prior rally launched, ultimately carrying the stock approximately 61% higher to the $555.45 all-time high. Long-term investors and systematic buyers have shown up here before. That history is precisely why a hold at these levels would be technically meaningful rather than coincidental.
The bull roadmap: how a strong earnings report could reshape the chart
A positive earnings reaction does not mean the correction is over. It means the stock enters a specific sequence of resistance tests, each of which must be cleared and held before the next becomes relevant.
- Hold $344-$371 support: The floor must remain intact. A gap higher from this zone confirms buyers are defending the demand cluster.
- Push toward $420: This is the 0.618 Fibonacci level (the “golden ratio,” a widely used retracement reference). It represents the first upside magnet where selling pressure would be expected to materialise.
- Clear the 200-DMA at $438.77: Reclaiming this level would shift the medium-term trend signal from corrective to neutral, a prerequisite for sustained institutional buying.
- Exceed the $466.32 swing high from 1 June 2026: This is the specific prior high the stock must clear to establish a higher high in the current structure.
- Break and hold above $471-$487: The critical trend-reversal threshold. Below it, every rally is a counter-trend bounce. Above it, technicians can begin arguing for a genuine new uptrend.
- Target the prior all-time high near $555-$557: Only credible once $487 is reclaimed and held.
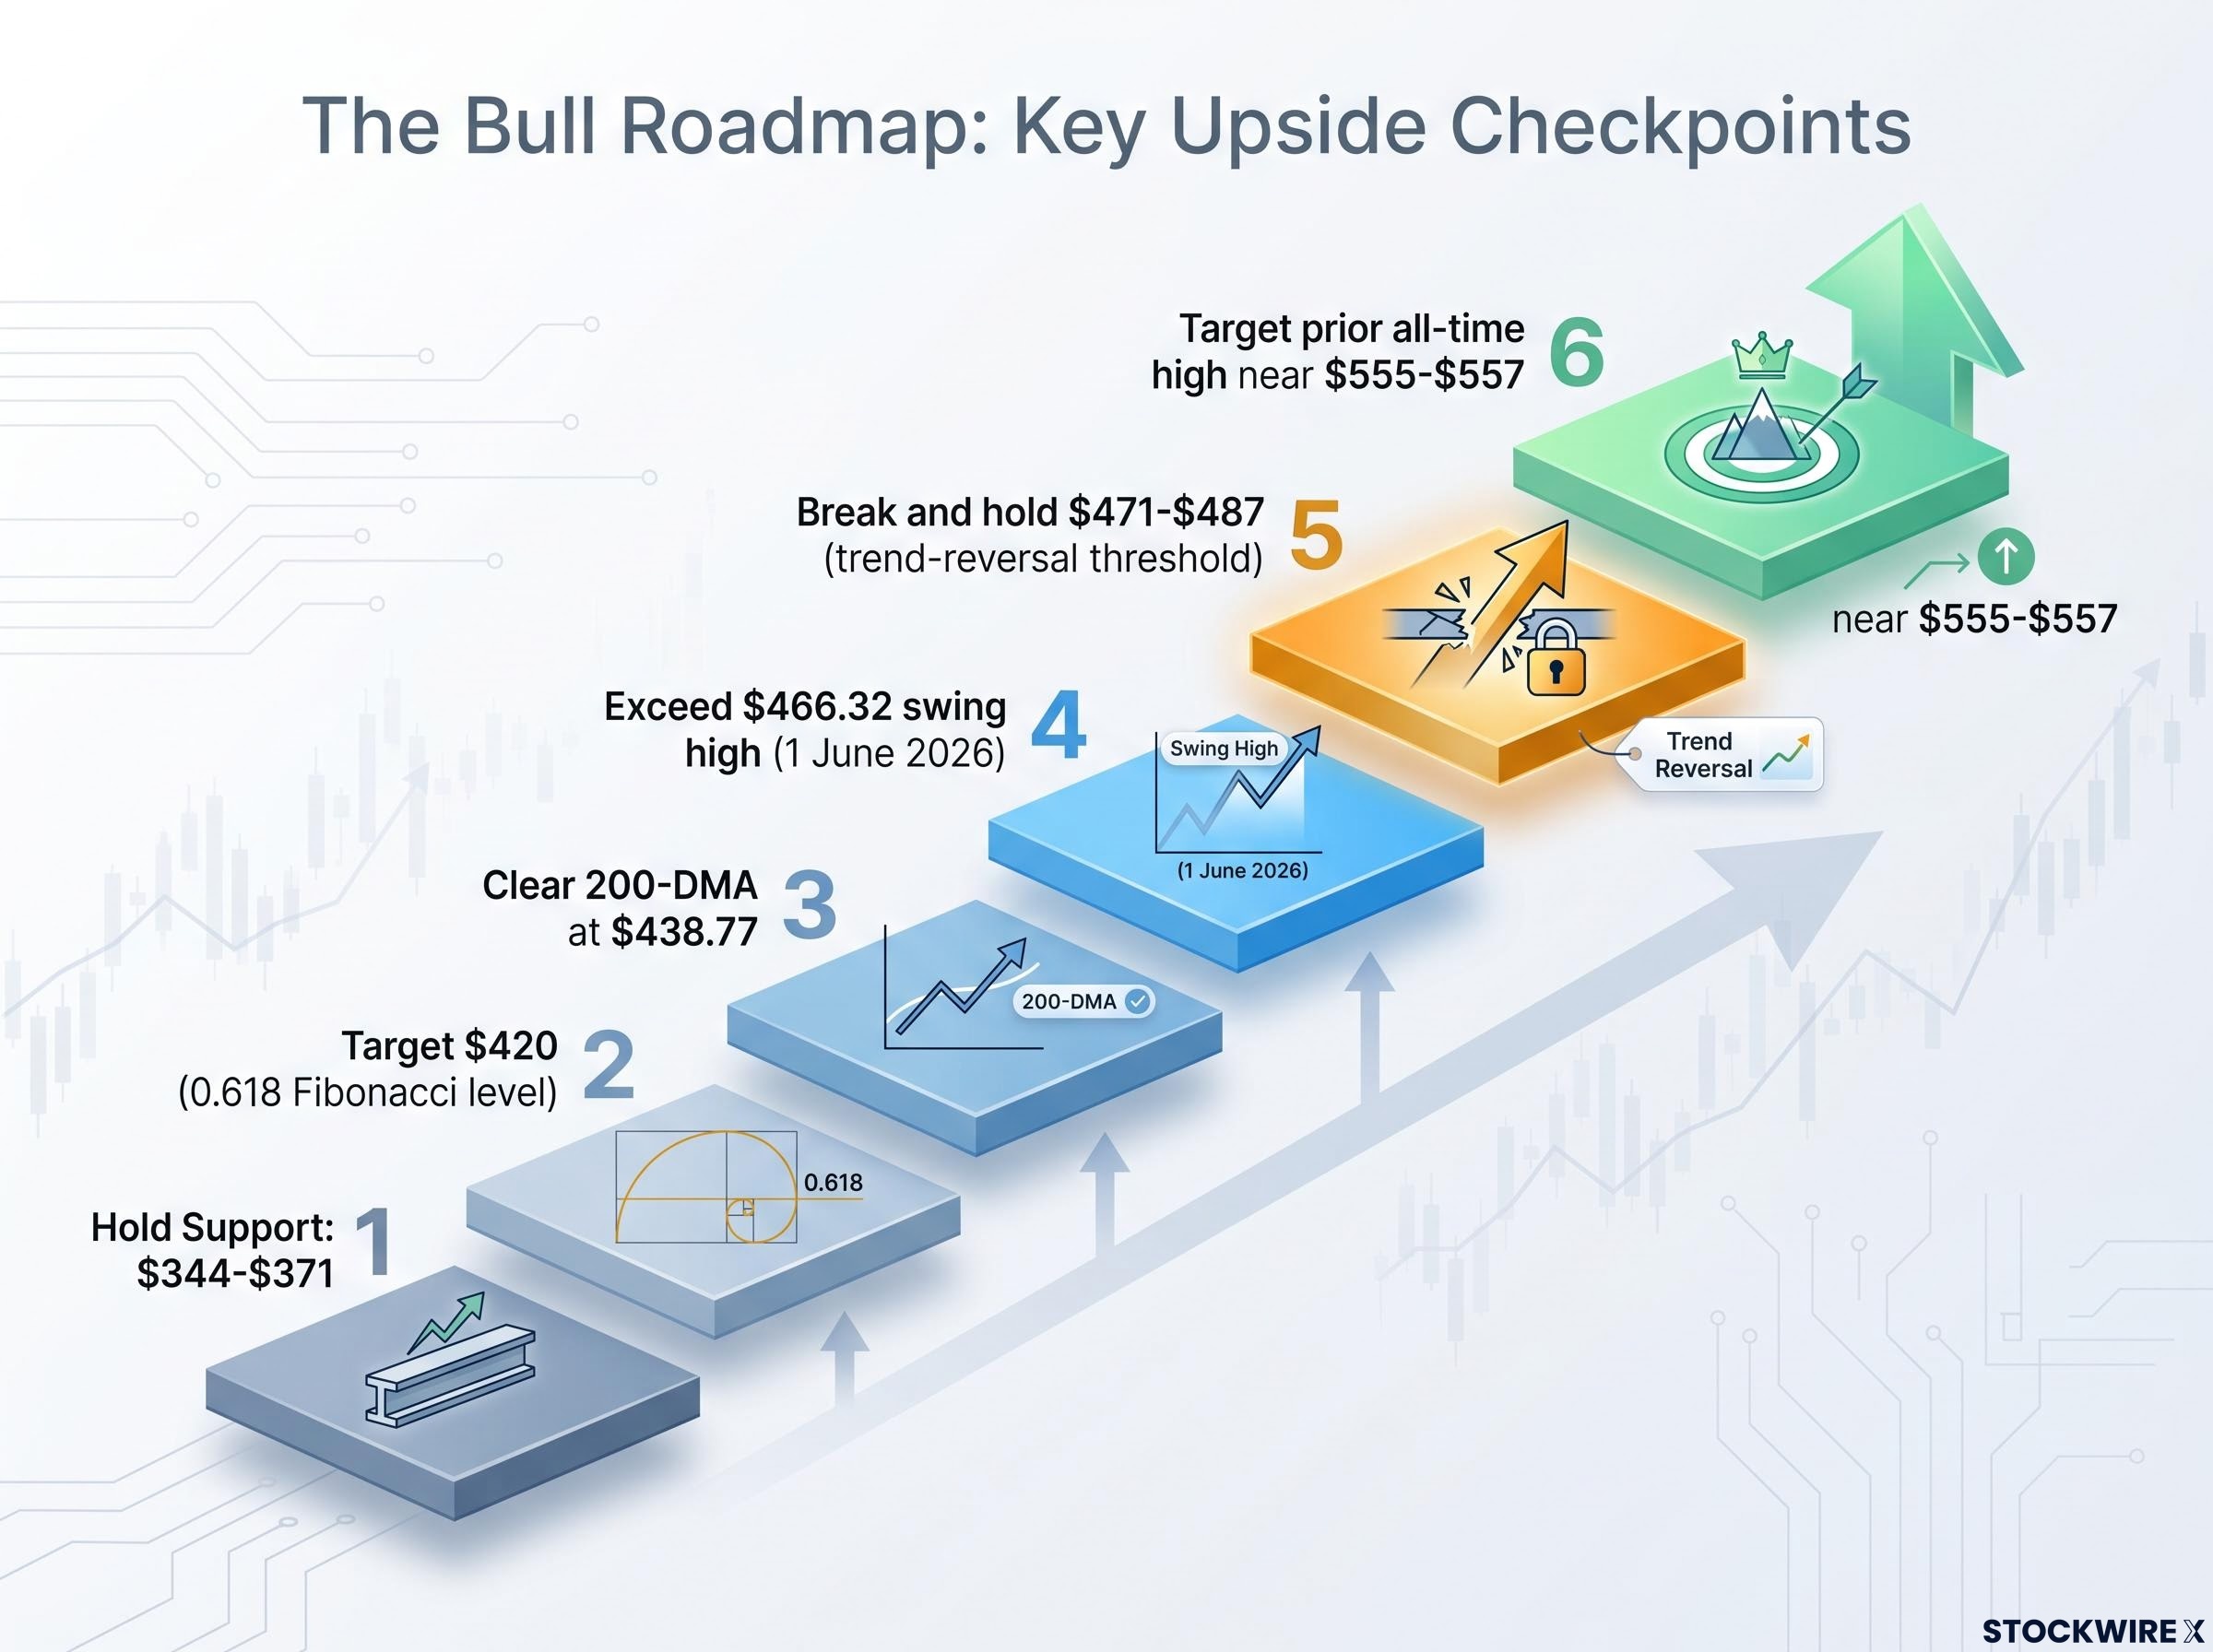
The single most important upside level: The $471-$487 resistance band is the bull/bear inflection point. Until price clears and holds above it, every rally attempt is technically a counter-trend bounce within a still-corrective structure.
What this tells you about position sizing: treat each checkpoint as an incremental confirmation rather than front-loading exposure on the earnings number alone. The sequence rewards patience, not conviction on a single data point.
Volume confirmation on any breakout above the $420 or $471-$487 resistance zones will matter as much as price itself; a close above resistance on below-average volume is a materially weaker signal than one accompanied by expanding participation.
The bear roadmap: what a disappointing report would confirm on the chart
The downside scenario is not a single event. It is a cascade, and each level’s failure carries a distinct and progressively more bearish meaning.
The first line of defence is the $369-$371 trendline support. A sustained break below this level signals that the long-term ascending channel, a structure that has held since 2023, has failed. That is a qualitatively different event from a routine pullback. It removes a reference that trend-following investors have relied on for years.
If trendline support fails, the next test is the 52-week low at $349.20 and the broader $344-$350 demand band. A break below the 52-week low would signal that the prior demand zone has been exhausted. Fresh 52-week lows following a failed rebound are associated with trend-following selling and forced de-risking, as systematic risk models flag the stock as a persistent underperformer.
| Level | What it signals | Confirmation trigger |
|---|---|---|
| $369-$371 | Long-term ascending channel has failed | Sustained close below with no reclaim within 2-3 sessions |
| $349.20 ($344-$350 band) | Prior demand zone exhausted; trend-following selling triggered | New 52-week low that cannot reclaim mid-$350s within days |
| ~$280 (inference only) | Deeper historical consolidation; extreme scenario | Analyst-level estimate only, not a consensus chart target |
The critical tell is not the initial earnings gap. It is the two-to-three sessions after. A break below $369-$371 that cannot be reclaimed quickly signals that sellers are reassessing Microsoft’s risk profile at a structural level, not merely reacting to a single quarter’s numbers.
How to use these levels as a practical risk framework
The technical map is only useful if it translates into decisions. Here is how to apply these levels around a binary event.
Watching the post-earnings reaction
The headline number matters, but the follow-through matters more. Many large-cap earnings gaps either fade or extend in the 2-3 sessions after the report.
A gap up that holds above short-term support and starts attacking $420, then $471-$487, suggests a genuine re-rating is underway. A gap down that cannot reclaim $369-$371 or the mid-$340s area signals the market is repricing Microsoft’s risk profile structurally, not just reacting to a miss.
Defining your own invalidation points
The key thesis-level decisions are defined by specific prices, not by feelings about the earnings call:
- Long-biased invalidation: A decisive break and hold below the mid-$340s is where the bullish technical case is compromised.
- Short-term bull checkpoints: $420, then $471-$487. Failure near these zones can justify reducing exposure or tightening stops.
- Corrective thesis invalidation: A sustained break above $487 is where the bearish structure is broken and a new uptrend can begin to be argued.
The practical framework:
- Treat these levels as probability-weighted reference points, not guaranteed floors or ceilings. Earnings surprises can override even well-established technical zones.
- Watch follow-through over 2-3 sessions, not just the initial gap.
- Define invalidation points for each directional thesis before the report, not after.
- Respect the prevailing corrective trend context: until price reclaims and holds above $487, every rally is a counter-trend bounce. Position sizing and time horizon should reflect that.
Sizing positions around these levels is more disciplined than sizing around the earnings number itself. The levels give you structure. The earnings number gives you volatility. Structure is the better anchor for risk management.
For investors wanting to place Microsoft’s technical setup within the broader macro context, our full explainer on Hartnett’s conditional buy triggers covers the specific price levels across MAGS and AUD/JPY that Bank of America identified as prerequisites for a sustained dip-buying opportunity in July 2026.
What the chart cannot tell you, and why that matters before tomorrow
The technical structure heading into 29 July 2026 is clear. The limits of that structure are equally clear.
Three chart facts heading into earnings:
- Support at $344-$371 has held, with buyers defending the zone on the June retest
- Price remains below the 200-DMA at $438.77, confirming the medium-term bias is still corrective
- The recovery above the 200-WMA is a constructive structural signal, reducing the probability of extreme downside scenarios
Three fundamental unknowns the chart cannot resolve:
- Cloud growth trajectory and whether Azure’s acceleration is durable
- AI monetisation rate and whether Copilot revenue is scaling or plateauing
- Margin direction and capital expenditure guidance, which will shape the market’s view of how Microsoft balances growth investment against profitability
Technical levels are reference points, not predictions. The earnings catalyst carries genuine binary risk that no chart can resolve in advance. The purpose of this framework is not to forecast tomorrow’s outcome. It is to ensure you have already defined, before the numbers drop, what each scenario means for your position and your risk tolerance. When the market opens, you will be working from a plan rather than improvising under pressure.
This article is for informational purposes only and should not be considered financial advice. Investors should conduct their own research and consult with financial professionals before making investment decisions. Past performance does not guarantee future results. Technical levels are reference points based on historical price behaviour and are subject to change based on market developments.