Most retail investors are sitting in cash right now, collecting money market yields they assume are the safe move. Meanwhile, Bank of America, one of Wall Street’s largest fixed-income houses, has been building the opposite position: moving into 10-year US Treasuries and arguing the trade offers three independent ways to get paid.
The case is not a simple bet on interest rates falling. BofA‘s institutional models place fair value for the 10-year somewhere in the mid-4% range. With market yields having traded materially above that level, the gap creates what bond investors call cheapness relative to fundamentals. That cheapness generates a potential return cushion from three distinct sources, each of which works under a different set of conditions.
Here is what this analysis covers: the specific valuation gap BofA sees, the mechanics that make the yield number on your screen understate the total return potential, the macro conditions the thesis depends on, and the one risk event that would break all three return sources at once.
The gap Bank of America sees in the 10-year Treasury market
Start with the number on the screen. The 10-year Treasury yield has been trading well above what Bank of America‘s fundamental fair-value models say it should be. Their interest-rate strategists place modelled fair value roughly in the mid-4% area, and they have published a bullish bias on duration whenever yields climb above approximately 4.4-4.45%.
In Treasury terms, even 20-30 basis points (a basis point is one hundredth of a percentage point) of cheapness relative to fundamentals is considered meaningful. The current gap between market yields and BofA‘s fair-value anchor has been larger than that at several points, consistent with their characterisation of the setup as offering a genuine discount.
The inverse relationship between bond yields and prices is purely mathematical: because a bond’s coupon is fixed at issuance, a rise in market yields means the bond must trade at a discount to deliver a competitive return, and that same mechanism is what makes elevated yields look attractive to buyers entering today.
Three data anchors define the framework:
- Fair-value range: Mid-4% area for the 10-year, based on BofA‘s institutional models
- Duration buy trigger: Bullish bias on owning 10-year Treasuries above roughly 4.4-4.45%
- Attractive entry threshold: Yields at or above 5% viewed as a compelling buying opportunity in their base case
BofA views yields near or above 5% as fundamentally attractive buying opportunities in the context of their base-case trajectory, and their updated forecast places the 10-year at approximately 4.75% by end-2025.
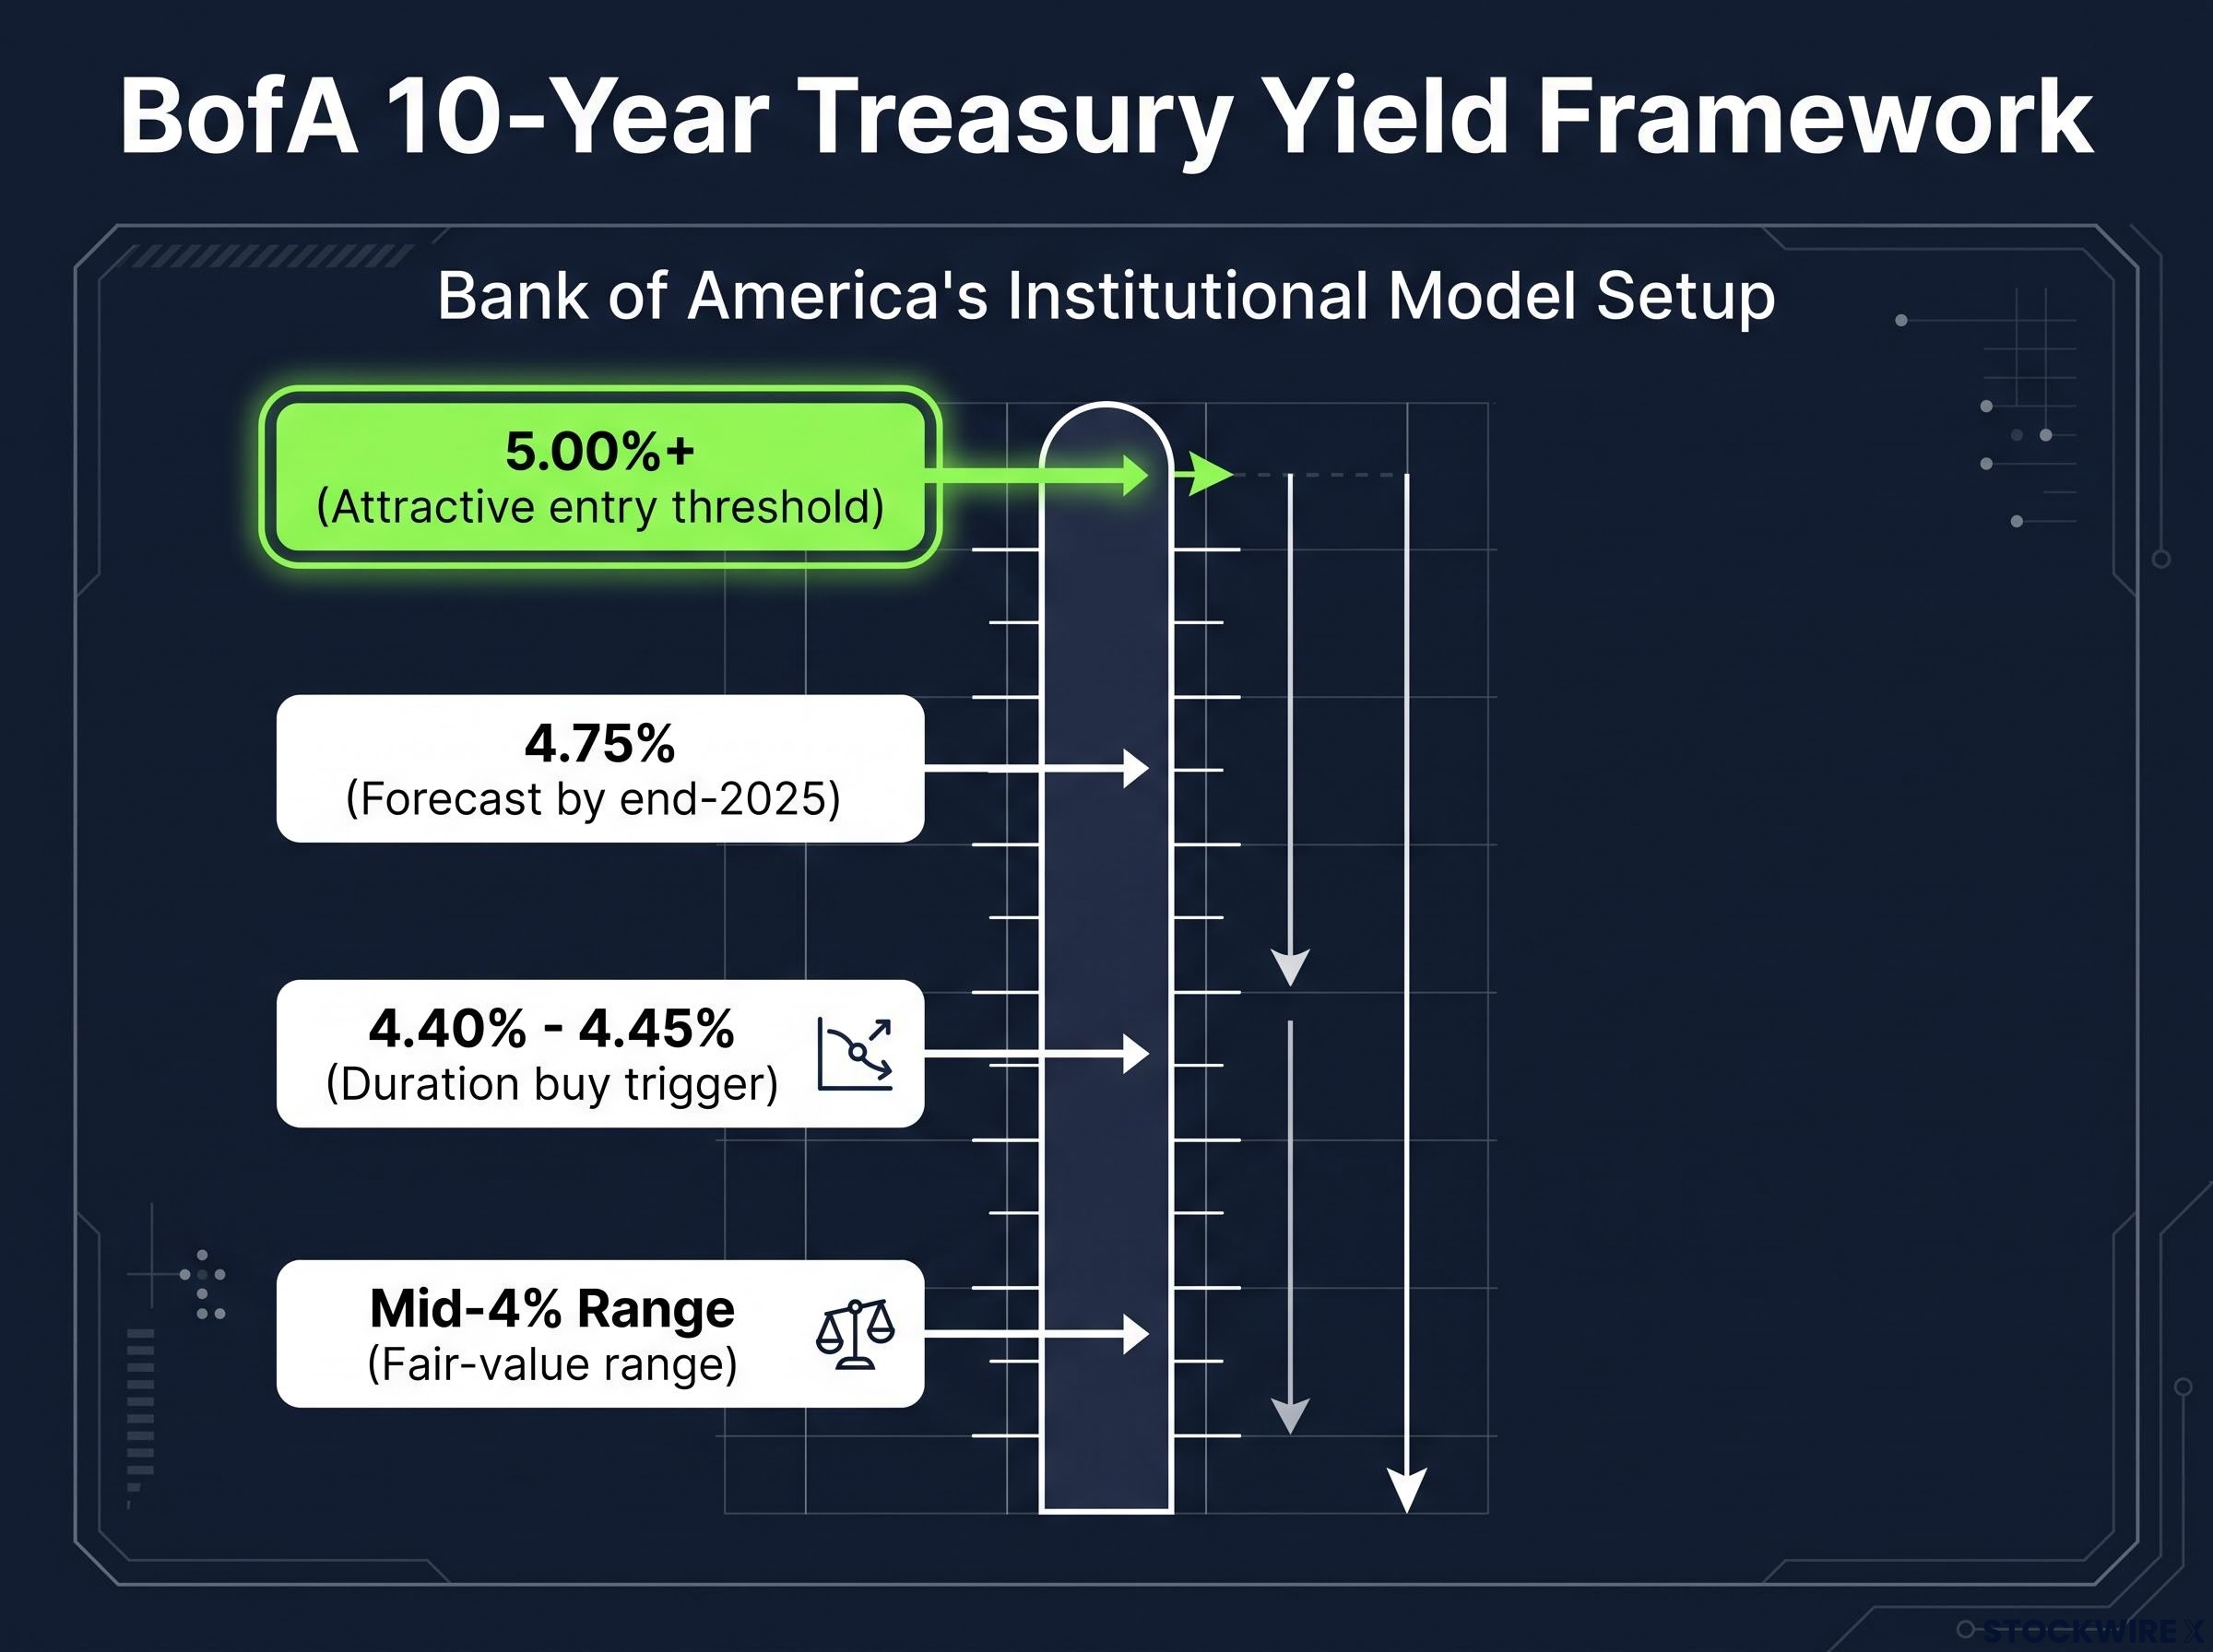
The practical read for you: when an institutional model with a named fair-value anchor characterises current yields as elevated relative to fundamentals, there is a potential return cushion here beyond simply hoping rates fall. That is what separates this setup from a directional rate bet.
When big ASX news breaks, our subscribers know first
What carry and rolldown actually mean for a bond investor
Pull up a 10-year Treasury on any brokerage screen and you see a single number: the yield. What you do not see are the two mechanical layers underneath it that explain why that yield understates the total return potential.
The first layer is carry. Carry is the net income you earn from holding a longer-dated bond while your funding cost (what you could earn in cash or a short-term instrument) is lower. The difference between the two is your carry income. Right now, real yields (the yield after adjusting for inflation) sit above 2%, which means carry is genuinely compensating rather than the token return investors collected through much of the 2010s.
The second layer is rolldown, and this is where most retail investors’ understanding stops.
Why rolldown adds value even if yields stay exactly where they are
Rolldown is the structural price gain a bond earns simply by getting shorter in maturity along a positively sloped yield curve, a curve where longer-dated bonds yield more than shorter-dated ones. A 10-year bond today becomes a 9-year bond in twelve months, then an 8-year bond the year after that. If shorter maturities carry lower yields, the bond’s price rises as it rolls down the curve, even if the overall level of interest rates does not move at all.
This is not rate prediction. It is a mechanical return that exists as long as the yield curve remains upward-sloping.
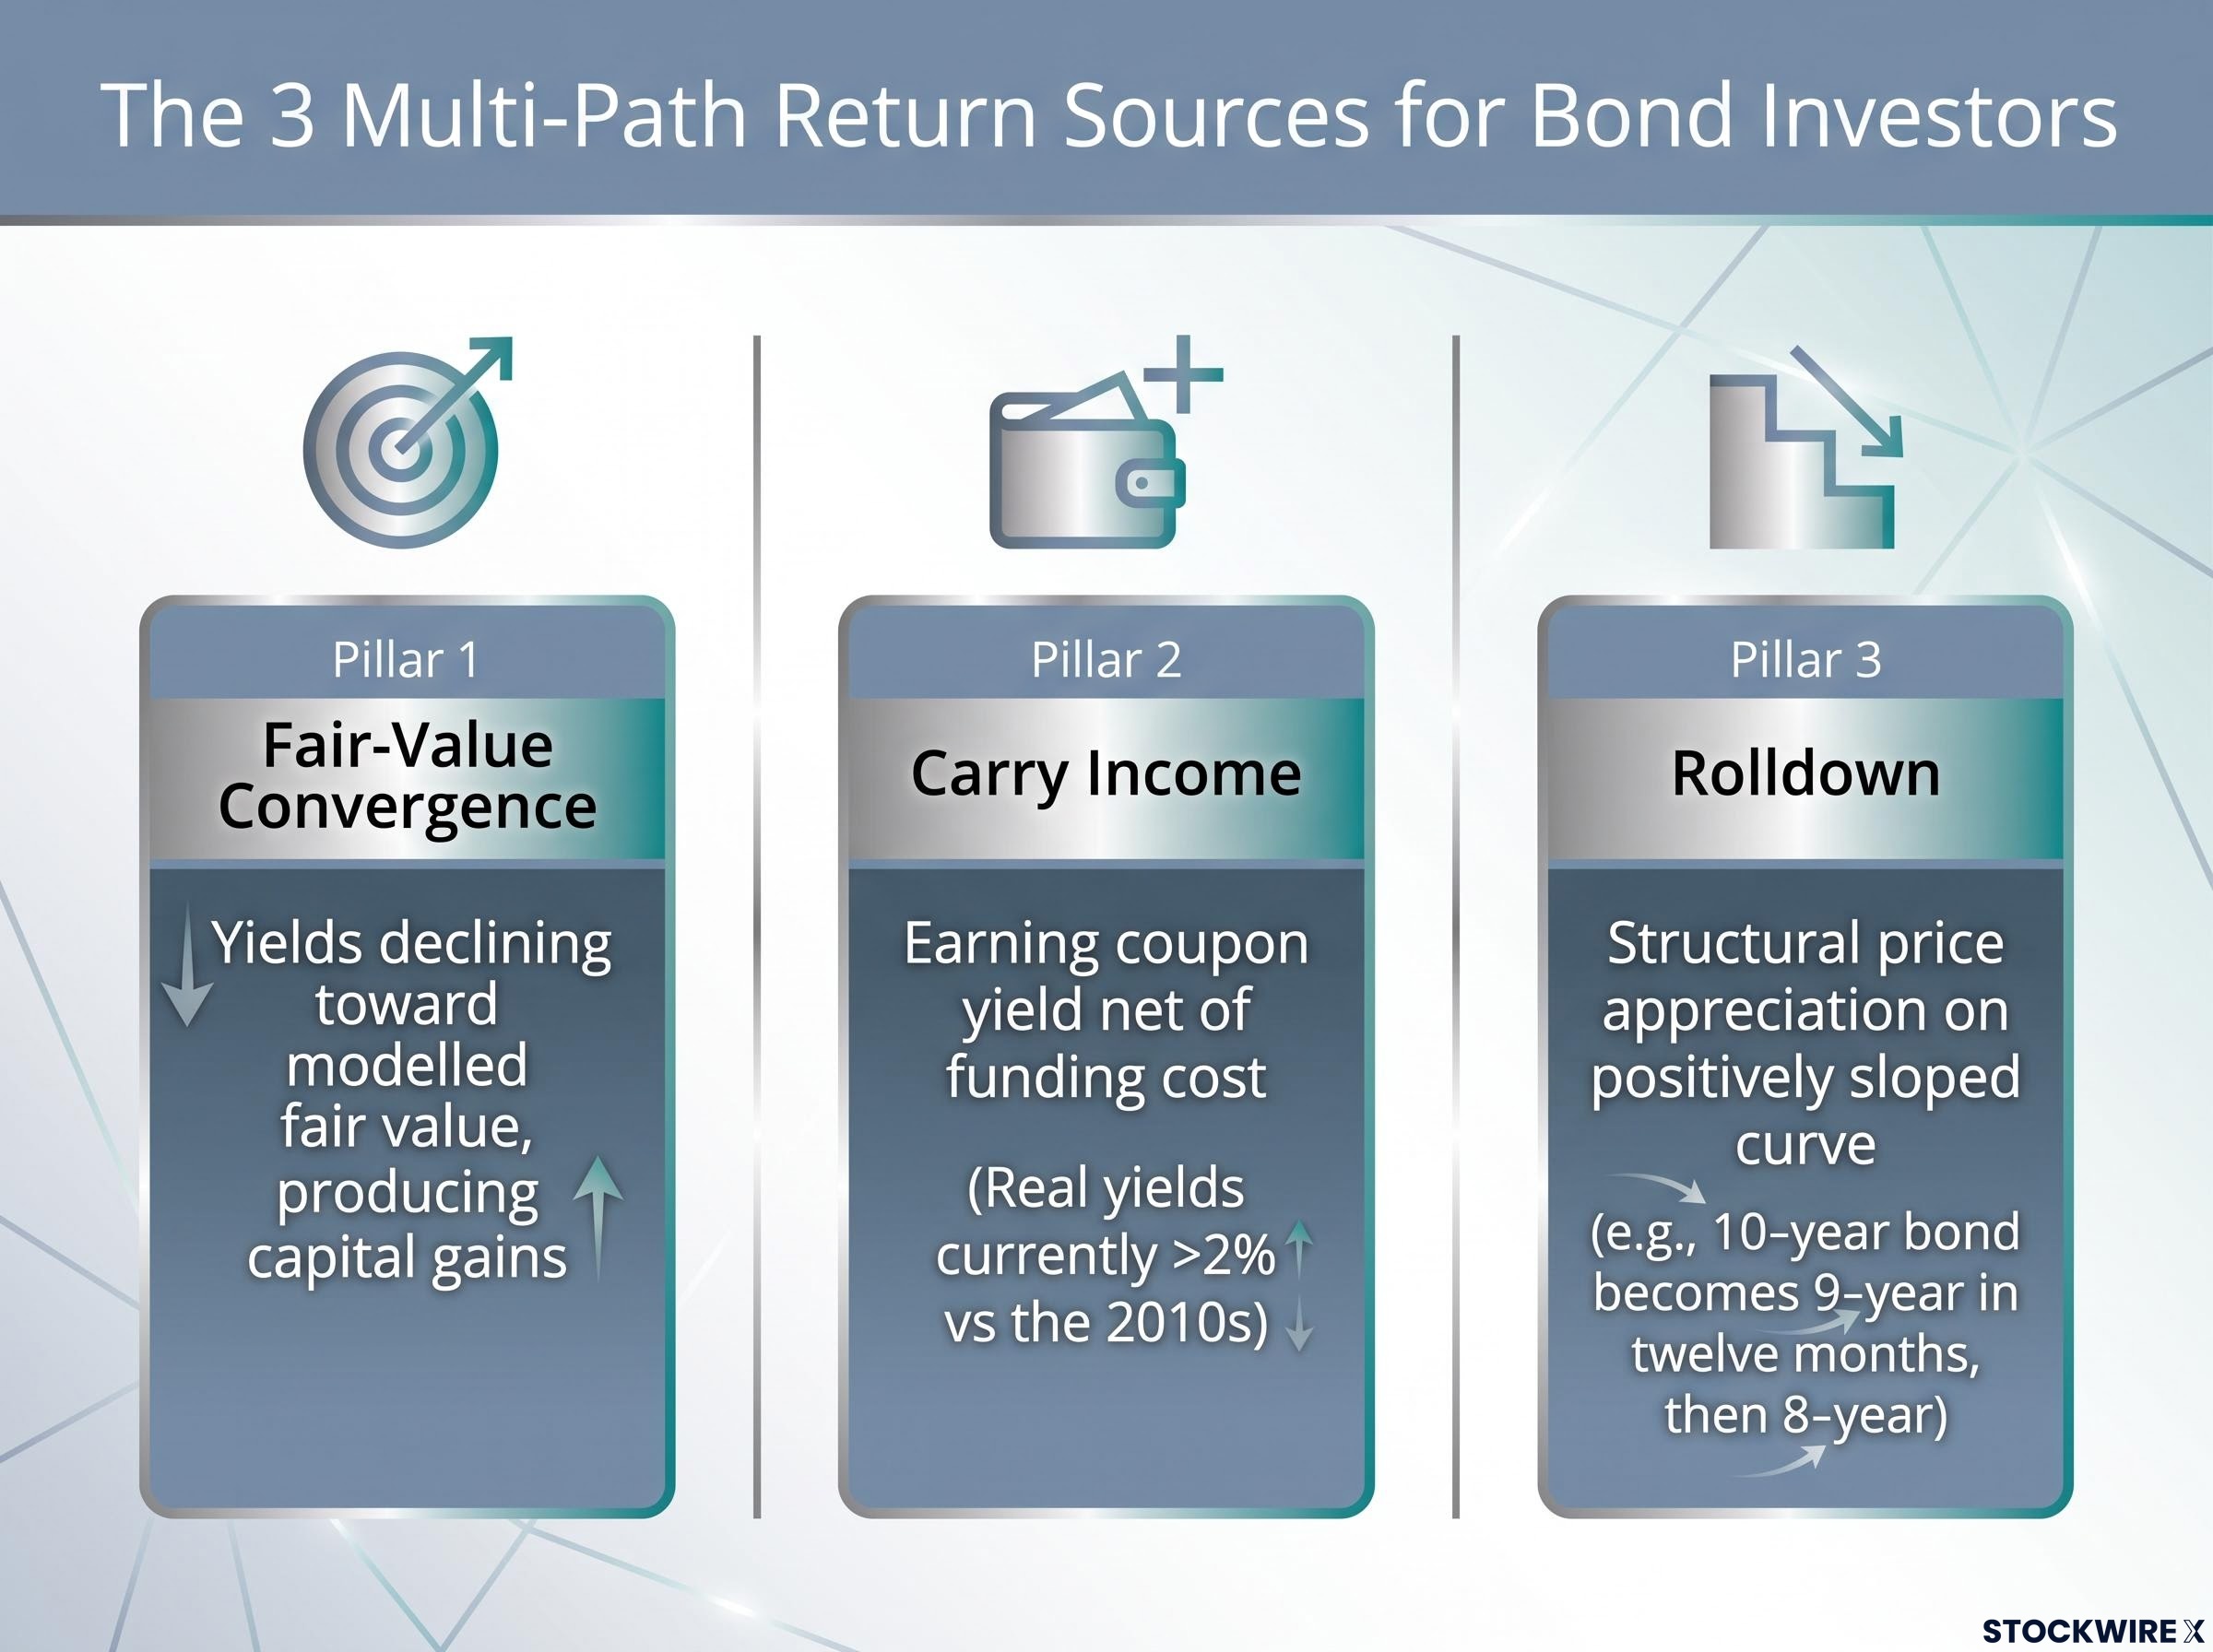
Put the three sources together and you have what institutional fixed-income investors call a multi-path return structure:
- Fair-value convergence: Yields declining toward modelled fair value, producing capital gains
- Carry income: Earning the coupon yield net of your funding cost during the holding period
- Rolldown: Structural price appreciation as the bond shortens along a positively sloped curve
The three paths do not need to work simultaneously. Each pays off under a different scenario, and that is what separates this trade from a binary bet on whether rates go up or down.
The macro backdrop that makes the thesis work right now
Three independent return sources sound attractive in the abstract. The question that matters is whether the current macro environment supports all three at once, or whether the conditions are fragile enough to undermine them. BofA has laid out a specific framework, and its value lies in the fact that each condition is observable and checkable.
Their Global Research team characterises the current US environment as a reflation mini-cycle: sticky inflation, resilient growth, and a policy stance that stays restrictive longer than most investors expected. In practical terms, that means no new rate cuts from the Federal Reserve until at least mid-2027, with rising odds of a 0.25% rate increase over the next year.
The Fed’s June 2026 projections confirm no rate cuts through the near-term horizon, with FOMC participants marking up their federal funds rate path in a manner consistent with BofA’s no-cut-until-mid-2027 framework.
| Macro Condition | Current BofA Assessment | Implication for Carry Trade |
|---|---|---|
| Inflation trajectory | Sticky, driven partly by oil prices | Supports higher nominal yields, reinforcing carry income |
| Fed policy path | No cuts until mid-2027; rising hike odds | No policy rescue for bond prices; carry must do the work |
| Growth outlook | Firm expansion; recessionary risk well contained | Supports stable rate environment for carry strategies |
| Rate volatility | Holding broadly steady even as the Fed outlook turns more hawkish | Narrow outcome distribution favours holding carry positions |
The stability of rate volatility is the most underappreciated condition in the table. Even as investors have priced a more hawkish Fed trajectory, actual rate volatility has remained contained. The implication is that markets are absorbing the policy shift without treating the wider economic environment as fundamentally unpredictable, which is a supportive backdrop for carry positions.
For you, the practical implication is clear: the Fed is unlikely to cut rates and rescue bond prices in the near term. The case rests entirely on carry income and fair-value convergence rather than a policy pivot.
The one risk that could unwind the entire trade
Every carry trade has a specific adversary. For this one, it is a deepening of Middle East hostilities that pushes oil prices sharply and persistently higher. BofA‘s CIO has explicitly flagged oil prices, stock volatility, inflation, and bond yields as the variables being monitored for signs of near-term destabilisation.
The reason this risk deserves more than a bullet-point mention is that a major oil shock does not just hurt the trade in one way. It attacks all three return sources through sequential channels:
Oil shock transmission across asset classes follows a sequential rather than simultaneous pattern: energy-driven inflation forces central banks toward hawkish recalibration, which pushes yields higher, which then compresses equity valuations through rising discount rates, creating correlated drawdowns in portfolios that looked diversified before the shock.
- Inflation channel: Higher energy costs re-accelerate inflation, forcing the Fed further into a hawkish stance or even into outright hikes. Yields rise, and your duration position takes mark-to-market losses.
- Growth channel: A large, sustained energy shock erodes real incomes and corporate margins, turning the macro narrative from resilient expansion to rising recession risk, undermining the stable-growth condition the carry thesis depends on.
- Volatility channel: Geopolitical escalation typically raises rate and cross-asset volatility. Carry strategies rely on a relatively narrow distribution of outcomes; elevated volatility widens that distribution and makes holding positions mechanically and psychologically harder.
Owning this trade means being implicitly short an oil-shock-plus-escalation scenario. That is not a generic tail risk; it is the specific compound event the carry thesis is short, and it has direct correlation implications for investors who already hold energy-sector positions.
The yield rises since the onset of Middle East tensions have already tightened financial conditions across the curve. If oil prices spike materially from current levels, the three return sources do not each fail independently by coincidence. A single geopolitical event triggers all three failure modes simultaneously, which is why position sizing matters more than it might appear for a trade that looks, on the surface, like a conservative bond allocation.
How retail investors can think about sizing and time horizon
The analytical framework is only useful if it translates into a practical decision. The most common mistake retail investors make with a trade like this is treating it as a short-term macro bet when the mechanics are multi-month to multi-year dynamics.
Fair-value convergence does not happen in a week. Rolldown accumulates gradually as the bond shortens along the curve. Being early has a real cost, but here is what changes the calculus: the elevated carry partially offsets that cost. Current nominal and real yields are materially higher than during the 2010s, meaning you are paid a substantially higher income stream while waiting for convergence. That carry income functions as a structural buffer that reduces the penalty of mistiming the entry.
BofA has been explicit on this point: investors with excess cash should consider locking in longer-term Treasury yields rather than staying in money markets as those yields drift lower from prior peaks.
Key practical considerations before sizing:
- Time horizon: Multi-month to multi-year holding period to capture all three return sources
- Carry as buffer: Elevated real yields above 2% reduce the cost of being early relative to prior low-rate cycles
- Cash vs duration: Money market yields are drifting lower; locking in longer-term yields captures a rate that may not persist
- Correlation with energy holdings: Your existing portfolio exposures affect how much oil-shock risk you are actually taking on
Matching the trade to your existing portfolio exposures
If you already hold meaningful energy-sector positions, you carry a natural partial offset to the primary risk. Energy stocks tend to benefit from the same oil price spike that would damage a duration position. That correlation matters for sizing.
If you do not hold energy exposure, the question to ask yourself is whether adding duration introduces a commodity-inflation sensitivity your portfolio is not currently equipped to absorb. This is not a universal recommendation. It is a portfolio construction question that depends on what you already own.
For investors wanting a step-by-step framework for deciding whether to buy, hold, or shorten duration given current yield levels, our dedicated guide to bond investing strategy in a rising-yield environment covers the duration-risk trade-off, the case against selling after yields have already risen, and how starting yield predicts 5-10 year returns.
What has to remain true for this thesis to hold through 2027
The trade works quietly in the background if three conditions hold simultaneously. It breaks if any one of them fails. The difference between an informed duration position and a guess is knowing which conditions to monitor and what deterioration looks like in observable market data.
BofA frames the relevant horizon as their reflation mini-cycle running through 2027-2028. That is the period over which these conditions need to hold, not indefinitely:
- Stable growth without recession: Watch for sustained deterioration in employment data, consumer spending, or manufacturing activity. A recession would undermine the resilient-growth pillar.
- Contained inflation that does not force new Fed hikes: Watch for core inflation readings that re-accelerate beyond current sticky levels, particularly energy-driven spikes. A forced hiking cycle would push yields higher and damage duration positions.
- Rate volatility that stays in a range consistent with carry returns dominating mark-to-market noise: Watch for a sustained spike in the MOVE index (the bond market’s volatility gauge). Elevated volatility makes the carry return irrelevant against mark-to-market swings.
Fed policy divergence within the FOMC has reached levels not seen since 1992, with four dissenting votes at the April 2026 meeting reflecting genuine internal disagreement over the rate path at precisely the moment BofA’s thesis requires that path to stay restrictive and predictable.
The asymmetry here is worth noting: if these macro conditions hold, the three return sources work quietly and gradually over months. If they break, the break is likely to be fast and correlated across all three, driven by the oil-shock scenario described above.
BofA does not expect a sustained break sharply above 5% in their base case, which frames current yield levels as the relevant entry window rather than a trap. The investor who holds this framework is not waiting passively for rates to fall. You have three observable conditions to monitor and a clear understanding of which single event would trigger a reassessment. That is the difference between an informed duration position and a guess.
This article is for informational purposes only and should not be considered financial advice. Investors should conduct their own research and consult with financial professionals before making investment decisions. Past performance does not guarantee future results. Financial projections are subject to market conditions and various risk factors.