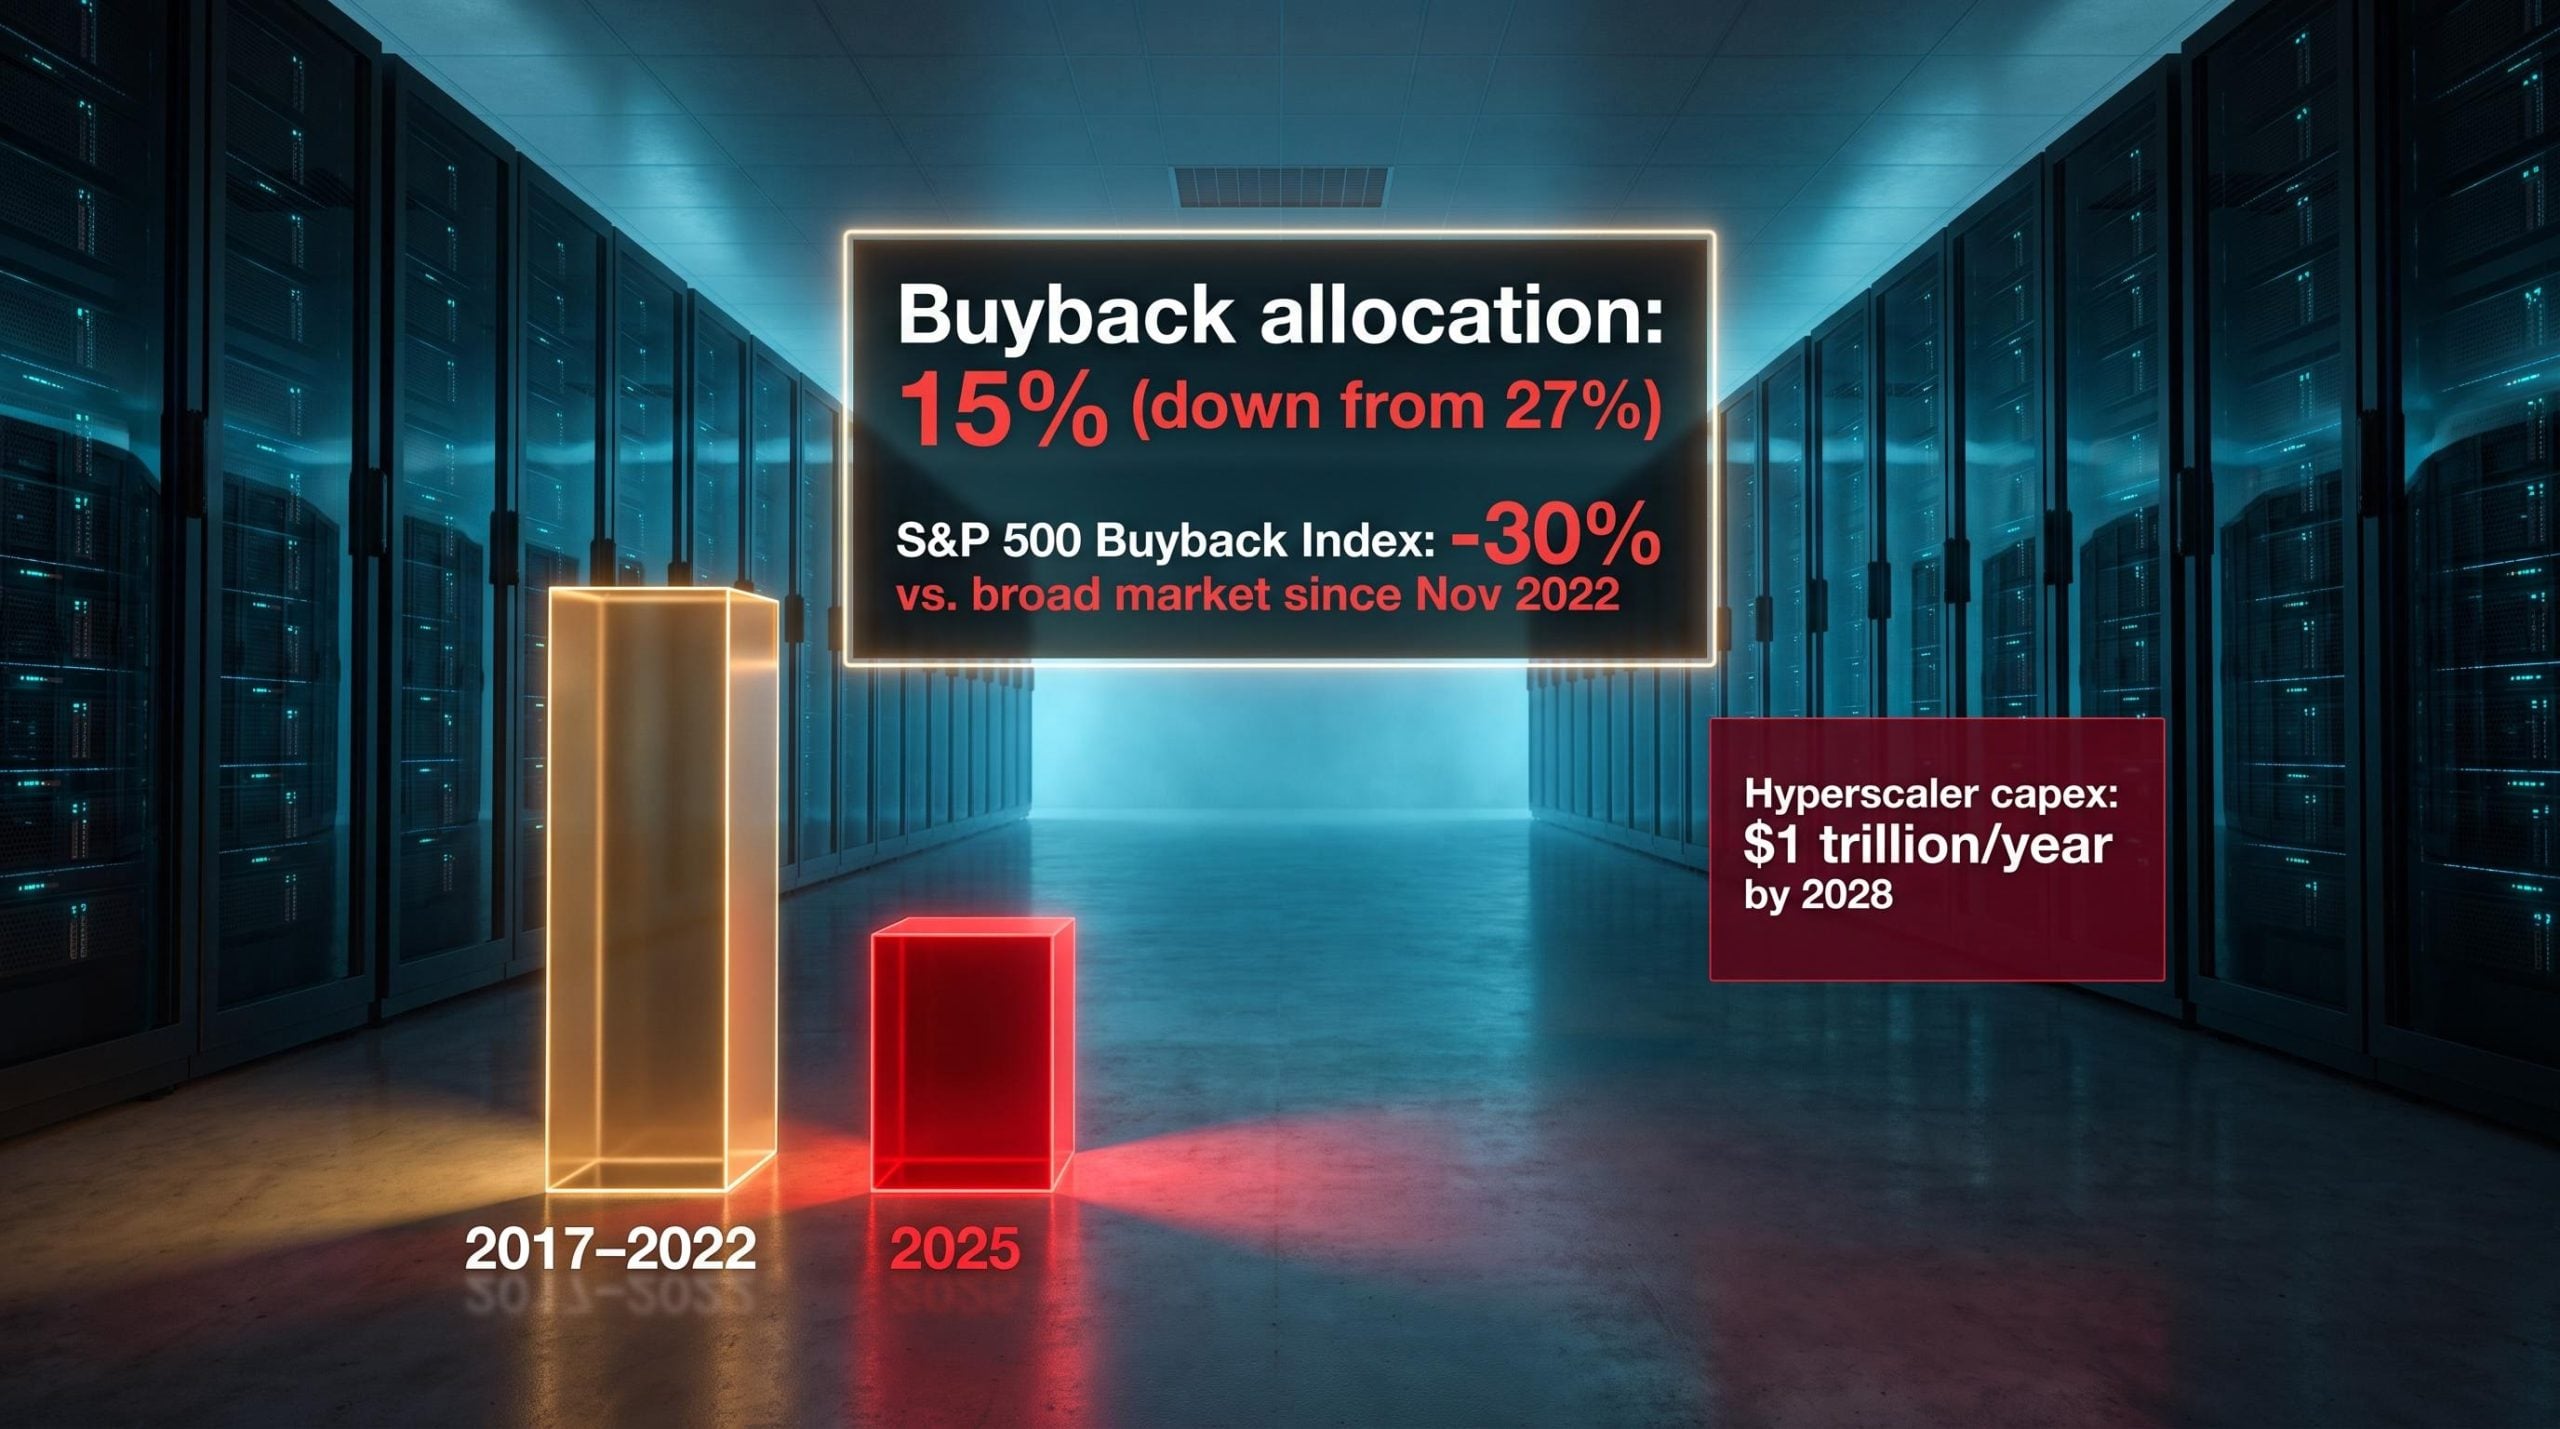
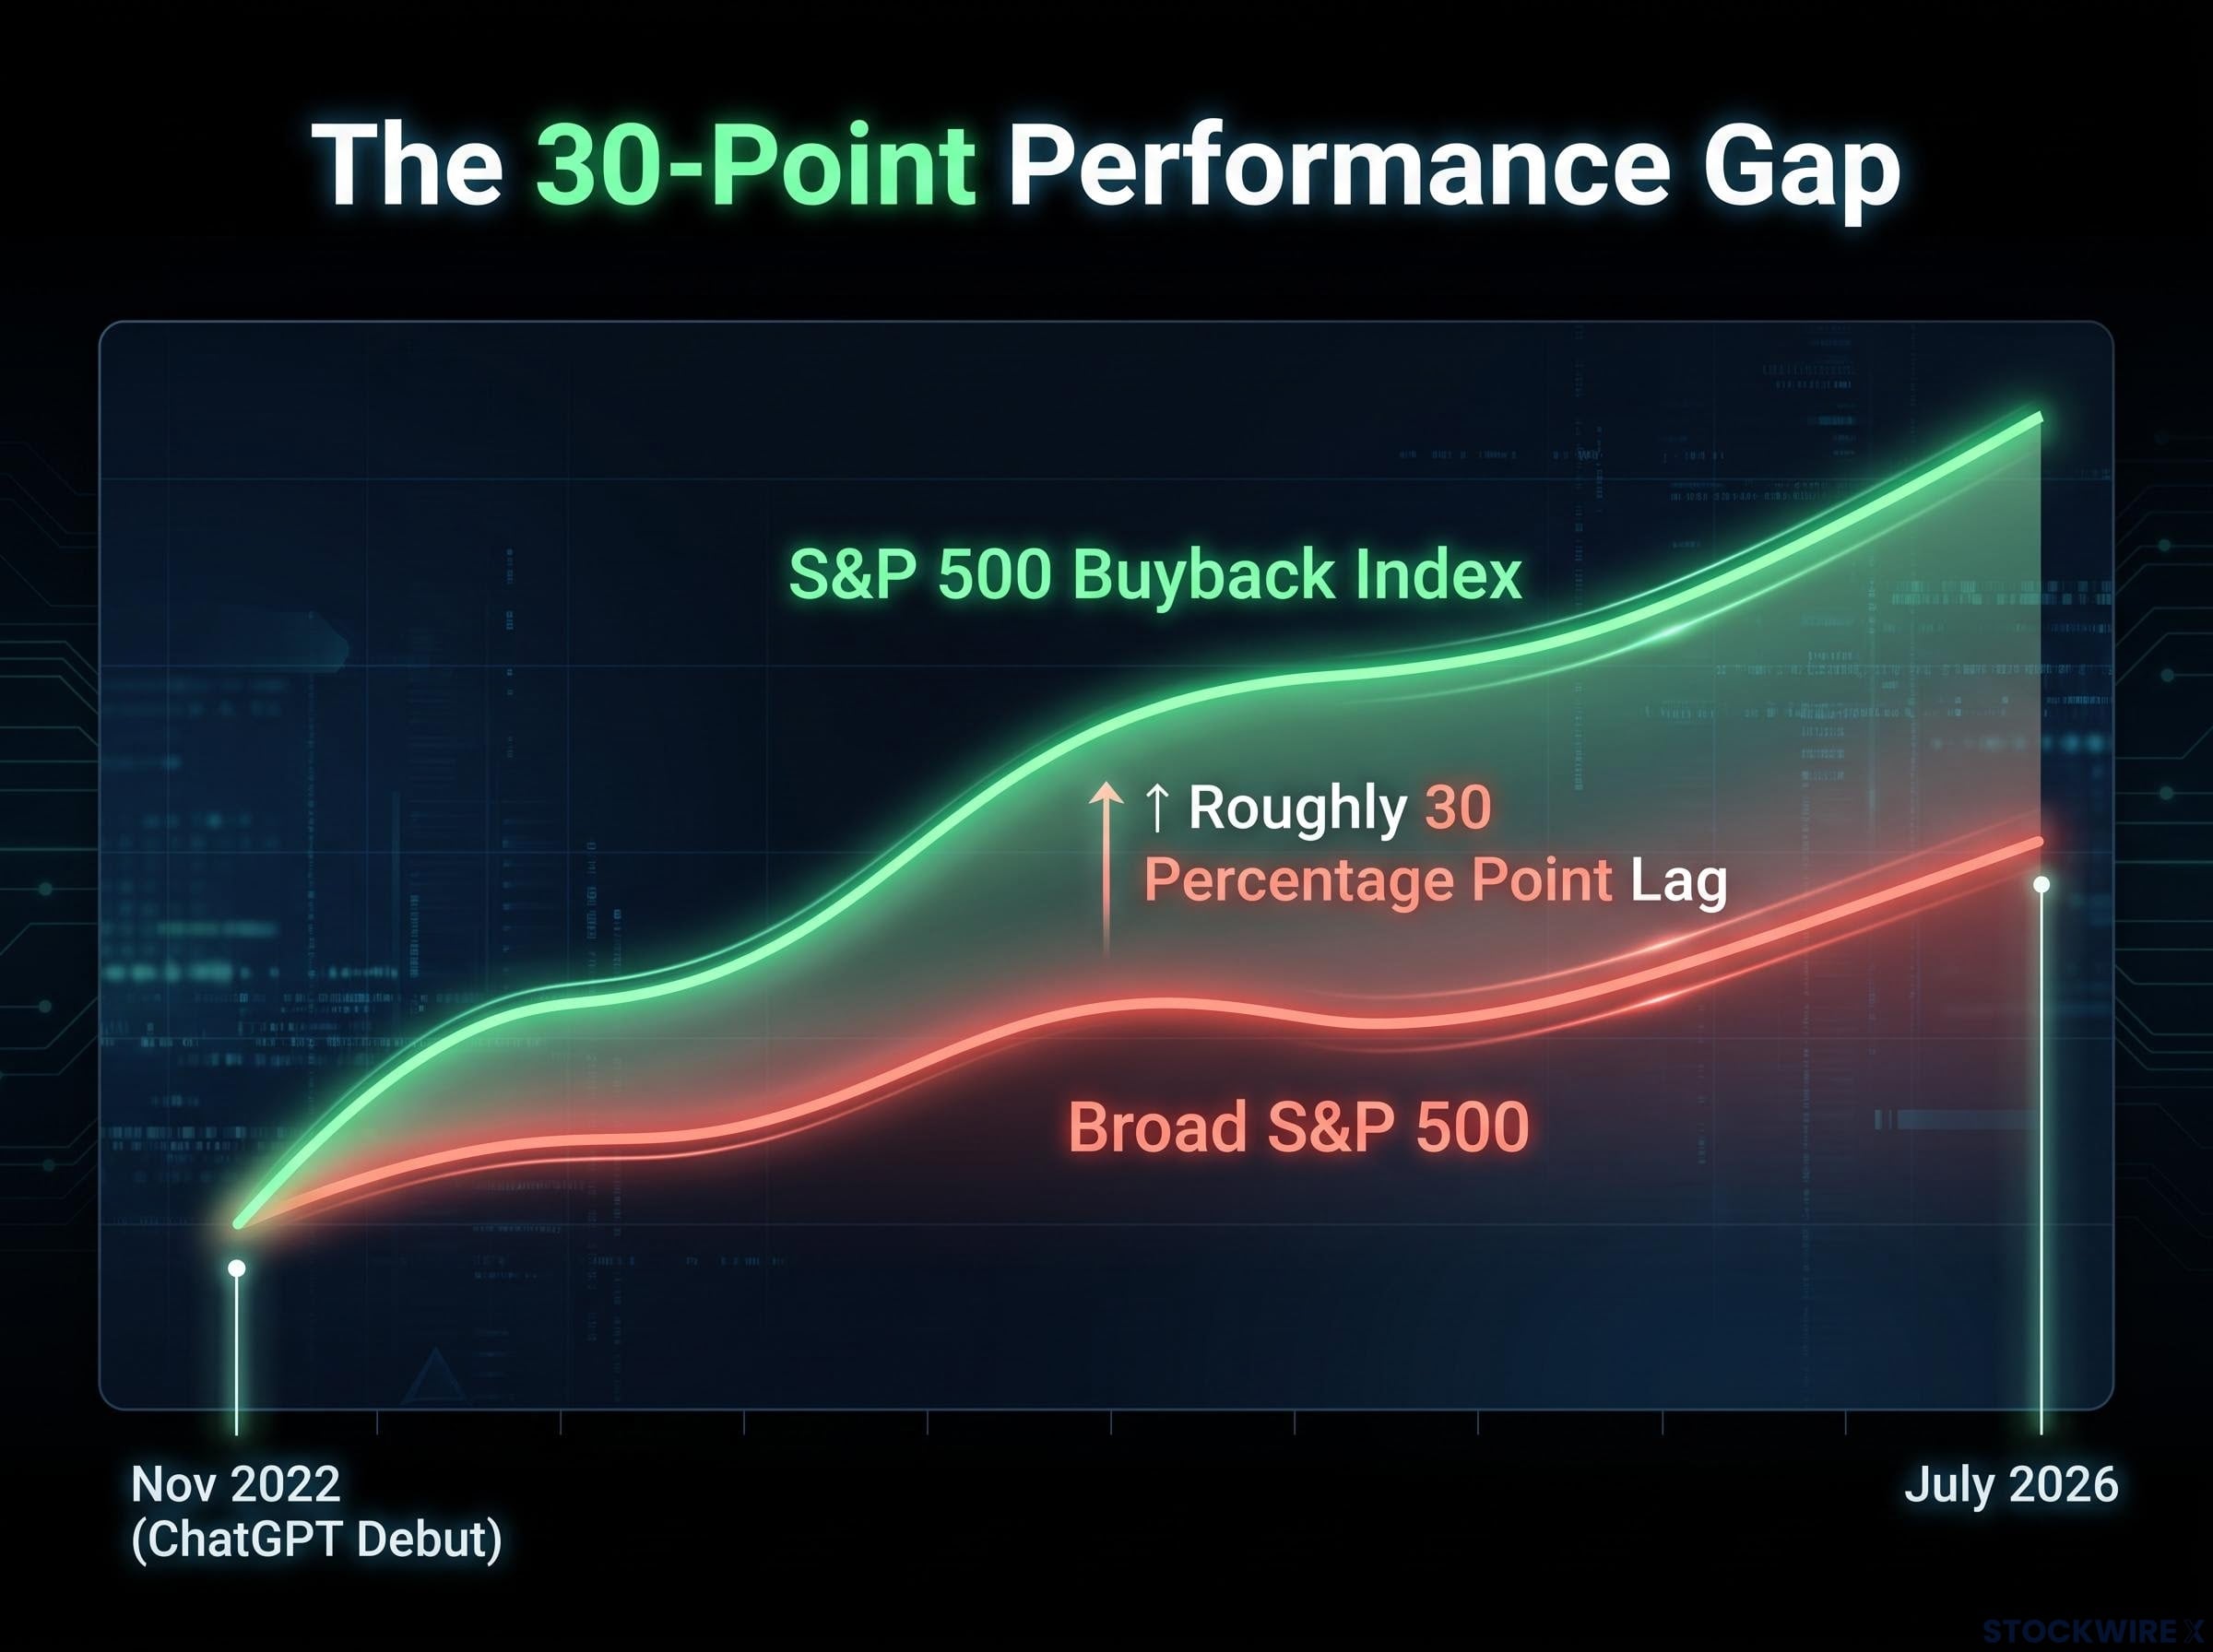
Since ChatGPT launched in late November 2022, the S&P 500 Buyback Index has delivered returns roughly 30% below those of the broad S&P 500. That is not a rounding error or a sector rotation blip. It is a three-and-a-half-year performance gap, and the mechanism behind it is specific: the largest technology companies in the United States stopped buying back their own shares and started building AI infrastructure instead.
The scale of that redirection is now large enough to call it what Barclays calls it: a multi-year capital allocation pivot. According to Barclays, the six largest U.S. tech firms were responsible for over a quarter of all repurchase activity across the S&P 500 during 2024 and 2025. When companies of that weight change how they deploy cash, it does not just affect their own shareholders. It changes the composition of returns across the index.
Here is what the data shows about how much buyback activity has actually fallen, why $1 trillion in annual AI spending makes the shift durable, what it has already done to valuations and strategy performance, and how to think about your exposure to these dynamics right now.
The numbers behind the buyback retreat
Three independent datasets, covering different time horizons and measurement approaches, converge on the same conclusion: Big Tech buybacks have structurally declined, not temporarily paused.
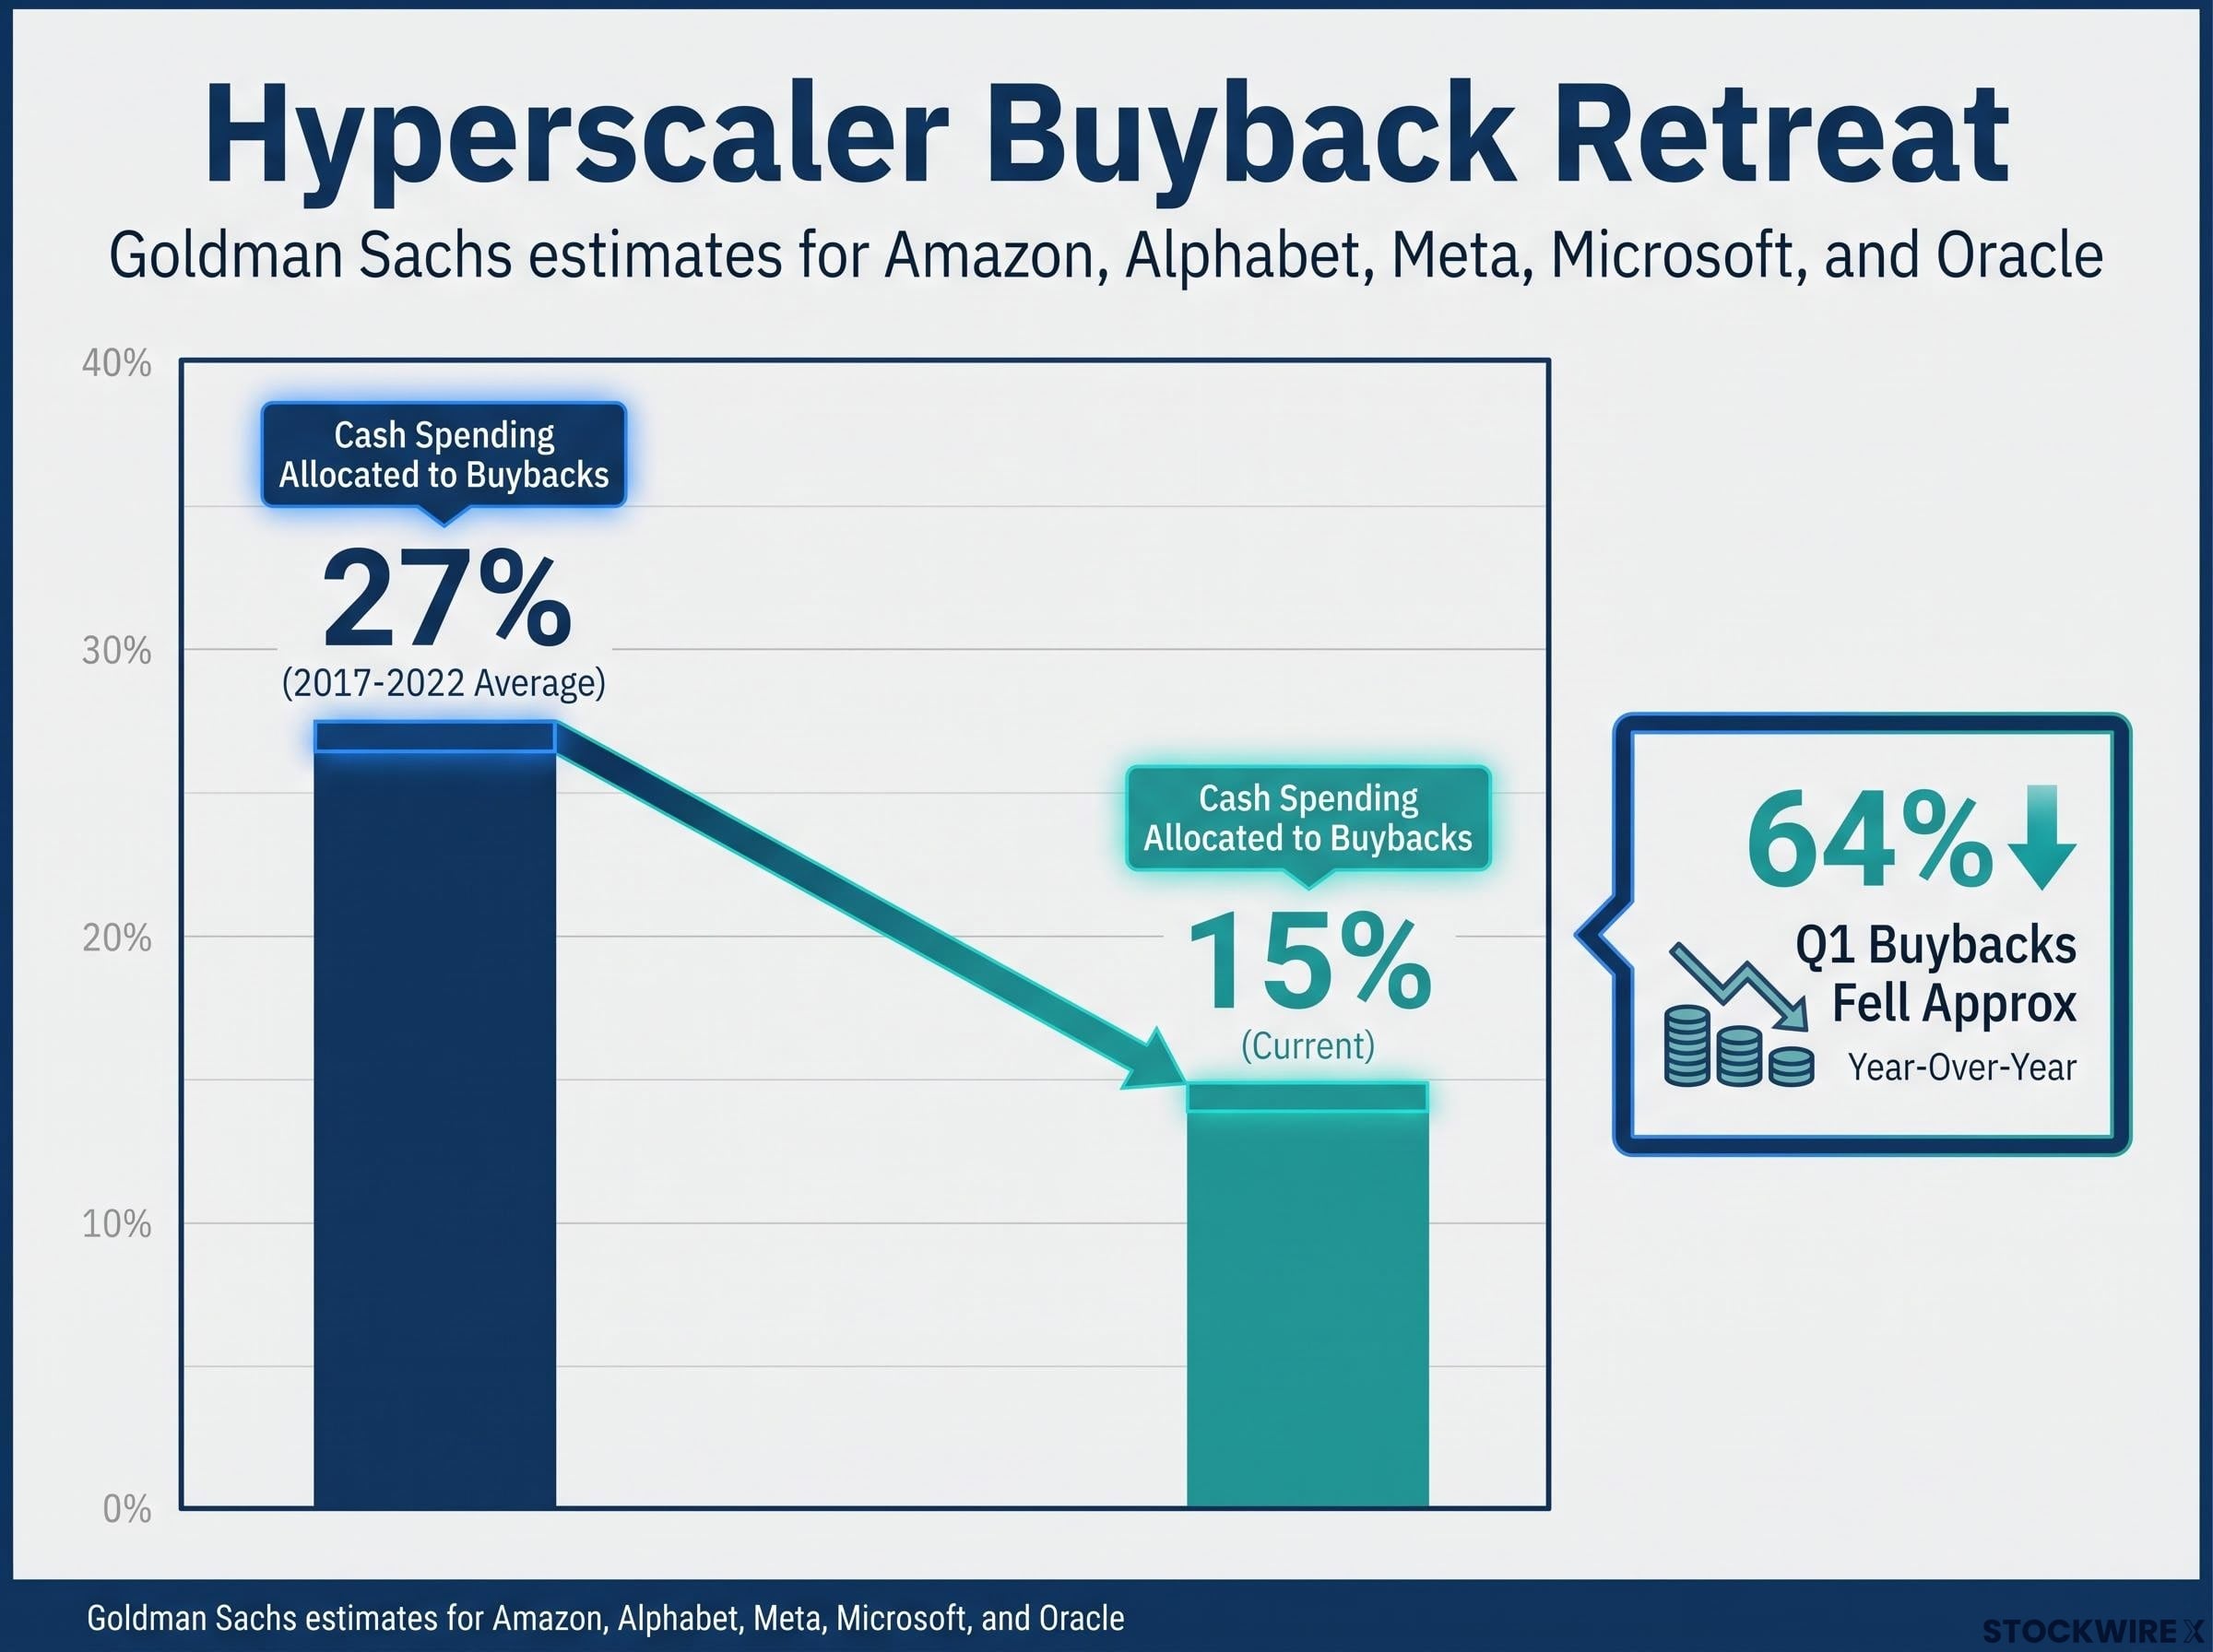
- Goldman Sachs reports that buybacks among five major hyperscalers (Amazon, Alphabet, Meta, Microsoft, and Oracle) fell approximately 64% year-over-year in Q1, with cash redirected to data centres and chips.
- Bloomberg data shows that Alphabet, Microsoft, Amazon, and Meta logged their lowest combined quarterly buybacks since 2019 in the same period.
- Barclays finds that repurchase volumes among the largest technology companies declined by around 17% over the preceding year, a period in which buybacks across the broader S&P 500 continued to grow.
Goldman Sachs estimates that the hyperscaler group now allocates approximately 15% of total cash spending to buybacks, down from an average of 27% during 2017-2022 before the AI capex spike.
That allocation shift, from 27% to 15%, is the single number that captures the regime change most precisely. When three major research houses, using different baselines and different company groupings, all identify the same directional decline, it cannot be explained by any single firm’s idiosyncratic decision. It reflects a coordinated reallocation. If you benchmark Big Tech against its own repurchase history, this is the new baseline, not a temporary aberration.
When big ASX news breaks, our subscribers know first
Why $1 trillion in annual capex changes the math
According to Barclays, hyperscaler capital expenditure is on course to surpass $1 trillion per year by 2028. That figure frames the buyback decline not as a budget choice but as the arithmetic consequence of an infrastructure arms race with multi-year commitments already locked in.
The scale of the current AI investment cycle has already surpassed every prior technology spending peak, with US IT hardware and software expenditure reaching 4.9% of GDP in Q1 2026, exceeding both the dot-com era high of approximately 4.2% and the cloud buildout peak, a comparison that contextualises just how structurally different this capex environment is from anything hyperscalers have navigated before.
The spending is not a one-off surge. It represents ongoing procurement of chips, construction of data centres, and expansion of energy infrastructure to power them.
From asset-light to asset-heavy: what that means in practice
For most of the past decade, the largest technology companies operated asset-light models, meaning they generated enormous free cash flow (FCF, the cash left after a company pays its operating costs and capital investments) relative to their physical infrastructure. That profile is changing. Maintaining AI compute and data-centre capacity is now an ongoing capital requirement, not a temporary investment that ends when a facility is built.
The practical demands include:
- Continuous data-centre construction across multiple geographies
- Accelerating chip procurement cycles as AI model sizes grow
- Energy infrastructure buildouts to support power-intensive compute operations
American Century has flagged that AI spending at current levels is threatening profits and balance sheets, raising doubts about whether revenue growth can justify the outlays. Barclays adds a secondary factor: lower stock-based compensation following workforce reductions may have reduced the mechanical necessity for buybacks at some firms, independent of capex pressure.
The result is that investors can no longer evaluate Big Tech using the FCF-plus-buybacks framework that worked from 2017 to 2022. The ongoing cost of compute and data-centre capacity is now a structural feature of the income statement, not a temporary capital item.
How hyperscalers are funding the buildout
When a company spends more on infrastructure than its operating cash flow can comfortably cover, it needs to find additional funding. The hyperscalers are now using a multi-channel toolkit that goes well beyond internal cash generation, and the balance sheet complexity that creates is itself an analytical signal.
Internal free cash flow is being heavily absorbed by capex. For the core AI spenders, capital expenditure consumes the vast majority of operating cash, leaving limited residual for buybacks or dividends.
Goldman Sachs warns that maintaining traditional buyback levels at current AI investment rates would require meaningfully more leverage (borrowing relative to equity), or reduced investment plans. Neither option is costless.
Hyperscaler debt issuance reached $121 billion in 2025, roughly four times the five-year average, with another $100 billion projected for 2026, making the leverage trajectory one of the most consequential balance sheet variables to track alongside the buyback decline.
Bloomberg highlights a rise in new equity issuance alongside falling buybacks, and Barclays notes that firms are turning to a broader mix of financing instruments, including new debt, share issuance, and convertible securities (bonds that can be converted into shares at a later date), rather than relying on operating cash flows alone.
| Funding channel | What it is | Why it is being used now | Key risk |
|---|---|---|---|
| Internal FCF | Cash generated from operations after routine capital spending | First source tapped, but AI capex is absorbing most of it | Leaves little residual for buybacks or dividends |
| New debt | Corporate bonds or credit facilities | Bridges the gap between FCF and total capex needs | Raises leverage ratios and interest burden |
| Equity issuance | Selling new shares to raise capital | Avoids adding debt but dilutes existing shareholders | Dilution offsets the EPS support buybacks once provided |
| Convertible instruments | Bonds that convert to equity at a specified price | Lower initial interest cost than straight debt | Potential dilution if converted; adds balance sheet complexity |
The “fortress cash plus massive buybacks” profile that characterised Big Tech for much of the 2017-2022 period is fading. A company issuing equity to buy AI infrastructure while simultaneously cutting buybacks is making a very different capital allocation bet than one that simply paused repurchases temporarily. Balance sheet metrics, including net leverage, interest coverage, and the scale of new issuance, are now as important as earnings metrics when evaluating these firms.
What compressed multiples and a 30-point performance gap tell you
The market has not waited for investors to update their frameworks. It has already repriced the regime change.
Barclays data shows Big Tech forward multiples (a forward multiple is the stock price divided by expected future earnings, used to gauge how expensive a stock is relative to its projected profits) have declined from roughly 33 times earnings two years ago to under 25 times today, a contraction that reflects the sustained investment cycle being priced directly into valuations.
The performance divergence is equally explicit. The S&P 500 Buyback Index has lagged the broad S&P 500 by around 30 percentage points over the period running from when ChatGPT debuted in late November 2022 through to July 2026.
Cresset characterises buybacks as having “effectively vanished” among the largest AI spenders in recent quarters.
Three signals, read together, tell you where investor preference now sits:
- Multiple compression: Big Tech’s premium valuation is shrinking as near-term FCF and EPS growth are dampened by the buildout.
- Buyback index underperformance: Strategies that screen for repurchase activity have lost ground as the highest-weight names stopped buying.
- Preference shift toward AI monetisation: Both Cresset and Barclays find that markets are rewarding visible growth reinvestment into AI and discounting companies that prioritise near-term buybacks over long-duration expansion.
A 30-percentage-point performance gap over roughly three and a half years is not attributable to market noise. If your portfolio tilts toward buyback yield as a quality signal in tech, the factor itself has lost predictive power in the current regime. The market has moved past pre-2022 multiple and yield assumptions, and the data from both Cresset and Barclays explains why.
Investors weighing whether the multiple compression and buyback retreat represent a rational repricing or the early stages of a speculative unwind will find our full explainer on the AI stock bubble debate, which tests the current market against four analytical frameworks and examines where each delivers a different verdict.
Why the broader S&P 500 is not in the same boat
Barclays concludes that the reduced pace of buybacks among major technology firms is not expected to exert meaningful drag on the wider equity market. The key reason is that repurchase activity elsewhere, across the rest of the technology sector and the broader S&P 500, continues to grow.
Goldman Sachs confirms the aggregate picture. S&P 500-wide buybacks remain large and trending higher, though net buyback yield (the percentage of market capitalisation returned through repurchases) is expected to fall to its lowest level since 2020 as market caps grow faster than repurchase volumes.
The composition of buyback support is shifting, not disappearing. The driver is rotating away from hyperscalers toward other sectors with less aggressive AI capex plans.
Two portfolios, two different problems
If you hold a diversified index position:
- Aggregate buyback-driven demand remains intact and is growing
- The composition of that demand is rotating, but total index-level support is not declining
- Net buyback yield is compressing because market caps are rising faster than repurchase volumes
- Your exposure to the hyperscaler pullback depends on index weighting, not on the buyback trend itself
If you hold concentrated Big Tech positions:
- The support from repurchases at those specific names is clearly weaker
- Returns increasingly hinge on proving economic payback from AI investments
- The mechanical EPS support that buybacks once provided has structurally declined
- Relative performance against the broad index has already reflected this shift
The regime change is concentrated, not broad. Portfolio-level risk depends almost entirely on how much of your exposure sits in the hyperscaler cohort.
Index concentration risk compounds the buyback story for passive investors: with the Magnificent Seven representing approximately 33.7% of S&P 500 market cap, the capital allocation decisions of five or six companies now carry direct consequences for the benchmark returns of portfolios that hold no individual stock positions at all.
Variables that will determine whether this bet pays off
The AI capex cycle is a bet, and neither its success nor its failure is predetermined. Three variables will tell you, over the next two to three years, whether the capital reallocation from buybacks to AI infrastructure is creating or eroding shareholder value.
AI revenue growth relative to AI capex growth is the primary signal. Does incremental spending produce commensurate or accelerating revenue? Cresset frames the investor standard clearly: demonstrable AI monetisation pathways are what the market demands. American Century notes the question of whether revenue growth can justify outlays remains open.
FCF recovery and buyback resumption is the second variable. Once major buildouts stabilise, do margins rebound? And do companies restart large repurchase programmes at that point?
Balance sheet leverage trajectory is the third. Given the funding mix evolution, are net leverage ratios, interest coverage, and new issuance volumes trending toward sustainability or toward strain?
| Variable to watch | What a positive signal looks like | What a negative signal looks like |
|---|---|---|
| AI revenue vs. capex growth | Revenue from AI services accelerates faster than capex growth over consecutive quarters | Capex continues rising while AI-attributed revenue remains flat or unquantified |
| FCF recovery and buyback resumption | FCF margins stabilise and companies announce renewed repurchase authorisations | FCF remains compressed and no meaningful buyback resumption materialises |
| Balance sheet leverage trajectory | Net leverage stabilises; new issuance scales down as internal cash covers capex | Leverage ratios rise; new debt, equity, or convertible issuance accelerates |
| Buyback index relative performance | The approximately 30% gap narrows as investor preference rotates back toward cash returns | The gap widens further, confirming the growth-over-returns regime is entrenched |
The most important condition for reversal is whether AI revenue growth accelerates faster than capex growth over the next two to three years. That is the condition under which both the valuation multiple and the buyback index underperformance begin to close. Barclays frames the outer bound of the current cycle as capex exceeding $1 trillion annually by 2028, giving you a rough timeline for when the buildout phase should mature.
What the shift asks of investors right now
The capital allocation regime change in Big Tech is not a hypothetical scenario. It is already active, already priced into multiples, and already visible in a 30-percentage-point performance gap. What it asks of you depends on where your exposure sits.
If you hold concentrated Big Tech positions:
- Weight AI capex efficiency and monetisation metrics more heavily than buyback size
- Revenue per GPU, cloud AI attach rates, and the margin impact of AI services are the valuation anchors that matter now
- Monitor balance sheet evolution, specifically net leverage, interest coverage, and issuance scale
- Recognise that these companies are increasingly infrastructure-driven investments, not straightforward FCF-plus-buybacks stories
If you run a buyback-oriented strategy:
- The S&P 500 Buyback Index has underperformed the broad market by roughly 30% in the period since ChatGPT launched in late 2022
- Buyback-centric screens may regain relevance once the AI spending cycle matures and FCF redeploys to repurchases, but timing that rotation is inherently difficult on current data
- Ensure that names passing your buyback screen also carry credible AI growth catalysts; otherwise the factor may continue to underperform
If you hold a diversified index position:
- Aggregate S&P 500 buyback demand is intact and growing, though net yields are compressing
- The composition of buyback support is rotating away from hyperscalers toward other sectors
- Your degree of concern depends on how concentrated your portfolio is in the largest AI-spending names
The practical implication is not to exit Big Tech or abandon buyback screens categorically. It is to recognise that both strategies require an updated evaluation lens. For Big Tech, the question is AI economic return. For buyback screens, the question is whether the names passing the screen also carry the growth catalysts that the market is now rewarding.
This article is for informational purposes only and should not be considered financial advice. Investors should conduct their own research and consult with financial professionals before making investment decisions. Past performance does not guarantee future results. Financial projections are subject to market conditions and various risk factors.