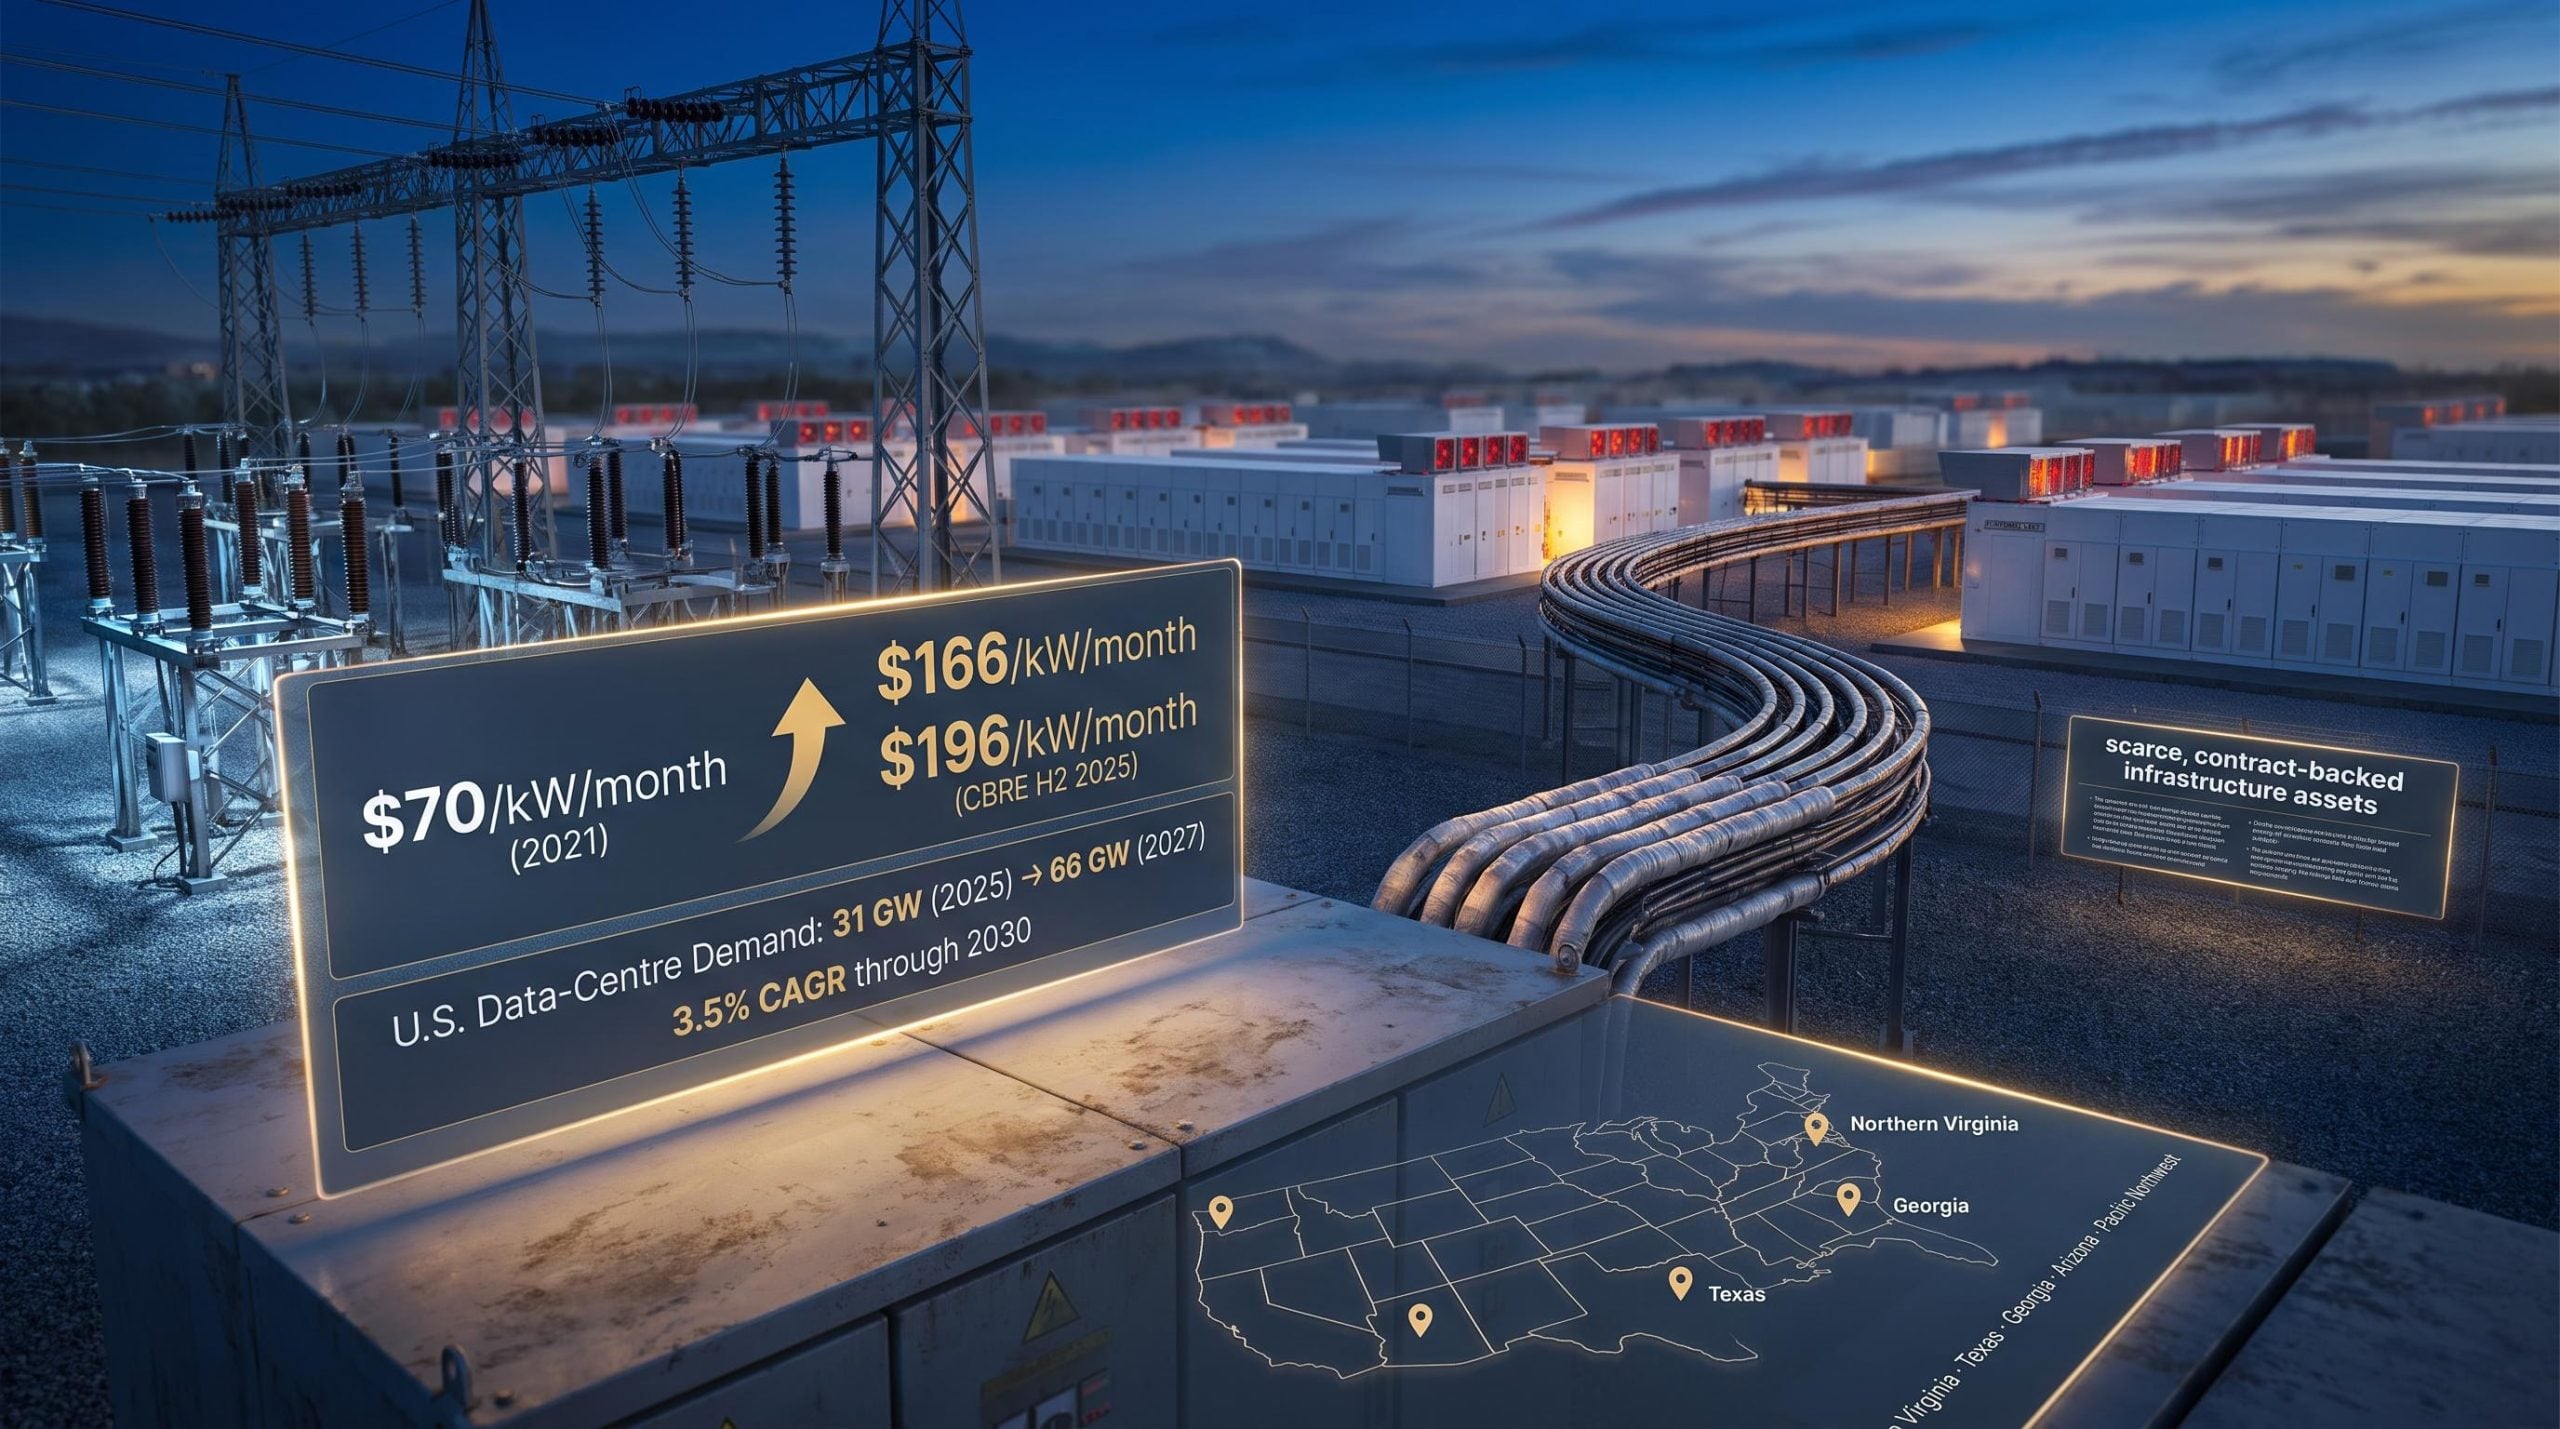
Goldman Sachs just repositioned its AI infrastructure thesis away from the chips and toward the landlords and the power companies. The numbers behind that shift are worth examining closely.
Most investors tracking AI infrastructure have concentrated their attention on semiconductor names and hyperscaler capex announcements. Goldman’s updated thesis argues that the more durable, less crowded return opportunity sits one layer down in the capital stack: the operators who own powered data-centre capacity and the utilities whose grid assets underwrite the buildout. The framing is explicitly infrastructure finance, not technology growth.
Here is the specific case Goldman is making, the two sectors it identifies as primary beneficiaries, and the risks that could interrupt the thesis, so you can evaluate whether and how to position around it.
Why Goldman Sachs is looking past the chip trade
The dominant AI infrastructure narrative has centred on chip designers and hyperscaler capital expenditure cycles. That exposure carries its own risks: cyclical demand swings, competitive product cycles, and the constant pressure of next-generation silicon replacing last year’s hardware. Investors who bought the semiconductor thesis bought a technology trade with technology-trade volatility.
Goldman’s counter-framing shifts the lens entirely. In the bank’s analysis, AI is converting compute capacity and power delivery into contracted, long-duration infrastructure assets. Think of it less as a bet on which chip wins and more as owning the facility where the chips have to run, backed by 15-20-year lease agreements. Goldman characterises AI compute and power as “scarce, contract-backed infrastructure assets.”
Three structural characteristics underpin that framing:
- Asset-heavy balance sheets: GPU hardware in AI centres can cost 3-4 times the building shell, deepening the hard-asset character of these businesses.
- Contracted cash flows: Lease and power purchase agreement (PPA) tenors of 10-20 years provide visibility that semiconductor product cycles cannot match.
- Real-asset collateral: Physical infrastructure, grid interconnection rights, and compute hardware serve as collateral in a structure that resembles infrastructure finance.
Goldman’s two identified primary beneficiaries are neocloud operators and utilities or independent power producers (IPPs), not semiconductor manufacturers or large-cap cloud names. That distinction changes the risk category you are evaluating. This is not a momentum bet on AI adoption rates. It is a thesis about scarcity-backed cash flows with multi-decade contract support, and it belongs in a different part of a portfolio.
The railroad analogy that runs through infrastructure finance history applies here: companies resolving binding constraints on AI deployment, specifically power availability and grid interconnection, have historically captured more durable compounding value than the headline technology providers they enable.
When big ASX news breaks, our subscribers know first
How neocloud pricing power has compounded across the AI buildout cycle
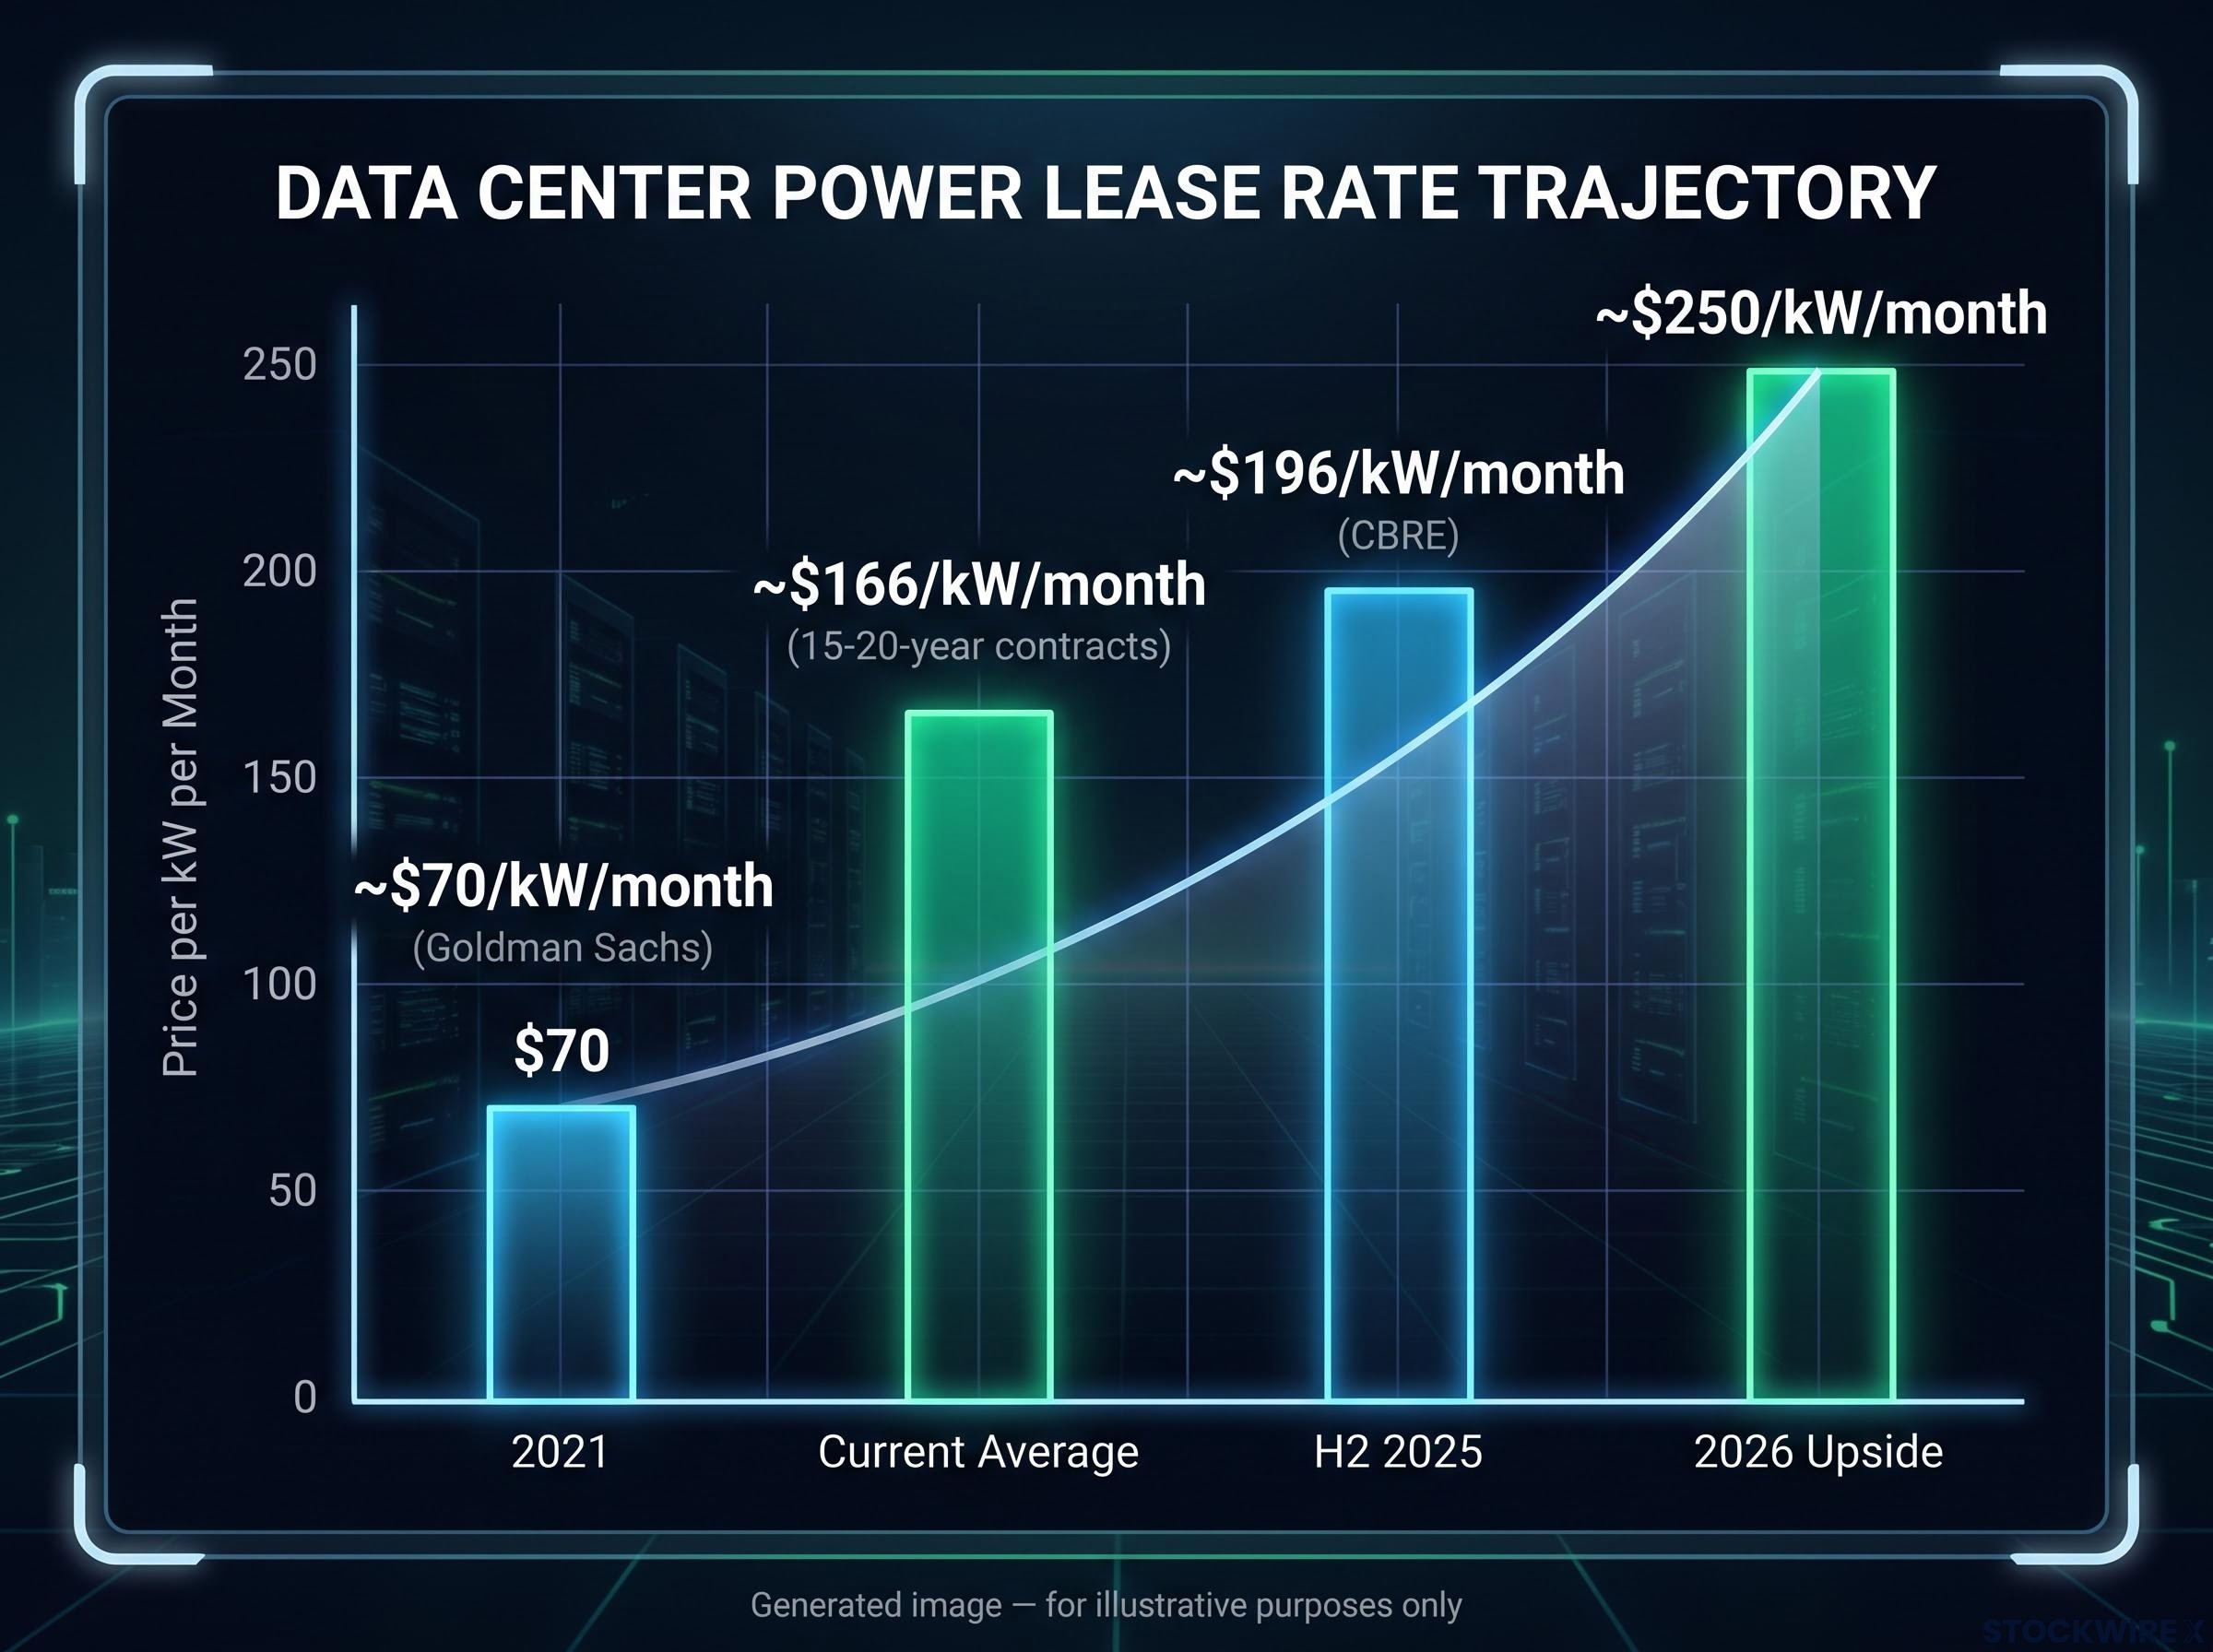
The lease-rate trajectory tells the story before any analyst conclusion does. In 2021, high-capacity data-centre power leased at approximately $70 per kW per month, according to Goldman Sachs. By the time Goldman published its updated thesis, the bank’s reported average had reached approximately $166/kW/month on 15-20-year contracts. CBRE’s H2 2025 primary-market data puts the average for 250-500 kW requirements at approximately $196/kW/month, with Northern Virginia and Chicago ranging from $190-$235/kW/month or higher. Some operators anticipate per-kW pricing could reach approximately $250/kW/month in tight 2026 markets.
| Reference Point | Rate | Source / Context |
|---|---|---|
| 2021 baseline | ~$70/kW/month | Goldman Sachs |
| Goldman current average | ~$166/kW/month | 15-20-year contracts |
| CBRE H2 2025 primary markets | ~$196/kW/month | 250-500 kW requirements |
| Northern Virginia / Chicago range | $190-$235/kW/month+ | CBRE market data |
| 2026 upside scenario | ~$250/kW/month | Some operator expectations |
What is driving this is not a single supply shock. Powered land in primary markets is scarce. Interconnection queues stretch years. Multi-year construction timelines mean new capacity cannot arrive quickly. Historical bulk discounts for 10 MW-plus deployments have largely disappeared. And contracts are lengthening, not shortening.
Primary-market vacancy rates sit at approximately 1% or below (CBRE), even as capacity forecasts are revised upward, meaning new supply is being absorbed as fast as it comes online.
A tripling of per-kilowatt rates over five years, combined with contracts stretching to 15-20 years, tells you that pricing power here is being locked in for the long cycle. This is not a short-term supply squeeze that will self-correct.
What neoclouds actually are, and why early movers hold non-fungible assets
Neocloud operators are GPU-heavy cloud providers and AI-focused colocation firms that assemble large compute clusters and lease that capacity to enterprises, AI startups, and sometimes hyperscalers themselves. GPU-as-a-service (GPU-aaS) is the delivery model: rather than buying and maintaining their own hardware, tenants rent access to pre-built compute infrastructure under multi-year agreements.
To operate, a neocloud must secure three scarce inputs:
- Powered land with firm grid interconnection, meaning a guaranteed electrical connection of sufficient capacity.
- High-density cooling infrastructure capable of managing the heat output of thousands of GPUs operating simultaneously.
- GPU hardware at scale, often costing 3-4 times the building shell itself.
Each input carries its own supply constraint. But it is the first, powered land with grid interconnection, that creates the moat Goldman’s thesis depends on.
Why the interconnection queue changes the competitive calculus
Grid interconnection queues in primary U.S. markets can run years long. A new entrant with capital today cannot replicate an existing operator’s power position on any useful investment timeline. Local permitting and transmission constraints compound the delay beyond the interconnection queue itself.
LBNL interconnection queue data tracking projects through the end of 2025 shows that the median time in queue for projects that reached commercial operation exceeded five years, a figure that quantifies precisely why an operator with existing grid rights holds an advantage no amount of capital can quickly replicate.
Goldman characterises early movers who secured land, power, and hardware as holding “non-fungible assets that cannot be quickly replicated.” New supply is being absorbed quickly, reinforcing the bank’s improved stance on the neocloud segment. A wave of substantial leasing transactions and GPU-aaS contracts that came to market over recent months added further weight to that positive reassessment.
For you, the due-diligence question Goldman’s framework surfaces is not revenue growth rate. It is land-and-power position: which operators secured interconnection rights in constrained markets, and at what cost basis.
U.S. grid demand at an inflection point: what accelerating data centre consumption means for utility investors
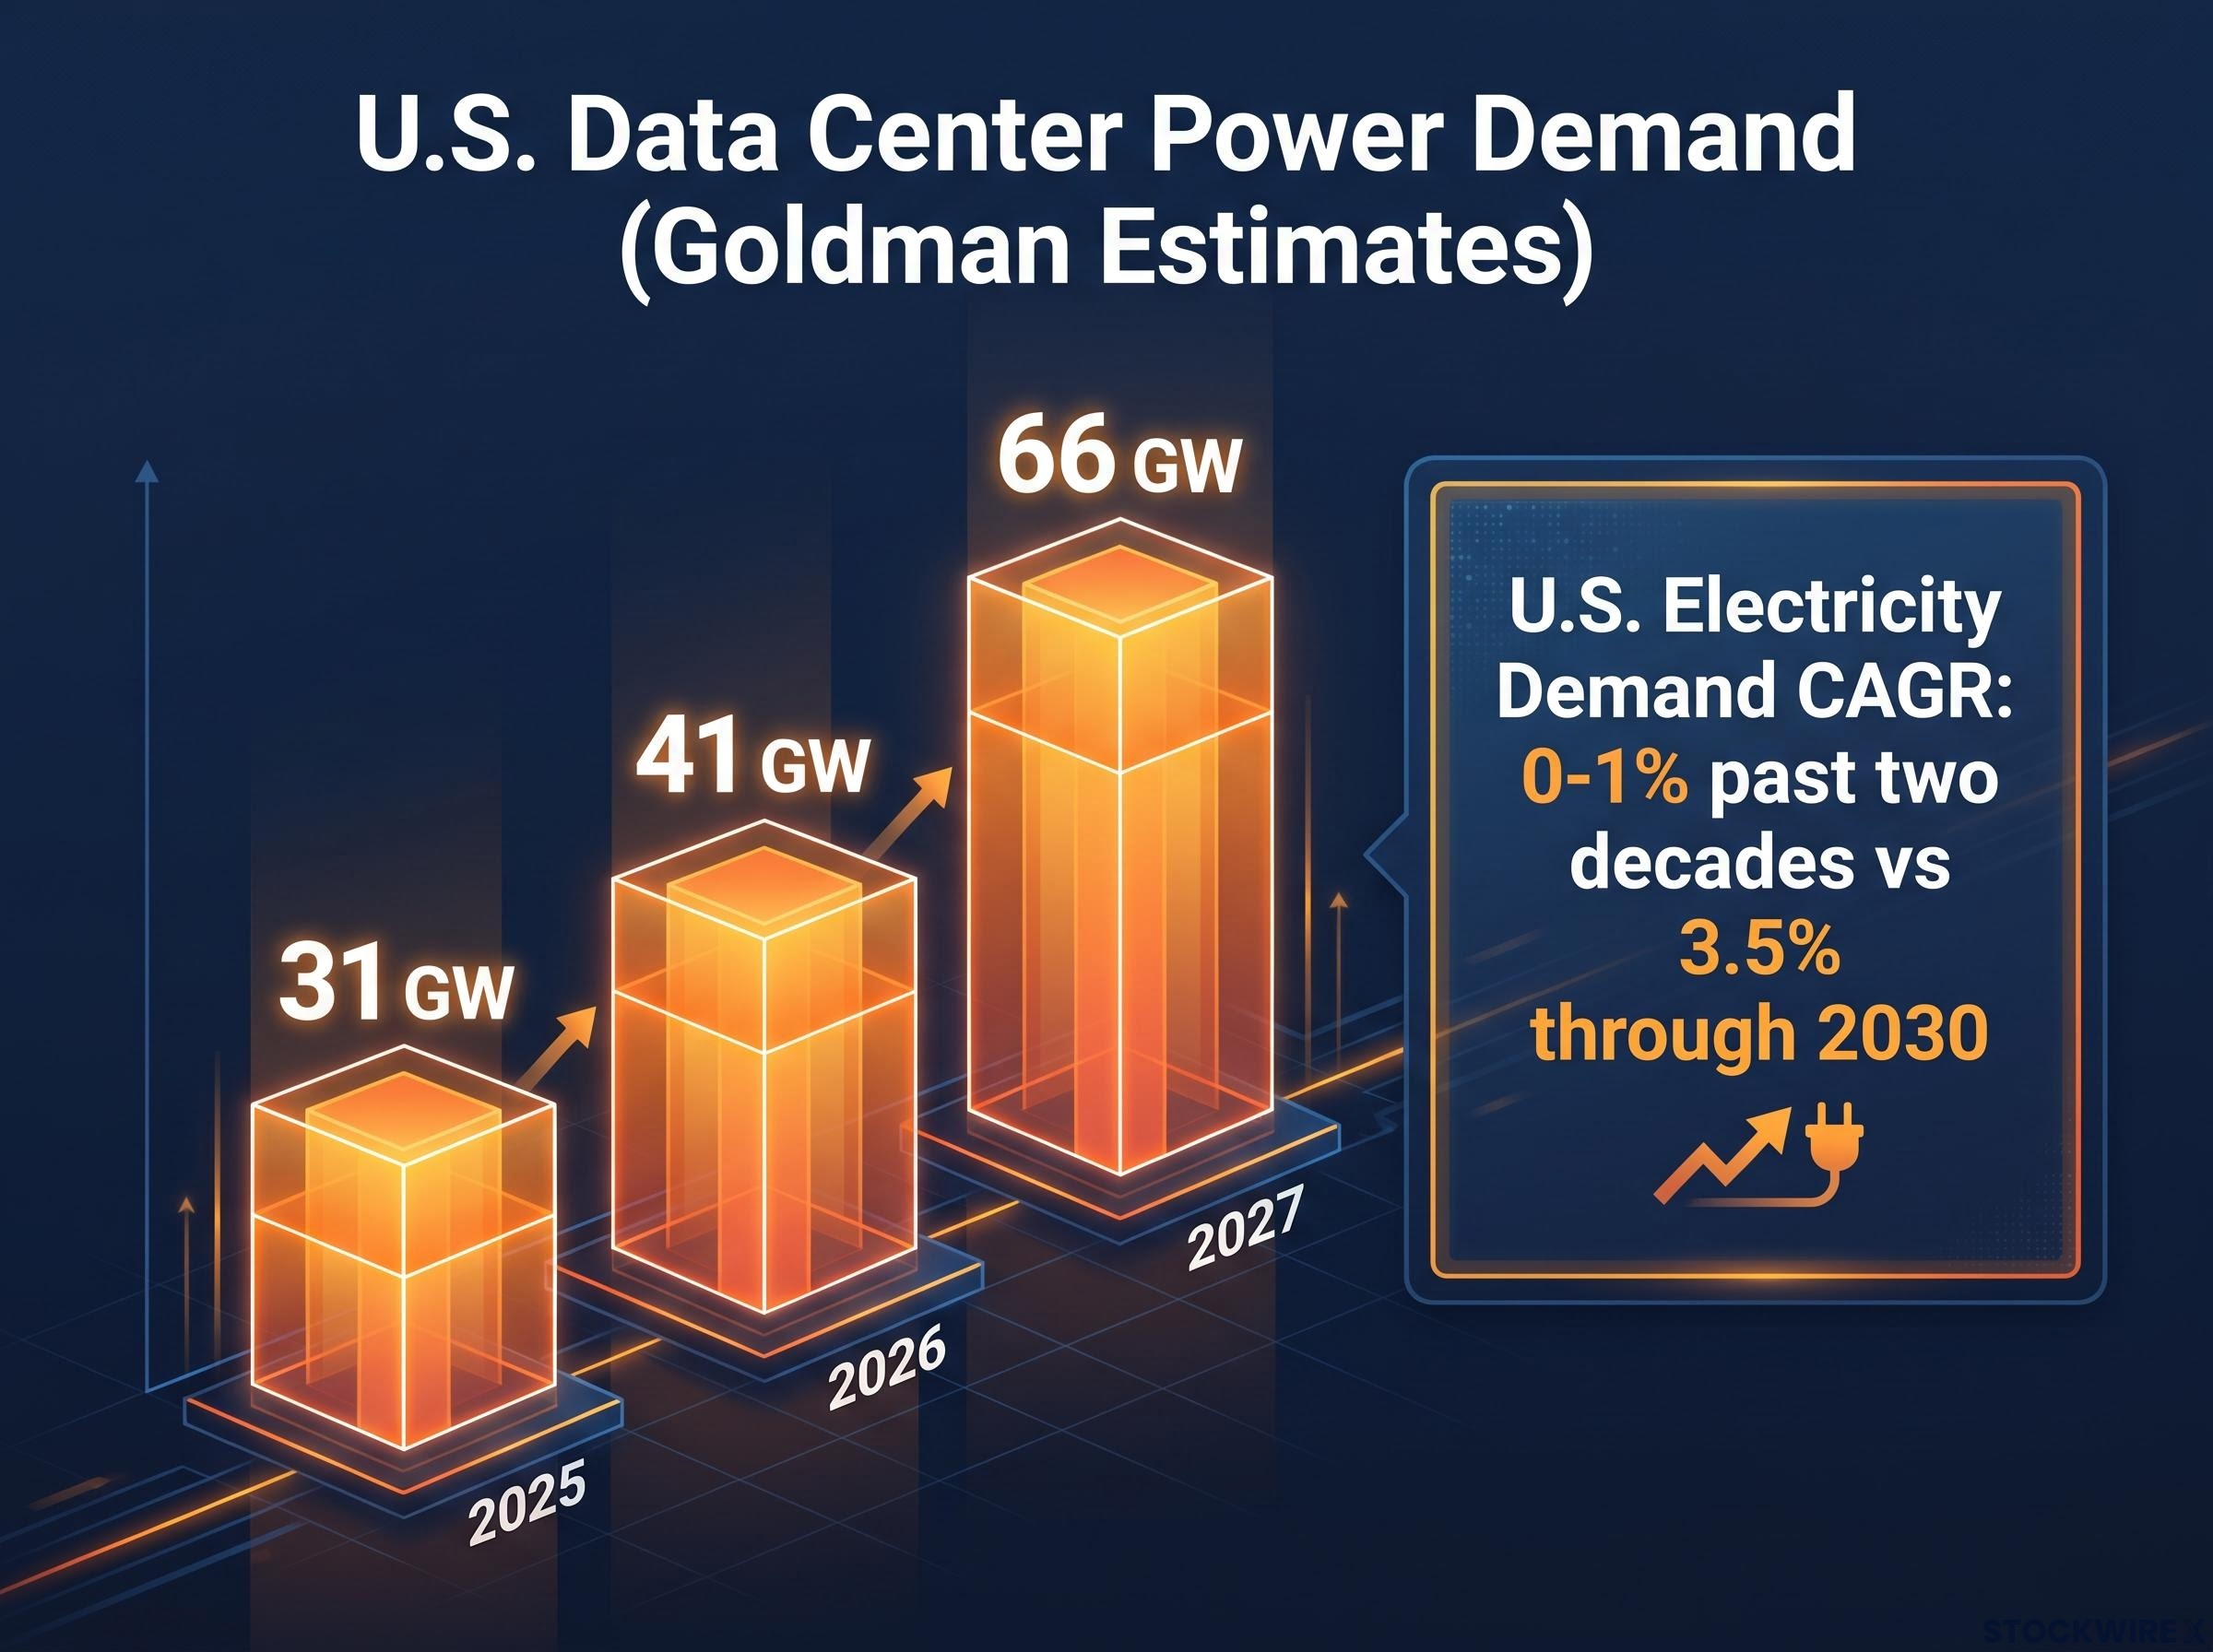
The scale of the demand shift is best understood in absolute gigawatt terms. Goldman estimates U.S. data-centre power demand rising from 31 GW in 2025 to 41 GW in 2026 and 66 GW in 2027.
| Year | Power Demand (GW) | Notable Context |
|---|---|---|
| 2025 | 31 GW | Baseline year for Goldman projections |
| 2026 | 41 GW | +32% year-on-year increase |
| 2027 | 66 GW | More than double the 2025 figure |
Those numbers need context. U.S. electricity demand grew at approximately 0-1% per year for the past two decades. Grid planners, regulators, and utility capital programmes were built around that assumption.
According to Goldman, U.S. electricity demand is on course to expand at a 3.5% compound annual rate through 2030, with data centres accounting for the bulk of that acceleration. Against two decades of flat growth, that is not a gradual shift. It is a regime change.
The IEA’s projection that combined data centre and AI electricity consumption will exceed 1,000 TWh by 2026 reframes this as a grid crisis rather than a technology-sector capital allocation question, with regulated utilities, nuclear operators, and grid equipment manufacturers emerging as the structural corporate beneficiaries alongside neocloud operators.
Data centres are projected to rise from approximately 3-4% of U.S. electricity consumption toward 8%-plus by 2030, with Goldman noting approximately 8.5% of peak summer demand by 2027. These are 24/7 baseload consumers with firm power requirements, signing long-duration PPAs (power purchase agreements, which are contracts locking in electricity supply for a fixed period) with investment-grade counterparties.
A 3.5% annual demand CAGR (compound annual growth rate) in a sector that has been flat for twenty years is a structural repricing event for grid assets. If you hold regulated utilities or IPPs with exposure to data-centre cluster geographies, you are positioned to capture a growth rate this sector has not seen in a generation.
Why national capacity projections mislead energy investors about the real supply picture
The most accessible bearish counterargument goes like this: Goldman’s numbers put U.S. data-centre capacity at roughly 122-125 GW by 2030, set against annual demand running at around 108 GW. That looks like oversupply.
It isn’t, and the reason matters.
The construction-cycle argument for utilities and IPPs
National aggregate figures obscure what is actually happening at the regional level. Specific high-demand markets remain supply-constrained due to powered-land scarcity and local grid bottlenecks. CBRE’s data confirms vacancy rates in primary markets at approximately 1% or below, even as national capacity forecasts are revised upward. The surplus exists on spreadsheets. It does not exist in Northern Virginia.
Goldman specifically highlights five data-centre cluster geographies as particularly well positioned:
- Northern Virginia
- Texas
- Georgia
- Arizona
- Parts of the Pacific Northwest
From a utility and IPP perspective, the investor-relevant question is not whether aggregate capacity exceeds aggregate demand in 2030. The question is which balance sheets are currently financing grid expansion to serve data-centre clusters in constrained markets. Building more than 100 GW of data-centre capacity forces large, long-term power investments. Utility and IPP capex programmes tied to data-centre interconnection are already committed. The investment case is not contingent on a specific 2030 demand outcome; it is driven by the construction cycle already underway.
If you dismiss the power thesis because of the 2030 aggregate surplus, you are asking the wrong question at the wrong level of analysis.
The risks Goldman’s thesis does not eliminate
No thesis eliminates risk, and this one carries specific mechanisms that could impair returns. Five warrant monitoring, ordered from most structural to most execution-specific:
- Technology efficiency gains: More efficient GPUs, advanced cooling systems, or architectural changes could dampen power intensity per workload unit. This is not hypothetical; each generation of GPU hardware delivers more compute per watt. If efficiency improves faster than workload growth, the demand trajectory Goldman projects could moderate materially.
- Regulatory and permitting delays: New generation and transmission capacity requires permits, environmental review, and interconnection approvals. Delays are common and can extend timelines by years, directly impairing the utility and IPP capex thesis.
- Regional overbuild in secondary markets: While Tier-1 hubs remain constrained, secondary markets without the same demand concentration may face genuine oversupply conditions, compressing returns for operators and developers exposed to those geographies.
- Demand concentration risk: Neocloud revenue is often concentrated in a small number of large hyperscalers or AI platforms. That concentration creates credit and renewal risk at contract expiry.
- Balance-sheet and financing risk: Neoclouds scaling rapidly carry substantial capital intensity. Operators financing large buildouts against long-duration contracts face execution risk if tenant demand shifts or financing conditions tighten.
Multi-year grid interconnection backlogs and emerging software monetisation gaps, the two friction points analysts are tracking most closely heading into 2026 earnings cycles, create the specific execution risk that makes operator selection within the neocloud segment more consequential than sector exposure alone.
The risk that warrants the closest attention is not any single item on this list but the interaction between efficiency gains and long-duration contract terms. If GPU efficiency improves faster than projected, neoclouds locked into large power PPAs could find their compute economics shifting against them at contract renewal.
That tail risk is the one Goldman’s bullish framing does not fully resolve.
This article is for informational purposes only and should not be considered financial advice. Investors should conduct their own research and consult with financial professionals before making investment decisions. Financial projections referenced in this piece are subject to market conditions and various risk factors. Past performance does not guarantee future results.
Building a position around the Goldman framework: what the data actually supports
The neocloud investment case rests on lease-rate durability (not further appreciation), contract length, and land-and-power position in constrained markets. Operators who locked in interconnection rights at lower cost bases and signed 15-20-year leases at rates above $150/kW/month have visible, contracted cash flows. The risk is counterparty concentration and balance-sheet strain if the buildout cycle hits financing headwinds.
The utility and IPP investment case rests on geography (exposure to the five data-centre cluster markets Goldman identifies), PPA pipeline visibility, and regulatory environment for grid expansion capex. The 3.5% U.S. electricity demand CAGR and the GW demand trajectory support this case through at least 2030. The risk is permitting delays and the possibility that efficiency gains moderate the demand curve.
| Sector | Core Thesis Driver | Primary Risk | Key Screening Question |
|---|---|---|---|
| Neocloud Operators | Lease-rate durability on 15-20-year contracts in constrained markets | Counterparty concentration and financing risk | Does the operator hold interconnection rights in Tier-1 markets at a favourable cost basis? |
| Utilities / IPPs | Geographic exposure to data-centre clusters with PPA pipeline visibility | Permitting delays and efficiency-driven demand moderation | Is the utility financing grid expansion in one of Goldman’s five cluster geographies? |
The two sectors do not require an either-or decision, but they carry different risk profiles. What they share is the structural anchor: 10-20-year contracts backing cash flows in a sector where supply cannot scale quickly.
The actionable question for your own research is specific: do the neocloud operators or utility names in your universe actually hold the land-and-power position or the geographic cluster exposure that the thesis requires? Without those specifics, the macro tailwind does not translate into a security-level return.
For investors wanting to translate Goldman’s two-sector framework into a portfolio weighting decision, our dedicated guide to AI infrastructure stock allocation covers the three-layer hardware, cloud, and software structure recommended by U.S. financial advisors, including specific screening metrics for each layer.
—