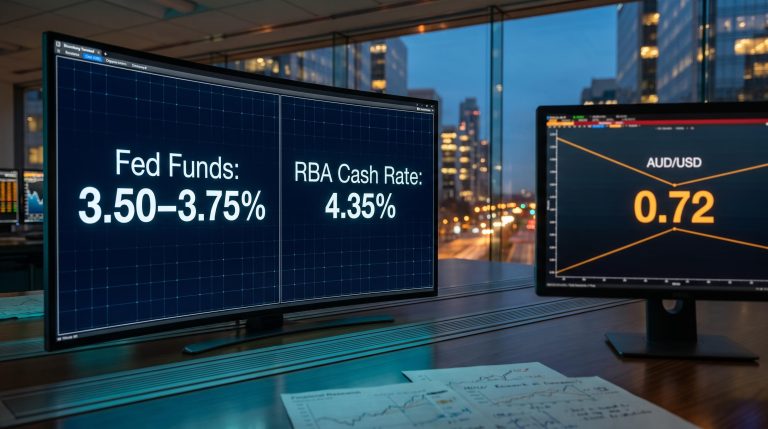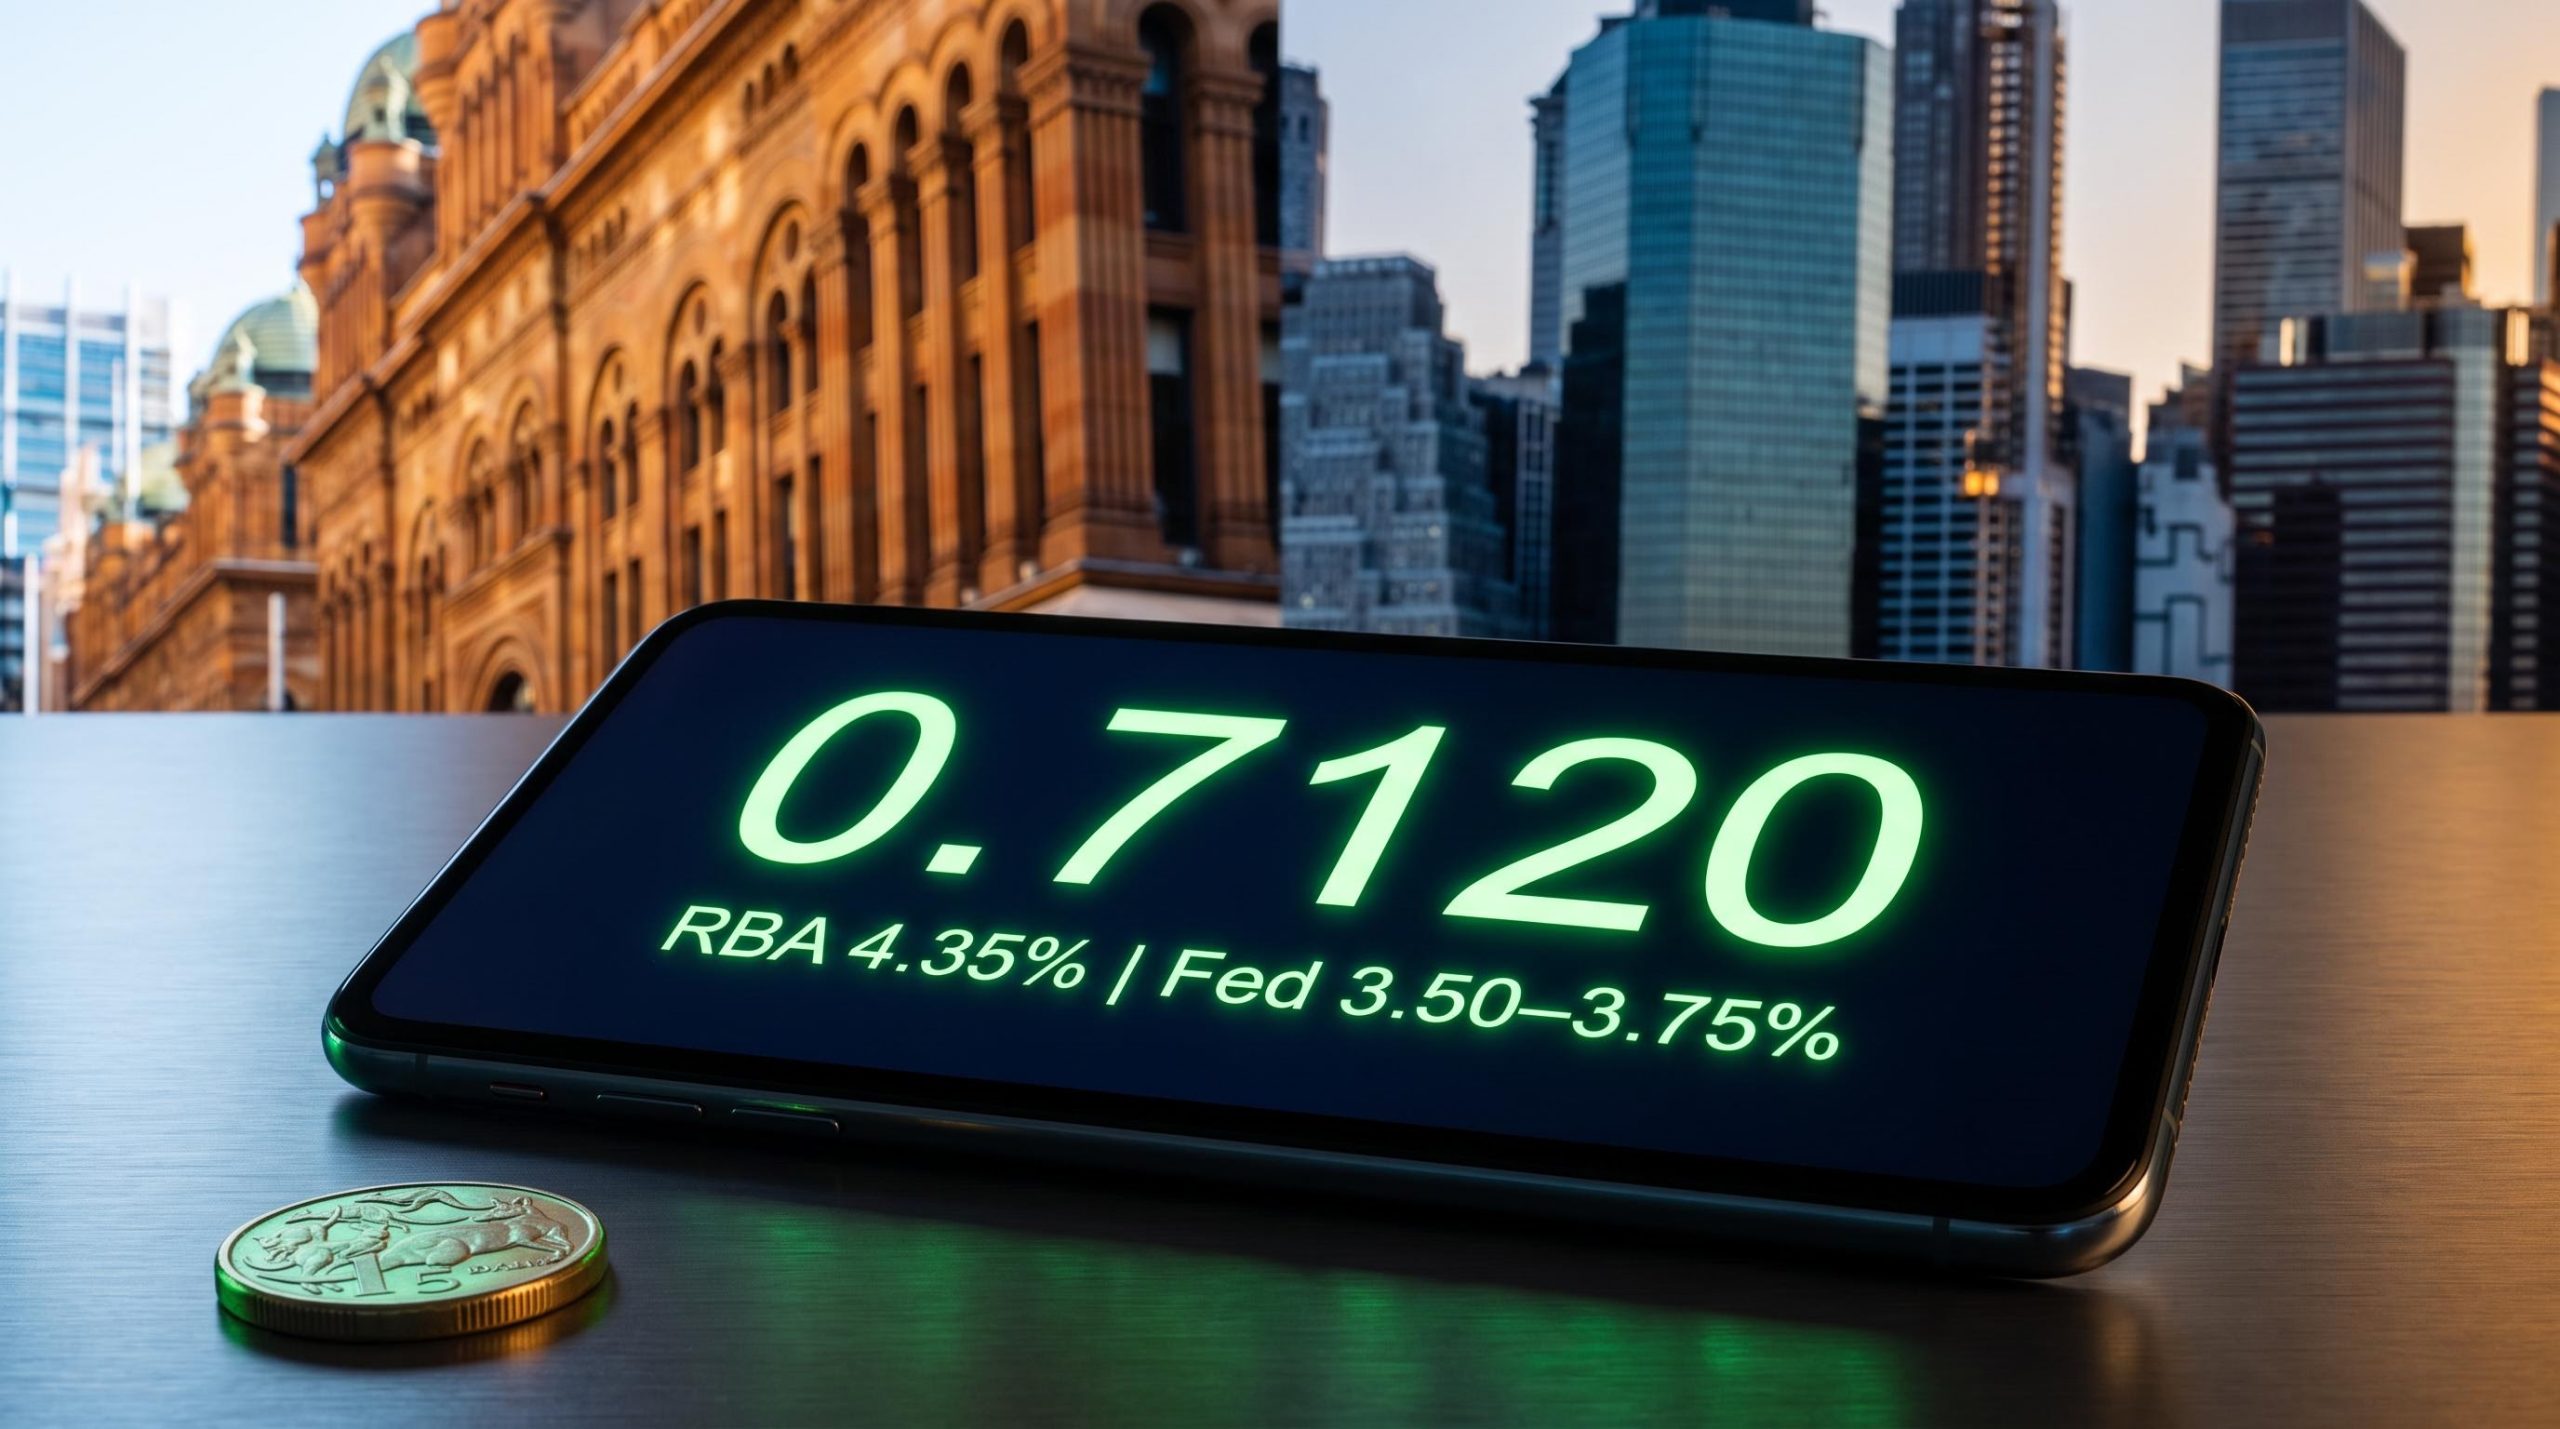
The Reserve Bank of Australia’s cash rate sits at 4.35%. The US Federal Reserve’s target range sits at 3.50-3.75%. That gap of 60-85 basis points on the short end is the single most important fact shaping where the Australian dollar goes next.
The timing is what makes this divergence matter more than usual. Both central banks have live meetings inside a 13-day window: the Fed decides today, 16 September 2026, and the RBA follows on 29 September 2026, with futures markets pricing meaningful hike probabilities at both. AUD/USD near 0.7120 is not simply drifting; it is navigating two policy decisions in sequence, each pulling on the yield spread that anchors the medium-term case for the pair.
What follows is a framework for reading which force matters more right now: the short-term dollar pressure building into the Fed meeting, or the structural yield advantage the RBA’s rate path provides. This is a practical lens for interpreting the moves ahead, not a prediction of where the pair lands.
Where AUD/USD stands right now, and what the chart is telling you
AUD/USD is trading near 0.7120 during the Asian session on 16 September 2026, down from recent highs around 0.7218 and testing horizontal support. The pair has spent the past several sessions consolidating rather than breaking down, which is a distinction that matters a great deal for anyone trying to time an entry or exit.
Momentum sits in neutral territory. According to FXEmpire’s technical read of 13 September 2026, the daily RSI(14) was 53.9, drifting toward roughly 47 during the Asian session on 16 September. Neither reading signals a market in trouble; both point to a pair losing upward thrust without turning decisively lower.
The moving average stack tells the more interesting story, because it is split. The long-dated signals remain constructive: the EMA(100) near 0.7077 and the SMA(200) near 0.7065 are both generating buy signals. The short-dated signals have flipped the other way, with the 10- and 20-day averages clustered around 0.7180 now flashing sell.
That split is the technical expression of near-term consolidation inside a longer-dated uptrend. The trend that carried the pair up through 2026 is intact on the longer timeframes; the near-term picture has cooled. For an Australian investor with USD-denominated exposure, that distinction is the difference between a pullback worth waiting out and a trend change worth acting on.
The breakout conditions for AUD/USD are more demanding than price proximity to resistance alone suggests; DBS Group Research’s three-condition convergence test, requiring a weekly close above 0.7275-0.7309, synchronised Asian FX strength across CNY, KRW, and JPY, and structural USD weakness rather than a single data-point surprise, sets a high bar that the current consolidation near 0.7120 has not yet approached.
Support and resistance levels to watch this week
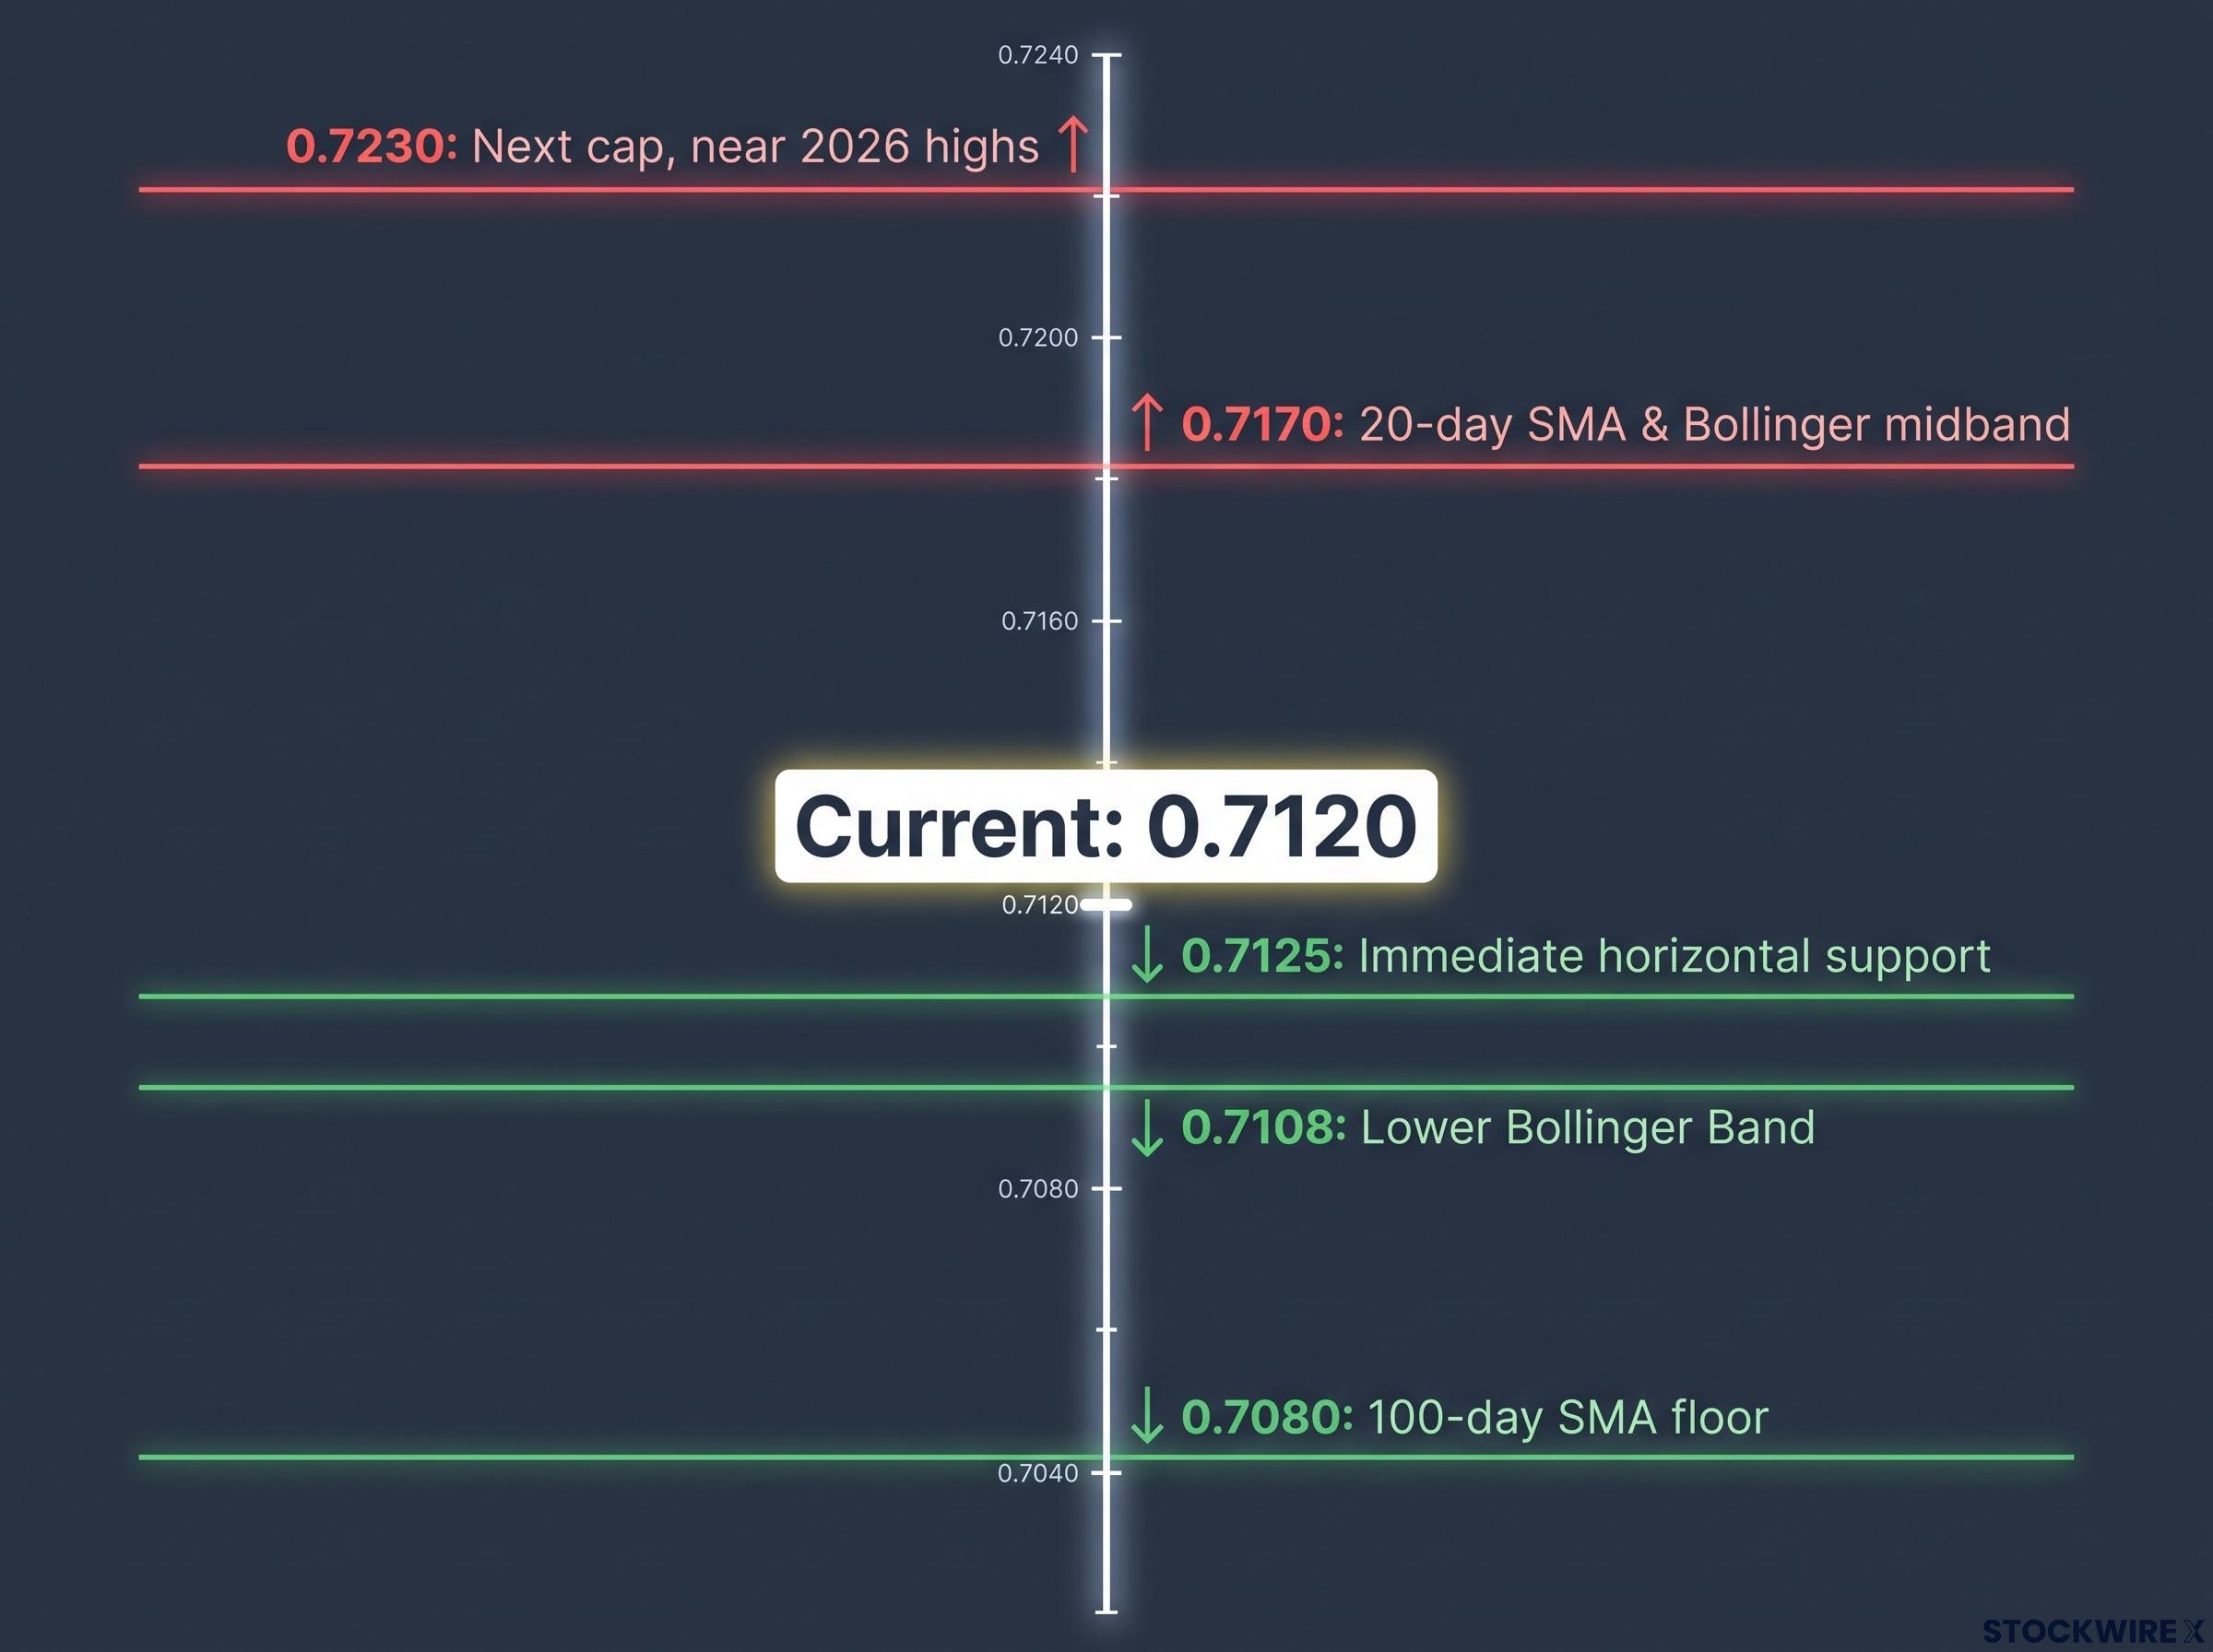
The downside structure breaks into three tiers, in order of importance:
- 0.7125: immediate horizontal support, the first line the pair is testing right now
- 0.7108: the lower Bollinger Band, the next defensive level if 0.7125 gives way
- 0.7080: the 100-day SMA floor, the level whose breach would matter structurally
On the topside, two levels frame any recovery:
- 0.7170: the 20-day SMA and Bollinger midband
- 0.7230: the next cap, near the extension of 2026 highs
A break beneath 0.7080 is what would shift the assessment from consolidation to genuine trend threat. Until then, the neutral momentum and intact long-dated signals argue this is pressure, not breakdown, with the next 48 hours around the Fed decision carrying the real directional risk.
Official benchmark: The RBA’s official daily fixing was 0.7149 as at 4:00 pm on 14 September 2026, the most recent close-of-day reference against which the live intraday reading of 0.7120 can be measured.
When big ASX news breaks, our subscribers know first
The Fed side of the equation: what 91% pricing actually means for the dollar
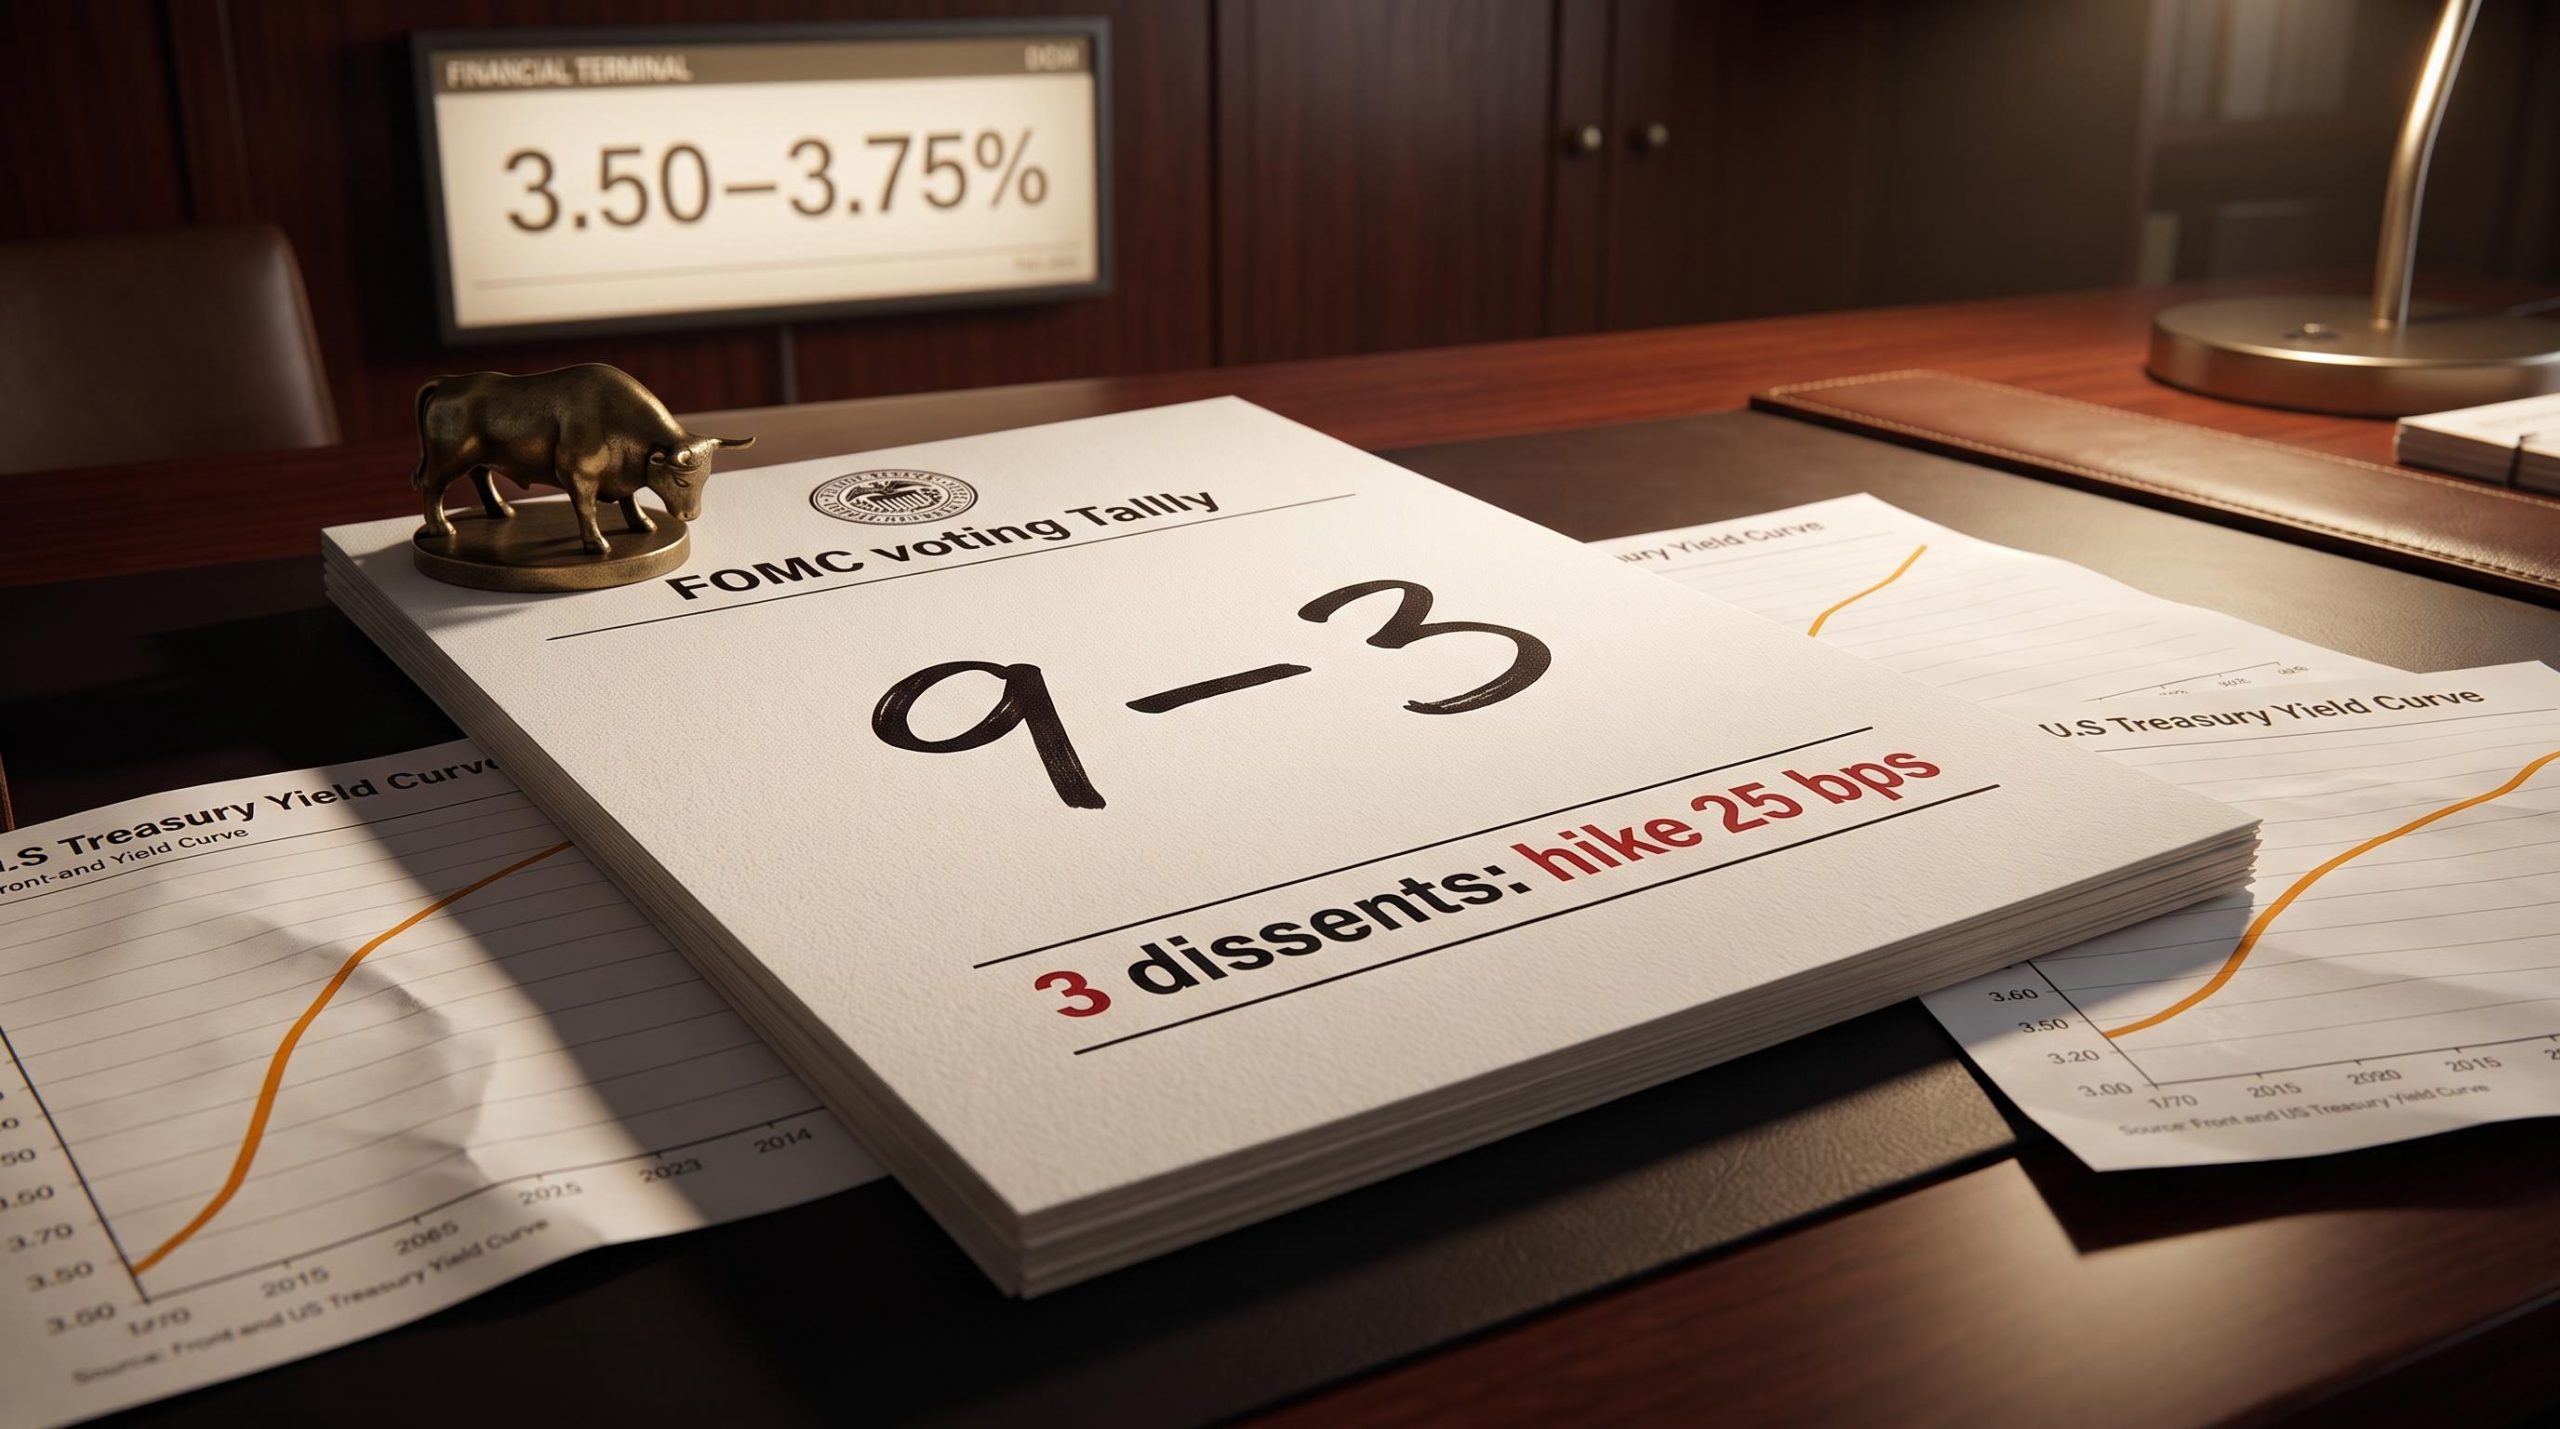
The Fed is almost certain to hike today, and that near-certainty is precisely why the hike itself is close to a non-event for the dollar. Futures markets have already done the pricing. CentralBank.Watch put the probability of a 25 basis point hike at 91.4% as of 15 September 2026, while the CME FedWatch tool put it closer to 92.4%.
When more than nine-tenths of an outcome is already embedded in the exchange rate, delivery of that outcome adds only marginal fresh dollar strength. The hike is, in effect, already sitting inside the AUD/USD rate near 0.7120.
Where it gets interesting is the gap between what traders expect and what economists expect. A Reuters poll of economists on 9 September 2026 found roughly 70% expecting the Fed to hold at 3.50-3.75%. That is not a footnote. It is evidence that the consensus futures trade has a real chance of being wrong, and a Fed that holds or sounds cautious would force a sharp repricing of the dollar.
The tension between futures markets versus economist consensus is not a quirk of this particular meeting; the June 2026 dot plot median of 3.8% already masked a near-even split among FOMC participants on hikes versus holds, meaning the probability tools traders rely on have been encoding committee uncertainty rather than committee conviction for several months.
| Futures markets (CME FedWatch) | Economist consensus (Reuters poll) | What this means |
|---|---|---|
| 91-92% probability of a 25 bp hike | ~70% expect a hold | The two signals point in opposite directions, so the risk is not in the decision itself but in which camp turns out to be right |
The real variable, then, is the press conference, not the rate line. A dovish framing from Chair Powell, one that downplays further tightening, would pull US yields lower and soften the dollar, offering AUD/USD near-term relief. Hawkish signalling pointing to continued hikes would reinforce the dollar and extend the pressure already on the pair.
“Roughly 90% of a 25 basis point hike is already priced in,” noted Carol Kong, currency strategist at Commonwealth Bank of Australia (Sydney), who identified a dovish press conference as the larger near-term risk to the dollar.
For an Australian reader with USD exposure, that reframing changes the whole approach to tonight. The binary is not hike versus hold. It is hawkish signal versus dovish signal, and it determines which headlines to watch and how to read the AUD/USD reaction once the statement lands.
The yield differential explained: why the RBA’s rate gap matters, and when it does not
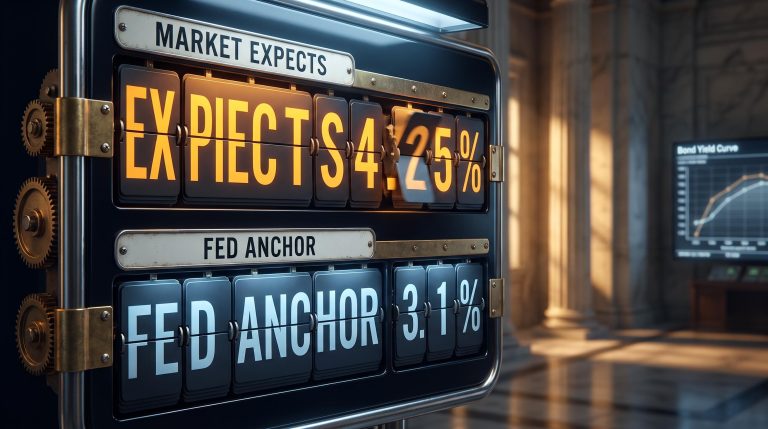
The mechanism behind the bullish case for the Australian dollar is straightforward, and it starts with the rate gap. With the RBA at 4.35% and the Fed at 3.50-3.75%, Australian short-term yields offer a spread of roughly 60-85 basis points over their US equivalents.
That spread transmits to the currency through two channels:
- Short-end yield differentials and capital flows: higher Australian yields draw capital toward the AUD through basic interest-rate parity, the principle that money tends to flow to where it earns more, all else being equal.
- Carry-trade attractiveness: higher yields increase the return on holding long AUD positions, and when global volatility stays contained, carry trades (borrowing in a low-yielding currency to hold a higher-yielding one) tend to support the Australian dollar.
The RBA meeting on 29 September 2026 could widen that advantage. Markets are pricing a 76-78% probability of a further 25 basis point hike, according to CentralBank.Watch and the RBA Rate Tracker as of 15 September 2026, which would lift the cash rate to roughly 4.60%. The RBA’s own Statement on Monetary Policy, referenced by IndustrySpread in May 2026, assumed a path toward approximately 4.70% by year-end.
| Central bank | Current rate | Post-hike rate | Spread (AUD advantage) |
|---|---|---|---|
| RBA cash rate | 4.35% | ~4.60% | Current: ~60-85 bp |
| Fed target (upper) | 3.75% | ~3.85% | If both hike: ~75 bp maintained |
This is the lens Goldman Sachs used when it raised its AUD/USD forecasts in February 2026 to 0.72 at three months, 0.73 at six months, and 0.74 at twelve months, citing a hawkish RBA and relative policy divergence as primary supports. The yield gap is the structural tailwind institutional forecasters are willing to build a 12-month case on.
The problem is that the mechanism does not operate in a vacuum, and there are documented cases where it broke. The two most relevant failure modes are:
- Geopolitical safe-haven flows: Tradingpedia documented an episode in April 2026 when geopolitical tensions drove dollar safe-haven demand and softened the AUD, despite a hawkish RBA and a roughly 65% priced-in May hike.
- US data surprises forcing rapid Fed repricing: a strong US data print can reprice Fed expectations quickly, temporarily overwhelming the AUD’s carry advantage even while the RBA is tightening.
The April episode is the one to remember. It shows that the yield spread gives the AUD a real structural floor, but when global risk sentiment deteriorates, that floor can be overwhelmed inside a single trading session. Knowing when the differential works, and when it does not, is what separates informed positioning from mechanical rule-following.
The April 2026 episode was not isolated; a similar dynamic played out on 20 August 2026, when dollar strength overriding domestic fundamentals pushed AUD/USD down 0.14% to 0.7114 despite Australian manufacturing and services PMIs both printing in expansion territory, confirming that US Treasury yield direction can dominate currency direction even when the domestic data narrative is constructive.
Three scenarios for AUD/USD and the variables that determine which one plays out
The cleanest way to hold all of this is as a decision tree rather than a forecast. IndustrySpread’s May 2026 analysis laid out three end-2026 outcomes, and each one attaches to specific variables that are live and testable over the coming four to six weeks.
| Scenario | AUD/USD target (end-2026) | Key conditions required | Primary risk |
|---|---|---|---|
| Bull | 0.76 | Strong China demand, stable risk appetite, RBA near cycle peak, Fed eases slightly | Requires favourable outcomes across multiple variables at once |
| Base | 0.73 | Fed hikes without signalling acceleration, RBA follows through on 29 September, China demand holds | Any single condition slipping |
| Bear | 0.68 | China slowdown, commodity weakness, risk-off USD safe-haven episodes | At least two triggers already documented in 2026 |
The base case at 0.73 is where the institutional weight sits. It requires the Fed to deliver today’s hike without signalling a faster path, the RBA to follow through on 29 September, and China demand to hold broadly stable. The specific things to watch:
- Powell’s press conference tone: neutral rather than hawkish
- RBA delivery of the expected September hike
- Chinese industrial demand staying stable through the period
The proximity between Goldman Sachs (targets of 0.72-0.74 across 3 to 12 months) and IndustrySpread’s 0.73 base case tells you the 0.72-0.73 range carries genuine institutional alignment, not a lone-analyst call.
The bear case at 0.68 is not a tail risk, and that is the point worth sitting with. Its triggers are:
- China industrial demand rolls over and commodity prices weaken
- Geopolitical risk drives sustained dollar safe-haven flows
- The Fed signals a more aggressive path than currently priced, compressing the RBA-Fed spread
Each of those has documented precedent from earlier in 2026, which is why the bear case should be treated as a scenario with active near-term triggers rather than a remote possibility.
The bull case at 0.76 needs the opposite: strong Chinese demand, stable global risk appetite, an RBA near its cycle peak, and a Fed that eases slightly. It requires several favourable outcomes to line up simultaneously, which makes it the least probable of the three on current conditions.
IndustrySpread singled out China’s industrial demand as the pivotal swing factor, warning that a rollover in Chinese activity could stop the RBA-Fed gap from translating into sustained AUD strength.
China’s domestic demand outlook carries more weight for the AUD bear case than commodity headlines alone suggest; August data showed exports accelerating at 25.0% year-on-year while retail sales crawled at just 0.4%, a two-speed economy that raises genuine questions about whether the industrial demand underpinning Australian commodity exports is as durable as the headline trade figures imply.
The value here is a checklist, not a destination. Rather than treating 0.73 as a price target to reach, watch the specific conditions above to judge which scenario is gaining probability week by week.
What the next two weeks will actually tell you about where AUD/USD is headed
The next fortnight is a two-act event. The Fed decision today resolves the near-term dollar pressure question. The RBA meeting on 29 September 2026 then either reinforces or undermines the yield-spread case that underpins the medium-term outlook.
Here is the sequence of signals to watch, in order:
- Powell’s press conference tone on 16 September: dovish framing softens the dollar and relieves AUD/USD; hawkish signalling extends the pressure
- The AUD/USD reaction at 0.7108 if the dollar strengthens: whether the lower Bollinger Band holds tells you if the consolidation is contained
- The RBA’s statement language on 29 September: watch for any shift away from the current tightening bias
- AUD/USD position relative to 0.7080 after the RBA meeting: the 100-day SMA floor is the structural line
The read to take is this. If AUD/USD holds above 0.7108 through the Fed decision and Powell’s tone is neutral to dovish, that is confirmation the structural bullish case remains on track, not a reason to chase momentum. A clean break below 0.7080 is the level that would force a reassessment.
The longer-term institutional consensus is intact for now. Goldman Sachs and IndustrySpread both point toward recovery in the 0.72-0.73 range as long as the RBA-Fed yield gap holds. Near-term price action, though, will be decided by whether these two central bank communications confirm or disrupt the conditions holding that case together.
This article is for informational purposes only and should not be considered financial advice. Investors should conduct their own research and consult with financial professionals before making investment decisions. Past performance does not guarantee future results, and financial projections are subject to market conditions and various risk factors. Forward-looking scenarios are speculative and subject to change based on market developments.