Most beginner investors land on the same three tickers eventually: VAS, VGS, and DHHF. They are cheap, they are passive, and between them they cover almost every listed company on earth. The harder question is not whether to own them, but which one, or which combination, actually fits your situation.
These are not interchangeable products. VAS gives you Australia. VGS gives you the rest of the developed world. DHHF gives you both, plus emerging markets, inside a single fund that rebalances itself. Each design choice carries real consequences for your tax position, your currency exposure, and how much ongoing attention your portfolio demands. Understanding those differences is the work this guide does for you.
After reading, you will have a clear framework for deciding which fund, or which pairing, reflects the kind of investor you actually are. You will understand the specific trade-offs you are making with each option before you place a single order.
This article is educational in nature and does not constitute financial advice. Readers should consult a licensed financial adviser before making any investment decision.
What you are actually buying with each fund
Before comparing fees or chasing return charts, you need to know what sits inside each of these three funds, because the contents determine everything that follows.
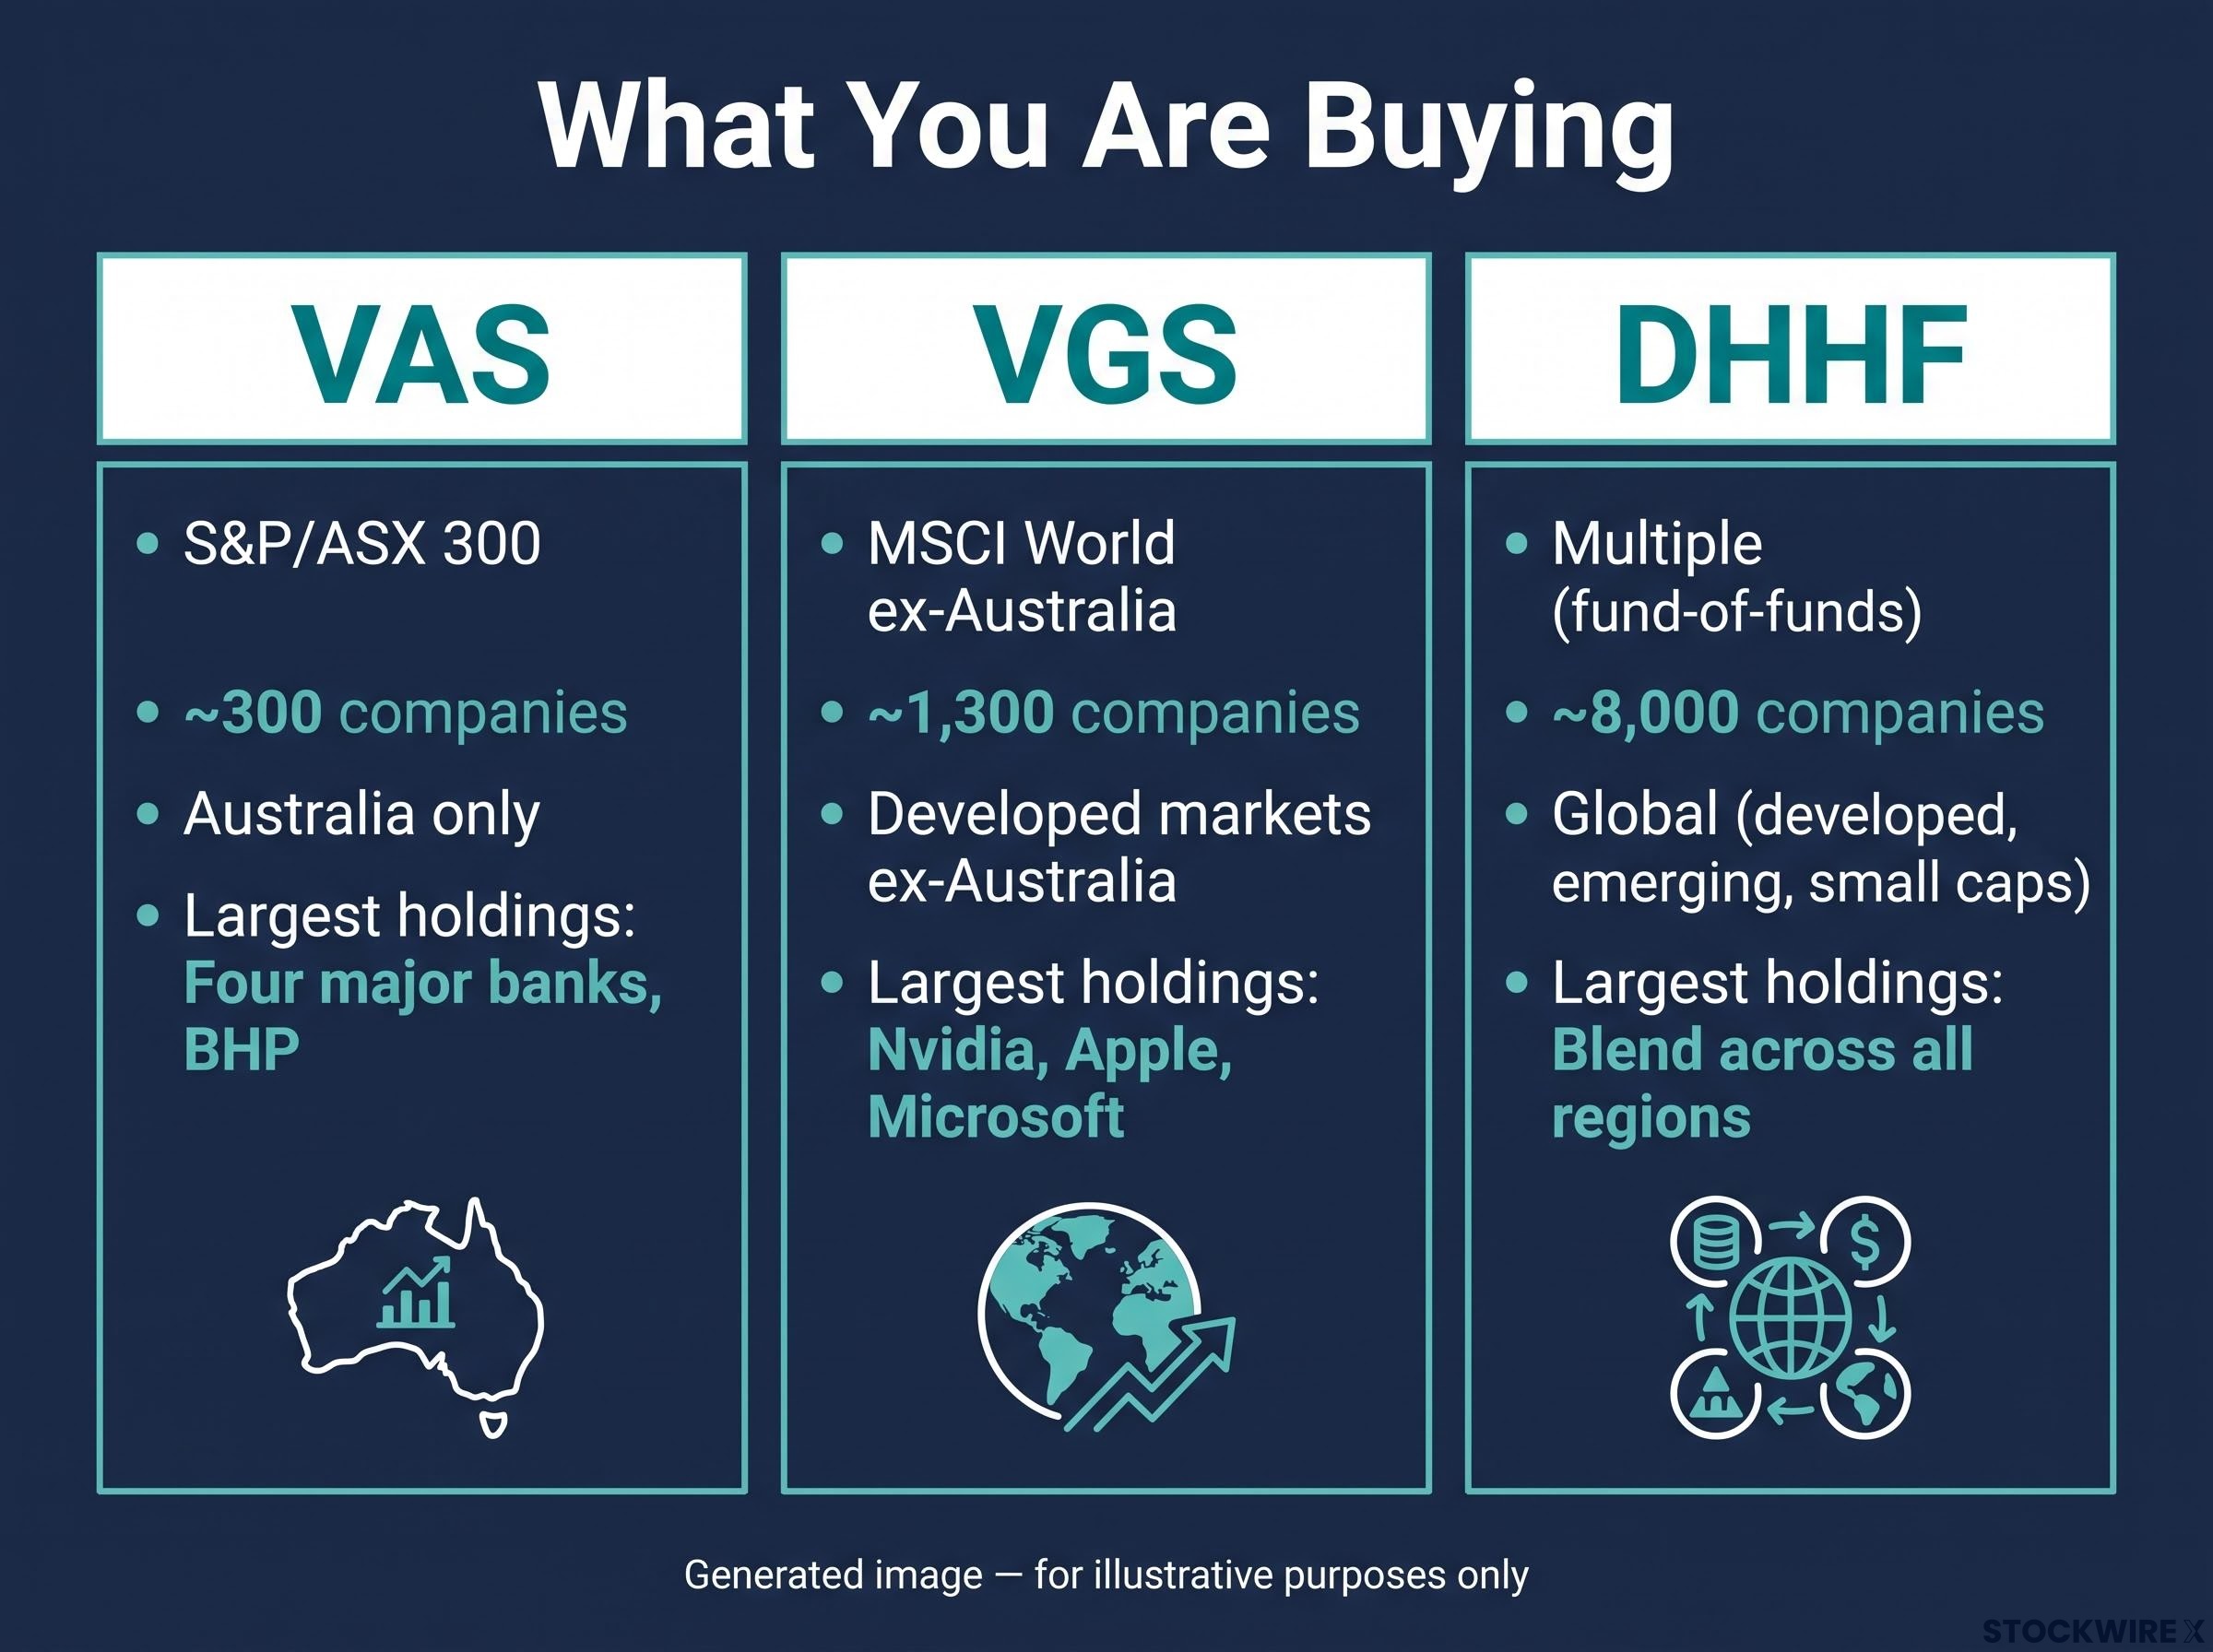
VAS tracks the S&P/ASX 300 Index, giving you ownership stakes in Australia’s 300 largest listed companies. When you look at where the weight sits, it falls squarely on the big four banks and BHP Group (ASX: BHP). That means your money is concentrated heavily in financials and resources, the two sectors that dominate the Australian share market.
VGS tracks the MSCI World ex-Australia Index, covering approximately 1,300 companies across major developed markets. Among its top positions by weight you will find Nvidia, Apple, and Microsoft sitting at the front of the queue. Australian securities are explicitly kept out of scope, by design, so that VGS sits beside VAS in a portfolio without overlapping it. That sector mix skews your capital toward technology and healthcare, two areas that command far smaller slices of the ASX than they do on global indices.
DHHF is a fund-of-funds structure holding a basket of BetaShares ETFs. It covers approximately 8,000 companies globally, spanning developed markets, emerging markets, and global small caps. Where VAS and VGS each cover a piece of the map, DHHF covers the whole thing and handles the domestic/international split internally.
The structural differences are not cosmetic. VAS concentrates you in two sectors. VGS tilts you toward global technology. DHHF blends both alongside emerging-market exposure. What sits inside each fund tells you where your money will work hardest, and where it will be most exposed.
VAS’s sector skew toward financials and resources is a form of concentration risk that investors often underestimate, because holding 300 companies sounds broad until you see that the top 10 names account for nearly half the index weight.
| Fund | Index tracked | Number of companies | Geographic coverage | Largest holdings |
|---|---|---|---|---|
| VAS | S&P/ASX 300 | ~300 | Australia only | Four major banks, BHP |
| VGS | MSCI World ex-Australia | ~1,300 | Developed markets ex-Australia | Nvidia, Apple, Microsoft |
| DHHF | Multiple (fund-of-funds) | ~8,000 | Global (developed, emerging, small caps) | Blend across all regions |
When big ASX news breaks, our subscribers know first
How index funds work, and why fees matter more than you think
All three of these funds are passive index funds. That means the fund buys and holds all, or a representative sample of, the securities in a target index. The goal is to track the index’s return rather than try to beat it. There is no active stock-picking. No fund manager betting on individual companies. The result is a very low cost to run.
Passive index funds track a target index by buying and holding all, or a representative sample of, its constituent securities, and if you want a full grounding in how ETFs work before comparing specific funds, the mechanics of creation units, market makers, and on-exchange pricing are worth understanding from the start.
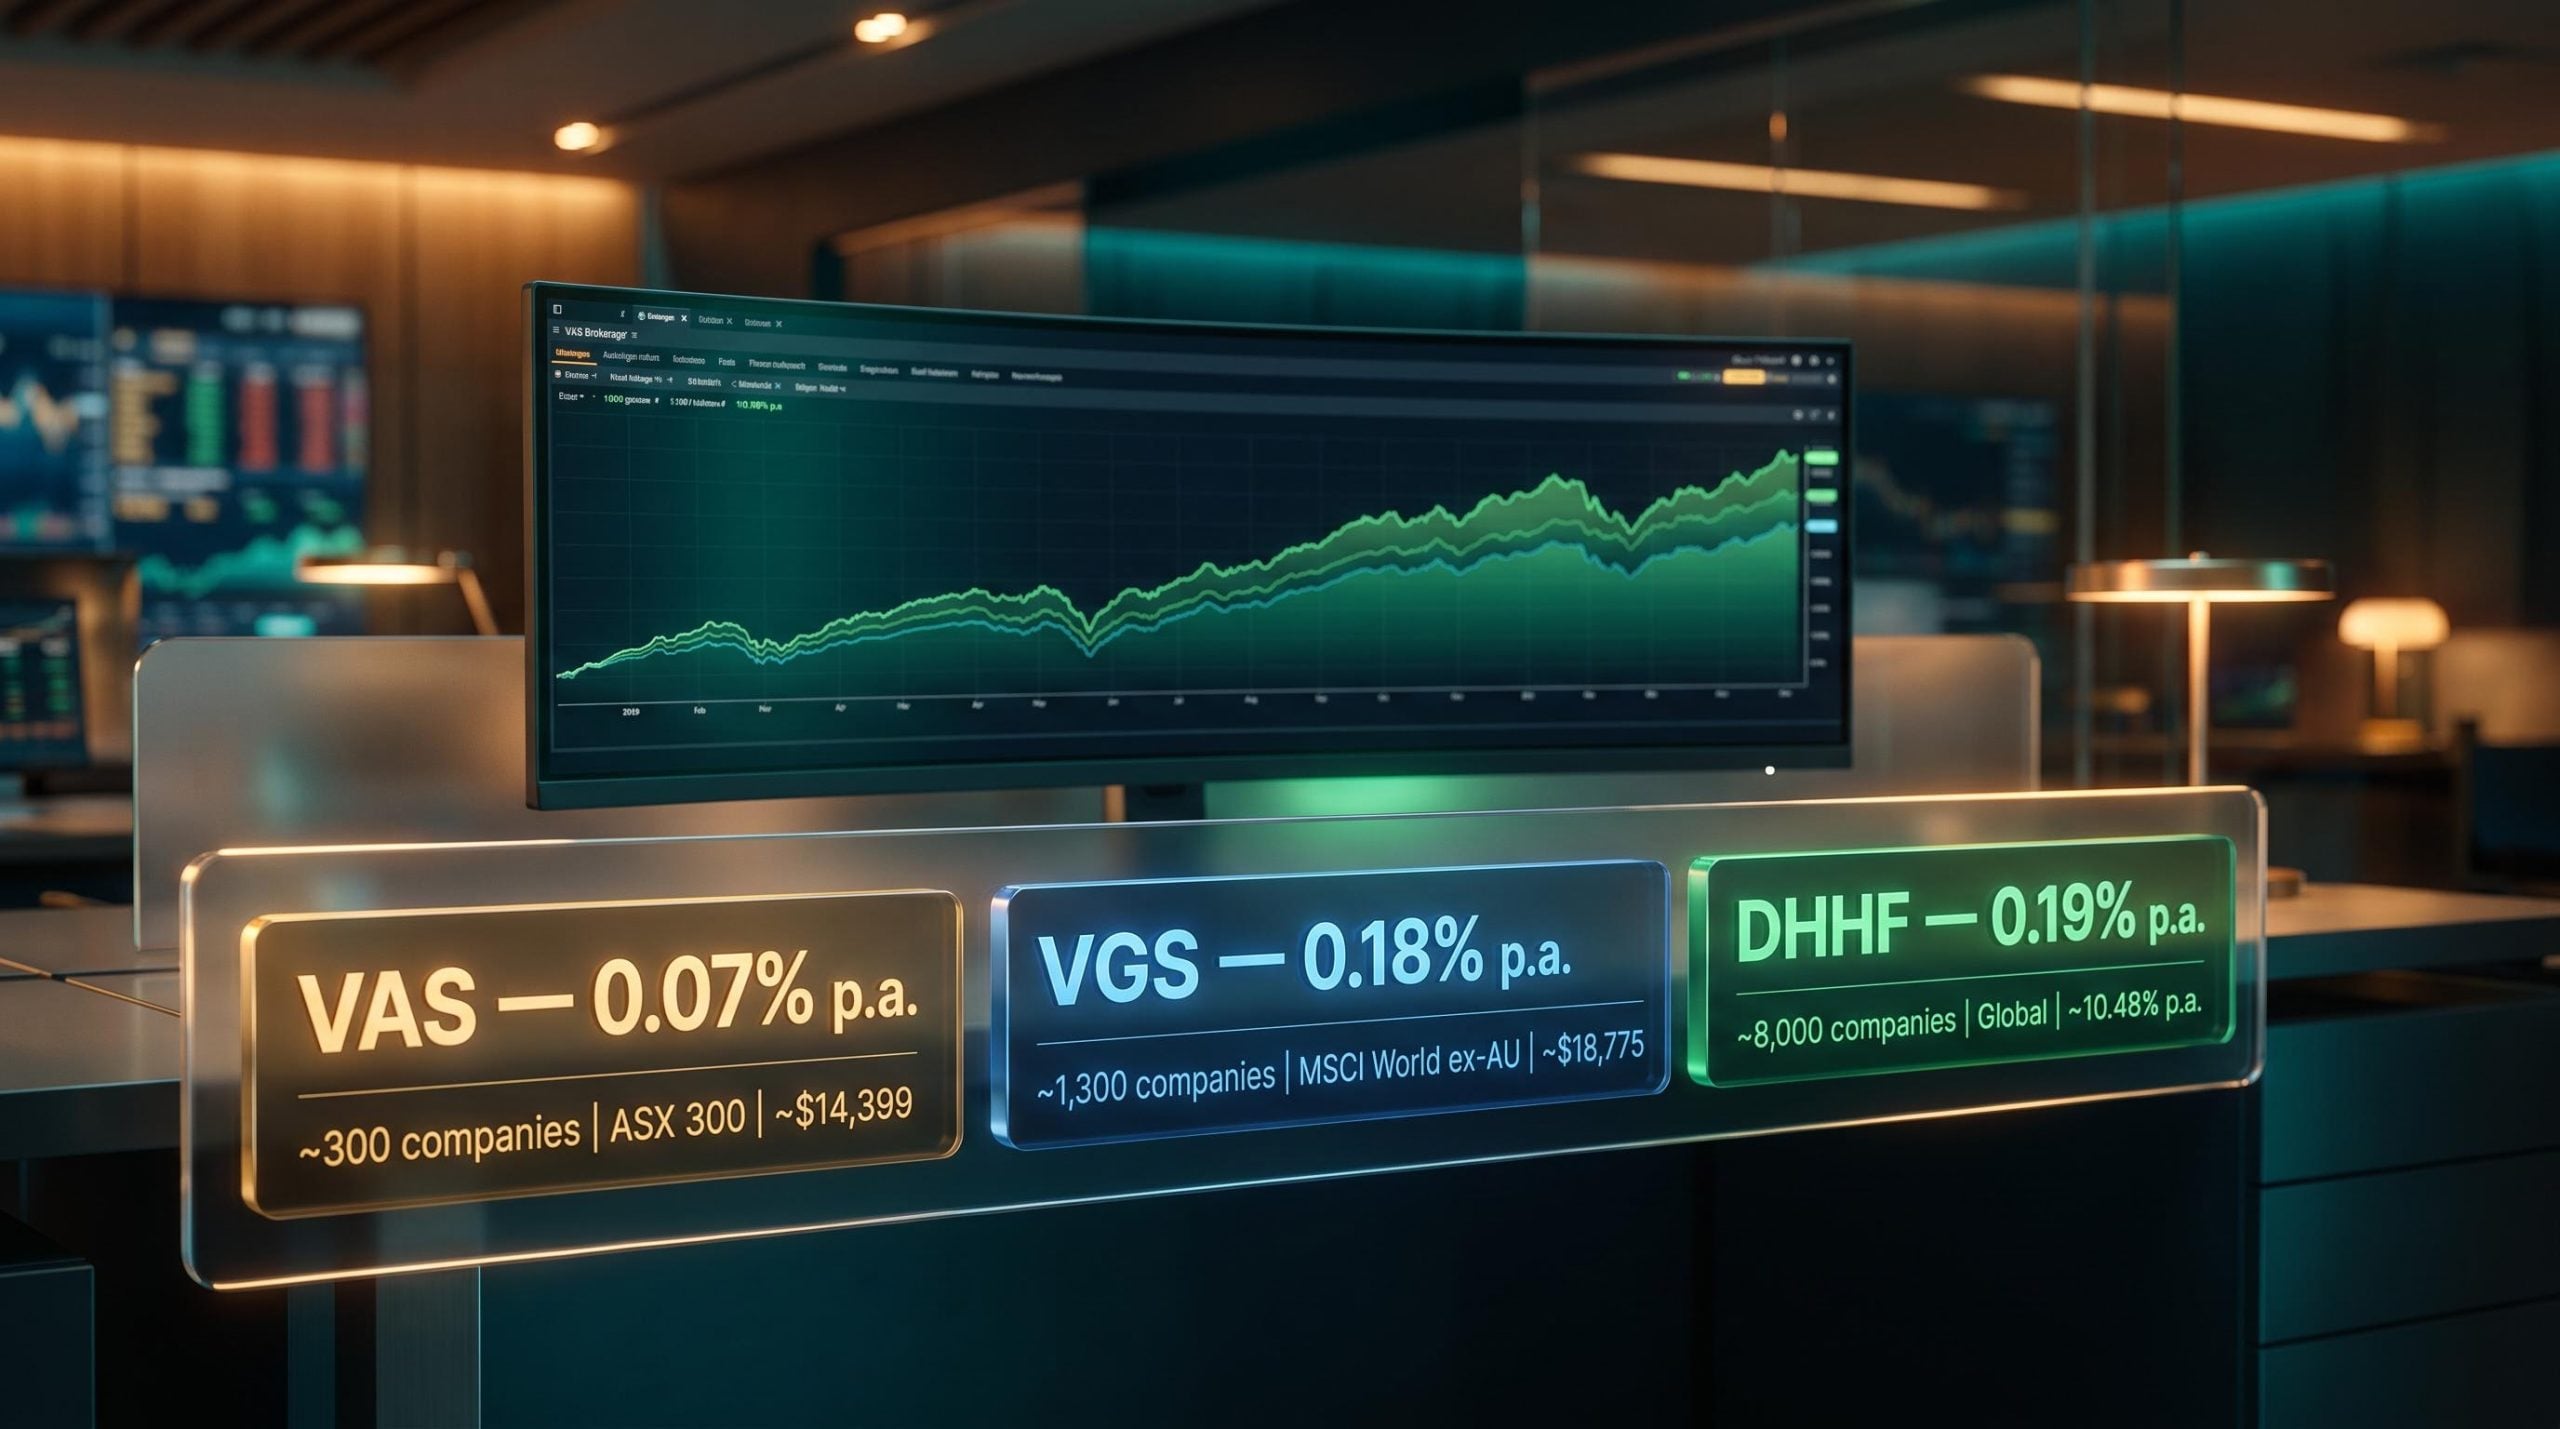
Here is what each fund charges you annually, expressed as a management expense ratio (MER), the percentage of your balance deducted each year to cover fund operating costs:
- VAS: 0.07% p.a.
- VGS: 0.18% p.a.
- DHHF: 0.19% p.a.
(Confirm the latest figures in each fund’s Product Disclosure Statement, as fees may change.)
DHHF’s slightly higher fee reflects the cost of its multi-asset, internally rebalancing structure. You are paying a fraction more for the convenience of not managing the allocation yourself.
In passive investing, fees are one of the few variables entirely within your control. You cannot control market returns, but you can control what you pay for access to them.
On a $50,000 holding, the difference between 0.07% and 0.19% looks trivial in year one: roughly $60. But compounded over 20 years, that gap quietly reshapes your outcome into a meaningful sum. Each basis point compounds against you every year, and unlike a bad quarter, it never reverses.
VAS is the cheapest of the three by a clear margin. But that advantage only translates into a better long-term outcome if its underlying index performs comparably to the alternatives. Fees must be assessed alongside returns, not in isolation.
What the historical returns actually show
Here is where the numbers get interesting, and where the temptation to draw the wrong conclusion is highest.
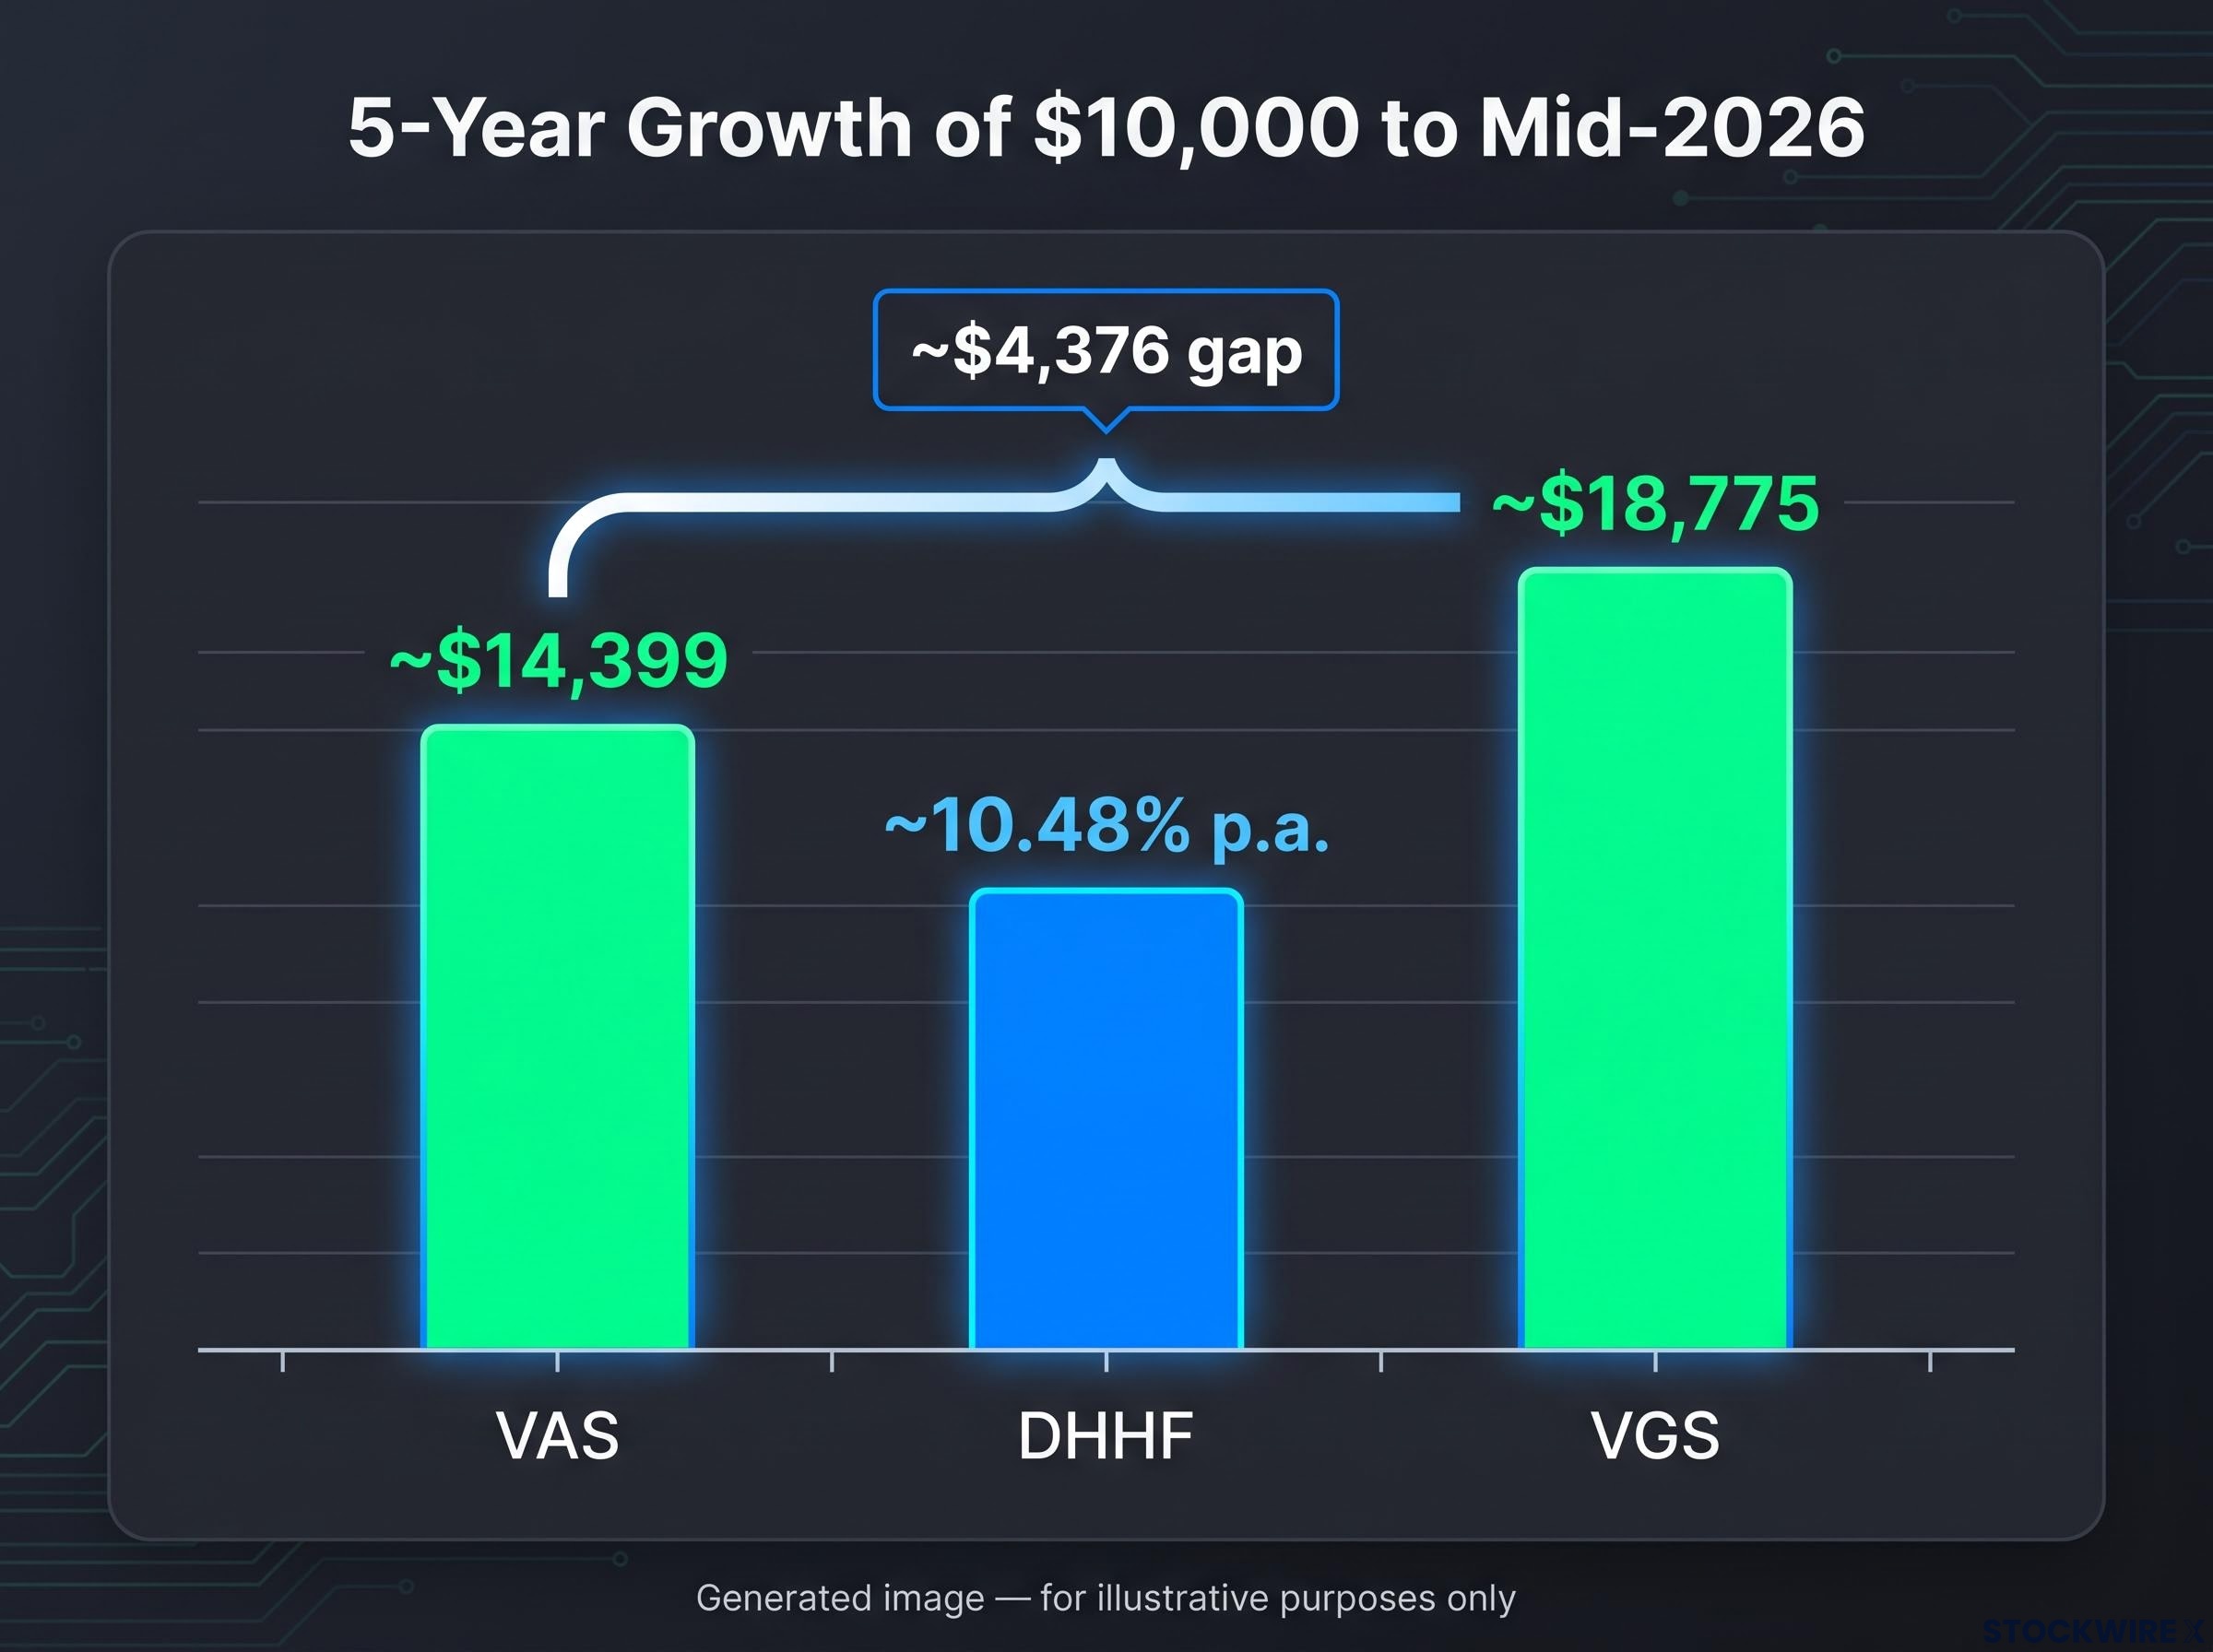
Over the five years to mid-2026, a $10,000 investment in each fund would have grown to very different amounts, according to provider-reported hypothetical figures:
| Fund | $10,000 grew to (approx.) | Approx. annualised return | Reference date |
|---|---|---|---|
| VAS | ~$14,399 | High single digits to low teens % | Mid-2026 |
| VGS | ~$18,775 | Low teens % | Mid-2026 |
| DHHF | Consistent with ~10.48% p.a. | ~10.48% compound annual | Mid-2026 |
The gap between VGS and VAS is real and significant. Over five years, VGS turned the same starting sum into roughly $4,376 more than VAS. That is not a rounding error.
But the explanation matters as much as the number. VGS’s outperformance in this period reflects the heavy weighting of US technology companies in the MSCI World ex-Australia Index, companies like Nvidia, Apple, and Microsoft that surged through to mid-2026. VAS’s lower return is partly a function of the ASX’s underrepresentation of technology and healthcare relative to global indices.
That context changes how you should read the gap. The recent five-year window is largely a story about US technology concentration rather than a permanent structural advantage of international over domestic equities. Past technology booms have not always repeated on the same timeline, and the sectors that lagged in one cycle have led in the next.
Past performance is not a reliable indicator of future returns. These are point-in-time provider figures, recalculated regularly. Check current performance charts on the Vanguard and BetaShares websites for up-to-date data.
Franking credits, currency risk, and the tax layer most beginners overlook
This is the section that often changes minds, because it addresses factors that are invisible in standard fund comparison tables but very visible in your bank account and tax return.
Understanding franking credits and which investors benefit most
Australia’s dividend imputation system means that when an Australian company pays tax on its profits and then distributes a dividend to you, you receive a franking credit representing the tax already paid. You can use that credit to offset your own income tax, or in some cases receive it as a cash refund.
VAS delivers fully or partially franked distributions because every underlying company is Australian. That makes it particularly valuable for investors in lower tax brackets, retirees, and Self-Managed Super Fund (SMSF) members who can claim the full value of imputation credits.
VGS carries no franking benefit at all. Its underlying holdings are all international companies paying foreign-sourced dividends, and the imputation system does not apply to foreign income.
DHHF receives partial franking through its Australian equity sleeve, but the blended benefit is substantially lower than a pure VAS holding.
For a retiree or SMSF investor, the after-tax value of VAS’s franked distributions can close the gap with VGS’s headline return significantly. The apparently lower-returning fund may actually deliver more usable income once imputation credits are factored in.
Currency risk in VGS and DHHF: what an AUD move actually does to your return
VGS is unhedged. That means movements in the Australian dollar directly affect your returns. If the AUD rises 10% against major foreign currencies, your VGS returns shrink by roughly the same amount in Australian dollar terms, even if the underlying shares have not moved. Conversely, a falling AUD enhances your returns.
DHHF uses a mix of hedged and unhedged underlying ETFs, which dampens but does not eliminate currency effects.
VAS has no currency exposure at all, since every holding is ASX-listed in Australian dollars.
| Fund | Distribution yield (approx.) | Franking status | Currency exposure |
|---|---|---|---|
| VAS | ~4% (verify via Vanguard) | Fully or partially franked | None (AUD only) |
| VGS | Lower blended yield | No franking credits | Fully unhedged |
| DHHF | ~2.1% (BetaShares, mid-2026) | Partially franked (Australian sleeve) | Mixed hedged/unhedged |
Which fund suits which kind of investor?
Now that you understand the building blocks, the question becomes personal: which fund fits the kind of investor you actually are?
VAS suits you if you want domestic income with franked distributions, exposure to Australian economic growth, and simplicity in tax treatment. It works best as a complement to a separately held international fund like VGS, giving you control over the domestic/international split.
VGS suits you if your priority is long-term capital growth from globally dominant sectors, particularly technology and healthcare, that are not well represented on the ASX. The typical approach is to pair it with VAS. An illustrative split of 30-40% VAS and 60-70% VGS roughly mirrors the domestic/international balance found in many diversified growth funds. That split is an example, not a recommendation.
DHHF suits you if you want a single-fund solution covering the entire global equity market, including emerging markets (China, India, Taiwan, Brazil) and small caps, without the need to manage allocation splits or rebalance between holdings. As at mid-2026, DHHF’s approximate allocation was 35.1% Australian shares, 41.5% global developed (US-heavy), approximately 10% emerging markets, with the remainder in global small caps. These weights shift with markets and rebalancing.
The choice between building a two-fund portfolio and buying DHHF is ultimately a choice about how much ongoing attention you want to give your investments. Neither approach is objectively superior. DHHF’s convenience has a small cost premium. The DIY VAS/VGS split has a rebalancing obligation that some investors underestimate.
Deciding between a VAS/VGS split and DHHF is ultimately a portfolio structure decision, and the split between growth and defensive assets, as well as the number of funds you hold, shapes long-term outcomes more than the specific tickers you choose.
Before choosing, ask yourself three questions:
- What is your tax position, and do you benefit materially from franking credits?
- Do you want to manage two holdings and rebalance periodically, or would you prefer a single fund that handles allocation internally?
- Do you want exposure to emerging markets and global small caps, or are developed markets sufficient?
Your answers to those three questions will do more to settle the decision than any return chart.
| Fund | Primary use case | Best suited to | Key trade-off |
|---|---|---|---|
| VAS | Domestic income + franking | Income-focused, retirees, SMSF | No international exposure |
| VGS | Global developed-market growth | Growth investors pairing with VAS | No emerging markets, unhedged |
| DHHF | One-stop global growth | Simplicity seekers, hands-off investors | Slightly higher fee, less control |
What the right choice looks like before you invest a dollar
You now have three clear decision variables: your tax position and how much value you extract from franking credits; your appetite for ongoing portfolio management versus the convenience of a single fund; and your geographic preferences, specifically whether you want emerging-market exposure or are comfortable with developed markets only.
None of the three funds is the objectively correct choice. Each reflects a deliberate trade-off between cost, diversification breadth, income characteristics, and simplicity. The fund that suits a retiree claiming franking credits in an SMSF is not the same fund that suits a 28-year-old accumulating wealth in a long-term growth portfolio.
VGS is not the only option for international developed-market exposure on the ASX, and a broader global ETF comparison across cost, liquidity, and return profiles helps investors confirm whether VGS is the right fit or whether alternatives like IVV or IOO better match their specific portfolio needs.
- What is your marginal tax rate, and does the franking credit benefit meaningfully change your after-tax return?
- Are you comfortable rebalancing a VAS/VGS split once or twice a year, or would you rather DHHF handle that automatically?
- Does exposure to emerging markets and global small caps matter to your investment thesis, or is developed-market coverage sufficient?
Before investing, verify current MERs (VAS 0.07%, VGS 0.18%, DHHF 0.19%), distribution yields, and performance figures directly with Vanguard (for VAS and VGS) and BetaShares (for DHHF). Review the Product Disclosure Statement for each fund. These documents contain the detail that a guide like this cannot replace.
Low cost and consistency matter more than allocation precision for investors starting out. The investor who picks any one of these three funds and holds it consistently will almost certainly outperform the investor who spends six more months comparing them without committing, because time in the market and cost control are the variables that matter most at the beginning.
For most new investors, any of these three funds represents a sound starting point. The best choice is the one you understand well enough to hold with confidence through the inevitable rough quarters.
This article is for informational purposes only and should not be considered financial advice. Investors should conduct their own research and consult with financial professionals before making investment decisions. Past performance does not guarantee future results.
—