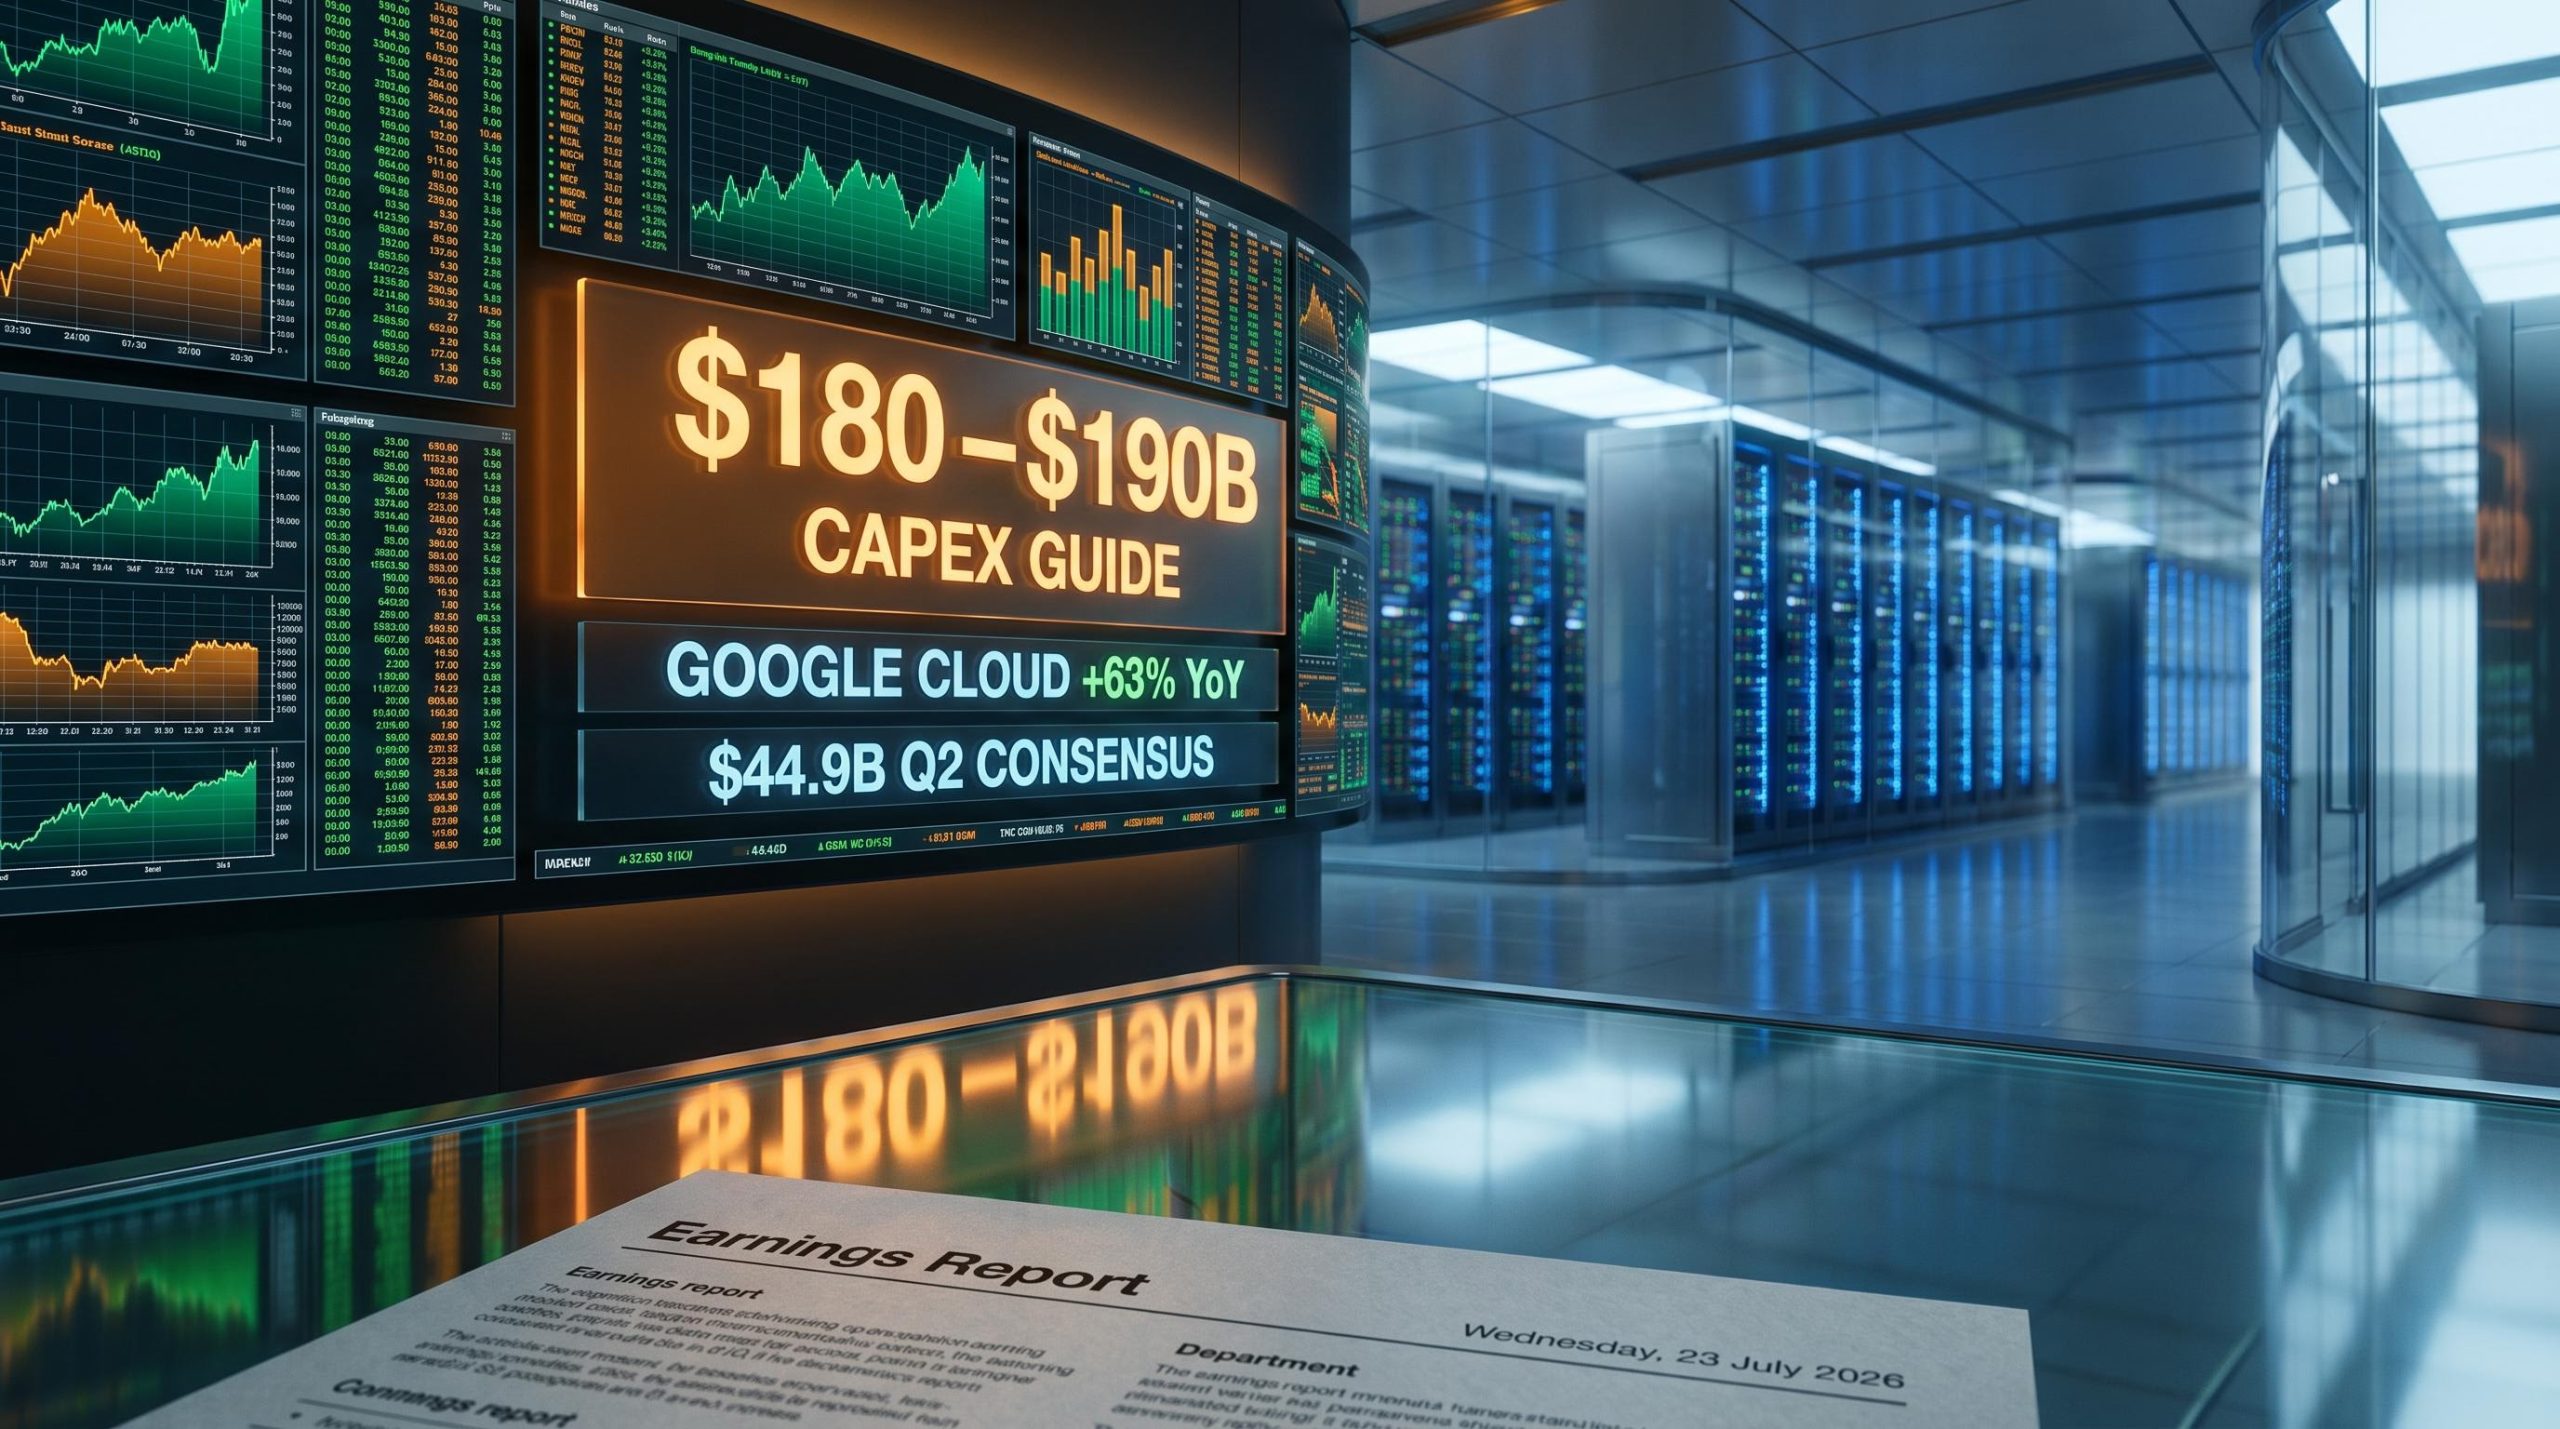
On Wednesday, 23 July 2026, one company will release a quarterly earnings report. It will read like a referendum on whether the largest infrastructure build-out in corporate history is working.
Alphabet enters that moment with a market capitalisation of roughly $4.2 trillion, a $180-$190 billion capital expenditure commitment for 2026, and the clearest single claim to being the proxy through which investors price the entire AI compute trade. S&P 500 earnings are forecast to grow approximately 26% year-over-year in Q2, giving the season a bullish backdrop that Alphabet’s numbers could either extend or complicate.
Here is a framework for reading Wednesday’s release: the specific data points that carry the most weight for your portfolio exposure, what each scenario means for names well beyond Alphabet itself, and how to sort signal from noise when the call begins.
Why a single earnings report can move the entire AI trade
Start with the maths. By market capitalisation, Alphabet ranks among the three largest companies in the United States. Its weighting in both the S&P 500 and the Nasdaq means its guidance does not just move its own share price; it moves indices directly. When the stock reprices after hours, index futures reprice with it.
Then consider the supply chain. Hyperscalers function as the demand origin point for every major segment of AI hardware: GPUs, high-bandwidth memory (HBM, the specialised memory chips AI accelerators require), server assemblies, networking equipment, and data-centre facilities. Alphabet’s capital expenditure signals propagate outward to chip vendors, server manufacturers, and infrastructure operators before any of those companies have reported their own quarters.
The three transmission channels work simultaneously:
- Index weight: Alphabet’s sheer market cap means its guidance shifts index-level performance directly, affecting passive holders and index-linked portfolios.
- Hyperscaler capex primacy: Alphabet’s spending plans set the demand baseline for the entire AI hardware supply chain, from semiconductor fabs to cooling-system vendors.
- Magnificent Seven sentiment: The Magnificent Seven label (the group of mega-cap tech stocks driving U.S. equity gains) concentrates market sentiment. When Alphabet disappoints, the category gets questioned, not just the company.
On 17 July 2026, the S&P 500 recorded a weekly loss, pulled down by a sharp retreat in semiconductor shares. That decline offered a preview of how sensitive AI-adjacent names already are to demand signals. The concentration of index influence in a handful of names means Alphabet’s capex tone on Wednesday carries market-moving weight that extends far beyond any single position in the stock.
When big ASX news breaks, our subscribers know first
The capex number that the entire AI supply chain is watching
Capital expenditure, or capex (the money a company spends on physical infrastructure, equipment, and long-lived assets), is the line item that matters most in this report. The trajectory tells the story.
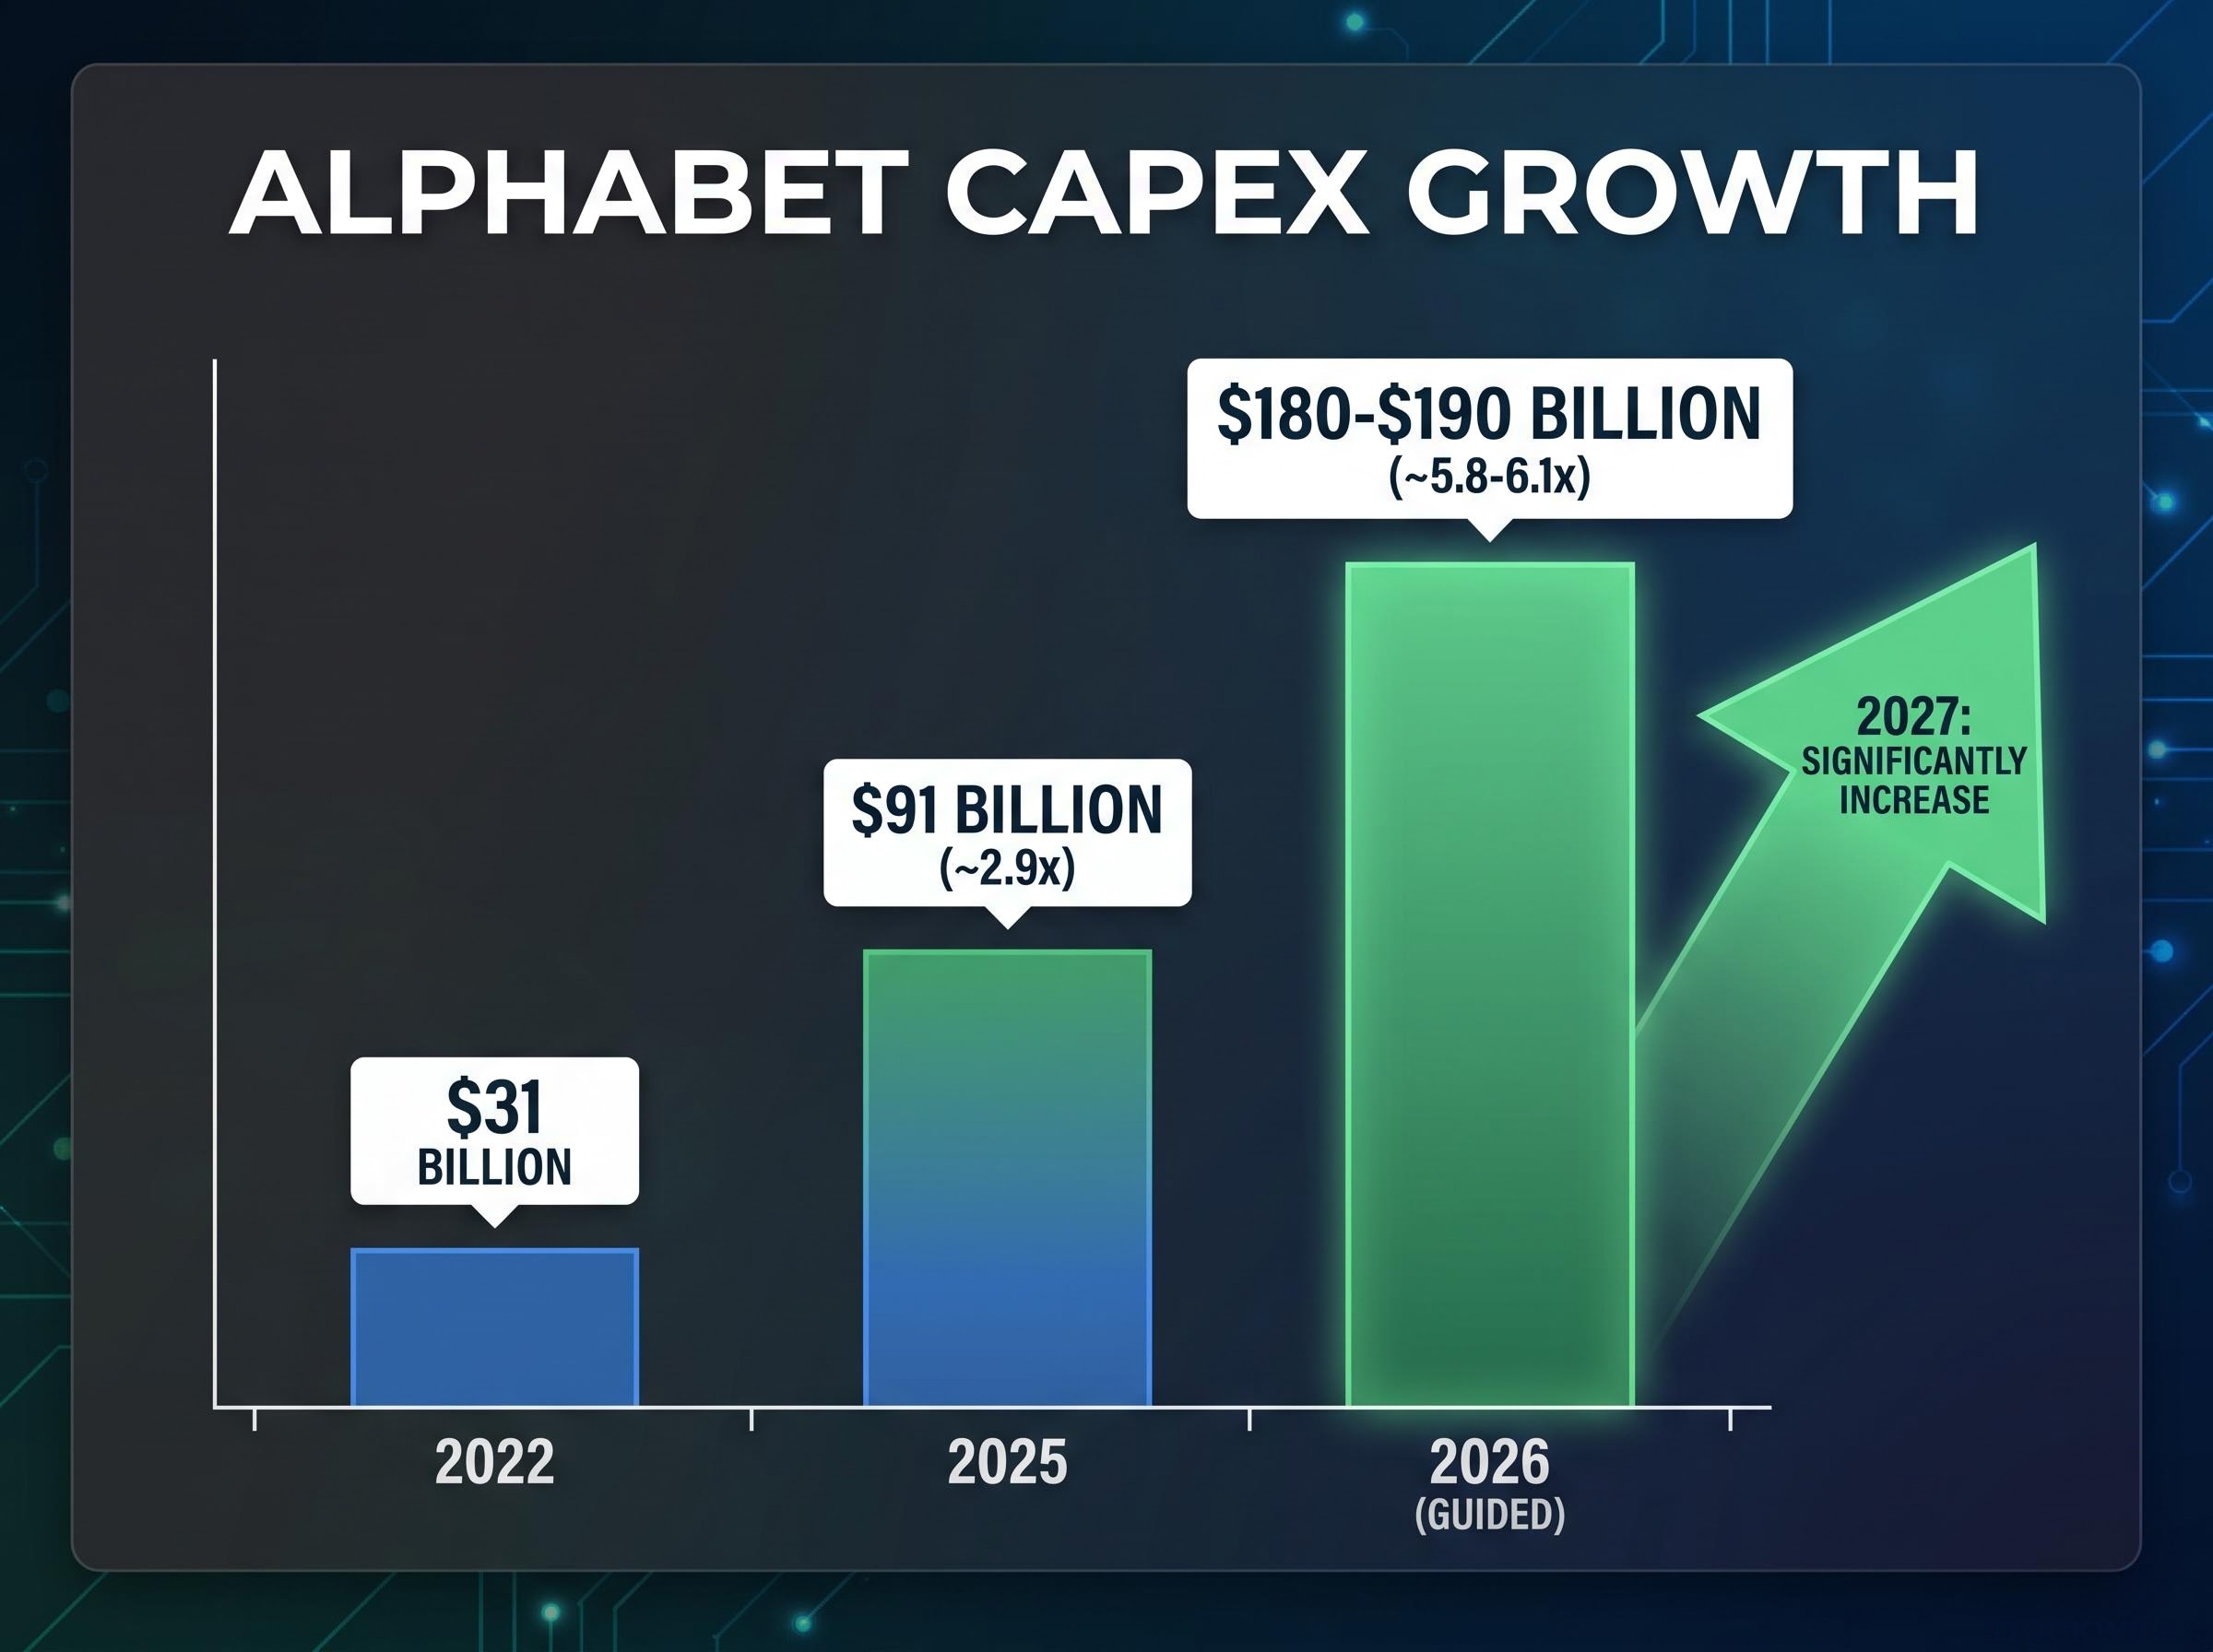
| Year | Capex (approx.) | Growth vs. 2022 |
|---|---|---|
| 2022 | $31 billion | Baseline |
| 2025 | $91 billion | ~2.9x |
| 2026 (guided) | $180-$190 billion | ~5.8-6.1x |
Alphabet raised the 2026 range from $175-$185 billion in February to $180-$190 billion following subsequent updates tied to AI infrastructure expansion. Management has also committed explicitly that 2027 capex will “significantly increase” compared to 2026. The escalation is not slowing down; it is compounding.
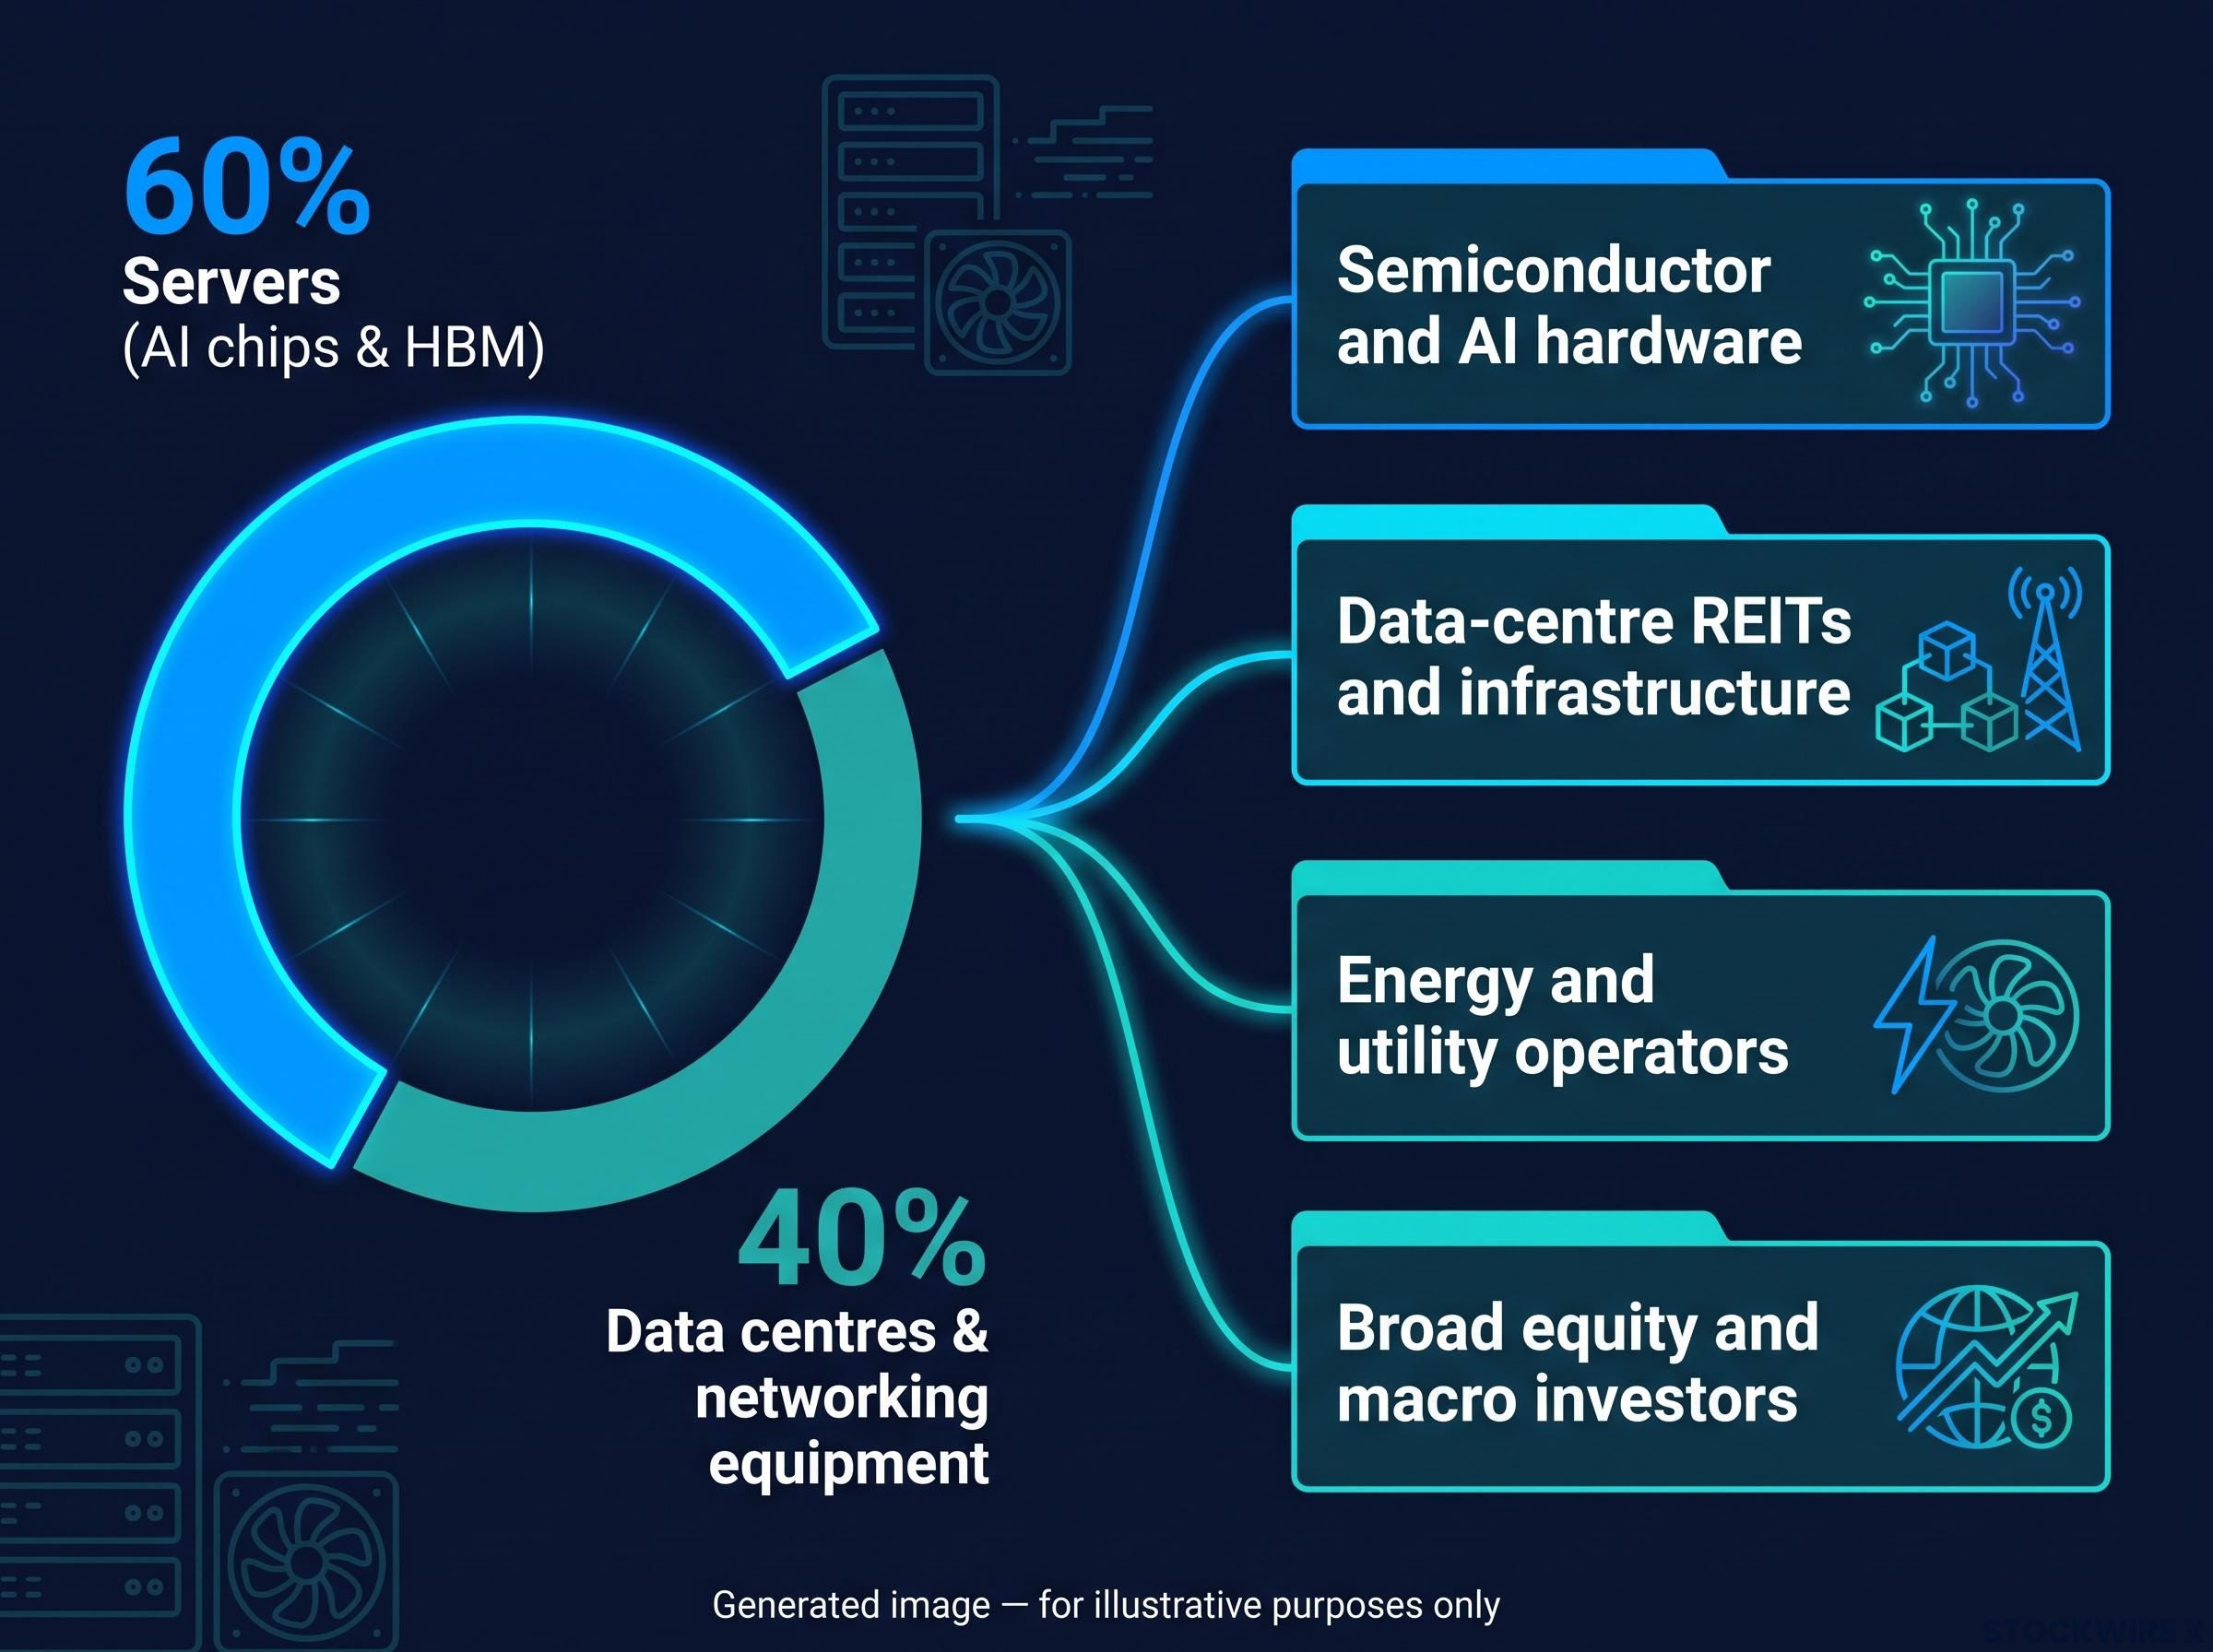
Where the money goes matters as much as how much there is. Roughly 60% of infrastructure spend targets servers, which is the direct demand channel for AI chips and HBM. The remaining 40% goes to data centres and networking equipment. That composition split tells you which supply-chain segments are most directly exposed to any change in Alphabet’s plans.
The four largest US hyperscalers are collectively on track to deploy $630-725 billion in 2026, and mapping where hyperscaler capex flows across semiconductors, foundries, and memory producers reveals which supply-chain segments carry the most structural pricing power regardless of any single earnings print.
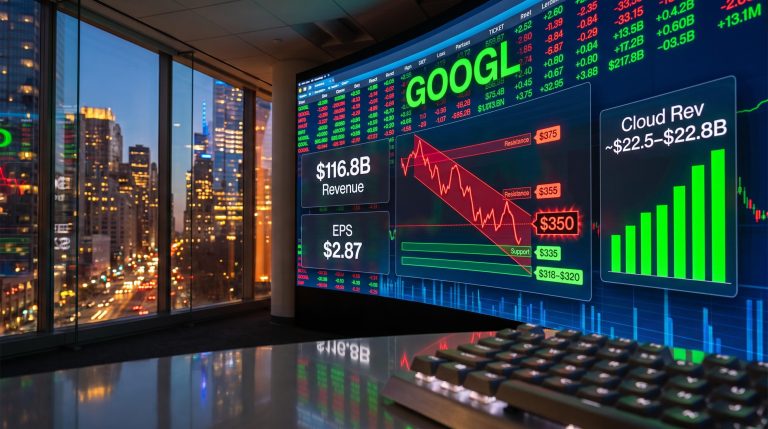
The specific benchmark for Wednesday night is the FactSet consensus Q2 capex figure of approximately $44.9 billion, representing roughly 100% year-over-year growth. If Q2 capex comes in meaningfully above that number and full-year guidance holds or rises, you should treat that as a green light for continued exposure to the AI infrastructure trade across semiconductors, server hardware, and data-centre real estate. A miss, particularly one accompanied by cautious language about pacing or efficiency, would invite immediate repricing in those same segments.
Google Cloud as the monetisation proof point
Capex is the input. Cloud revenue is where you find out whether that input is producing returns.
In Q1 2026, Google Cloud revenue grew 63% year-over-year to $20 billion, within total company revenue of $109.9 billion (up 22% year-over-year). Those are large numbers. But the context that made them truly significant was a single phrase from management.
“Compute constrained”: Alphabet’s characterisation of its Cloud segment in Q1 2026, indicating that demand for AI compute was outpacing available capacity.
That framing set a specific expectation: more capacity equals more Cloud revenue. The entire rationale for doubling capex year-over-year rests on that equation holding. Q2 is where it gets tested again.
Where the ROI question gets answered
AI-specific workloads, enterprise adoption rates, and pricing dynamics within the Cloud segment are the three variables that determine whether the capex-to-revenue translation is working as modelled. Analyst consensus expects Q2 diluted earnings per share (EPS) of approximately $2.86, up roughly 24% year-over-year. Meeting or beating that number matters, but the Cloud-specific commentary matters more.
If Cloud growth sustains above 50% and management attributes it specifically to AI workloads, you should interpret that as evidence that the “build now, monetise fast” thesis is tracking on schedule. Conversely, any language about pricing pressure, elongated enterprise sales cycles, or a noticeable deceleration in the growth rate would invite analysts to question whether the capex programme is producing the revenue it was designed to unlock.
Watch whether the “compute constrained” phrase reappears. If it disappears from Q2 commentary, that absence is itself a signal that the demand-supply dynamic may be shifting.
The Google Cloud backlog reached $460 billion in Q1 2026, with more than $230 billion expected to convert within 24 months, a forward revenue schedule that gives the ‘compute constrained’ framing its most concrete financial expression and explains why analysts treat Cloud growth deceleration as a thesis-level risk.
Which sectors feel the ripple, and how to read the signals for each
Alphabet’s report is not a single-stock event. It functions as a transmission mechanism across four distinct investor segments, each with its own dependency on what management says Wednesday.
| Investor segment | Key signal to watch | Bullish scenario | Cautious scenario |
|---|---|---|---|
| Semiconductor and AI hardware | Q2 capex vs. $44.9B consensus; chip supply and HBM commentary | Capex beat with server-heavy composition confirms GPU and HBM demand runway | Below-consensus capex or slower 2027 ramp triggers de-rating across chip names |
| Data-centre REITs and infrastructure | New or expanded facility plans; power and cooling constraints | Accelerated build-out commitment underpins growth forecasts for infrastructure providers | Delayed expansion or efficiency-focused language reduces forward demand visibility |
| Energy and utility operators | Power sourcing commentary; utility partnerships; grid constraint discussion | Long-dated power contracts and renewable commitments support utility capex expectations | Silence on power needs or shift to efficiency narrative removes a demand catalyst |
| Broad equity and macro investors | Index weighting effect; Magnificent Seven sentiment read-through | Strong print pulls S&P 500 and Nasdaq back toward record highs | Cautious tone catalyses rotation out of richly valued AI names, absorbed more slowly across broad indices |
The ripple is not symmetric. A bullish Alphabet print lifts all four categories. A cautious print hits semiconductors and data-centre names fastest and hardest, with the macro category absorbing the sentiment shift more gradually. If you hold positions across any of these sectors, Wednesday’s call functions as a live checklist event, not simply a company-specific data point.
Reading the call in real time: the nine signals that matter
The numbered list below is ordered by priority. Capex is first because it carries the broadest read-through. Management language quality matters as much as raw numbers on several of these items.
- Q2 capex versus the approximately $44.9 billion FactSet consensus, and any change to the $180-$190 billion full-year guide.
- 2027 capex language: does “significantly increase” survive, or does softer phrasing appear?
- Google Cloud Q2 growth rate and explicit attribution of that growth to AI workloads.
- Core advertising revenue strength, which determines how much of the capex programme Alphabet can self-fund through operating cash flow.
- Capex composition versus the 60/40 server-to-data-centre baseline, and any shifts in that mix.
- Chip supply, HBM pricing, and GPU order visibility commentary into 2027.
- Power sourcing and utility partnership announcements or grid constraint discussion.
- Funding mix disclosure: the split between operating cash flow, debt, and equity issuance. A secondary signal, but non-trivial for dilution-sensitive investors.
- AI demand visibility language: multi-year customer commitments, compute constraints, and pipeline characterisation.
Alphabet’s equity raise structure — a $30 billion underwritten offering paired with a $50 billion at-the-market programme — directly shapes signal number eight on the checklist: how the $180-190 billion capex programme is being funded, and what the incremental dilution profile looks like across coming quarters.
The tone of that language carries weight. Listen for the difference:
Bullish language: “Demand remains compute constrained. Multi-year commitments are increasing. We see no signs of slowing.”
Cautious language: “We are optimising deployment pace. Prioritising efficiency. Matching capacity to near-term demand signals.”
If the majority of these nine signals skew bullish, you have a clear basis for maintaining or extending exposure to AI-infrastructure-linked positions into the next reporting cycle.
What Wednesday’s result changes, and what it does not
Even a strong Alphabet print does not resolve the central question of the AI trade. It validates one data point in a multi-year infrastructure cycle where the return-on-investment proof remains partial.
The bar for a positive surprise is elevated. Consensus already expects EPS up approximately 24% year-over-year and capex growth of roughly 100% year-over-year. Alphabet has beaten estimates in each of the last four quarters, which means the market has priced in a pattern of outperformance. Meeting expectations may not be enough to generate meaningful upside; the report needs to exceed them.
What Wednesday can resolve:
- Whether Q2 capex momentum confirms the full-year $180-$190 billion guide is on track.
- Whether Cloud revenue growth is sustaining at a rate that justifies the infrastructure spend.
- Whether management’s tone on 2027 remains expansionary or begins to moderate.
What it cannot resolve: whether the AI infrastructure build-out generates durable, compounding returns over the next three to five years, or whether the current capex cycle eventually produces overcapacity and margin compression. That question will be tested repeatedly as hyperscaler build-outs progress and enterprise adoption data accumulates. Wednesday is the first of several high-stakes confirmation points, not the final one.
A strong report is permission to stay engaged with the trade. It is not a signal to press maximum exposure. The durability of the AI investment thesis depends on evidence that continues to accumulate across multiple reporting cycles, and sizing your risk accordingly is what separates informed positioning from conviction without a framework.
For investors wanting to stress-test the bull, base, and bear cases at current prices, our dedicated guide to Alphabet’s valuation scenarios models the specific revenue and margin assumptions Alphabet must sustain to deliver attractive annualised returns from its current $4.2 trillion market capitalisation.
This article is for informational purposes only and should not be considered financial advice. Investors should conduct their own research and consult with financial professionals before making investment decisions. Past performance does not guarantee future results. Financial projections are subject to market conditions and various risk factors.