Google Cloud grew 63% year-over-year in Q1 2026 and now carries a $460 billion revenue backlog. For a segment that was barely profitable two years ago, that is a structural transformation, not a product cycle. Alphabet’s Q1 2026 earnings, reported on 29 April 2026, landed at a moment when investors are actively reassessing how to value the company. The advertising-dominant Alphabet of 2021 is giving way to something more complicated: a dual-engine business where cloud infrastructure is growing faster than the core, generating margins that rival hyperscale competitors, and consuming capital at a scale that compresses near-term free cash flow.
What follows is an examination of the six dimensions that matter most for investors evaluating Alphabet stock today: the cloud acceleration and what it signals, the margin story, the capex trade-off, the competitive context, the regulatory overhang, and the valuation math that ties it together.
The cloud numbers that changed the investment thesis
Start with the growth rate. Google Cloud revenue hit $20.0 billion in Q1 2026, up 63% year-over-year. The prior quarter’s growth rate sat at approximately 28%. A sequential acceleration of that magnitude in a business already running at scale is analytically unusual; it signals a step-change in enterprise demand, not a one-quarter anomaly.
The three metrics that anchor the shift:
- Revenue: $20.0 billion in Q1 2026, 63% year-over-year growth
- Backlog: $460 billion, doubled sequentially; more than $230 billion expected to convert within 24 months
- Generative AI revenue: approximately 800% year-over-year growth at the product level
$460 billion backlog. More than half is expected to convert within 24 months, implying an annualised cloud run rate approaching $100 billion or more within one to two years.
That backlog figure is the detail most likely to shift analyst models. It converts an abstract growth story into a revenue schedule investors can underwrite: locked-in enterprise commitments with near-term conversion visibility, not speculative demand projections.
When big ASX news breaks, our subscribers know first
From margin drag to margin engine: the cloud profitability shift
Two years ago, Google Cloud operated at thin margins while Alphabet subsidised the segment’s growth from Search profits. In Q1 2026, the segment reported an operating margin of 32.9%, producing $6.6 billion in operating income on $20 billion in revenue. The prior quarter’s margin sat at approximately 18%.
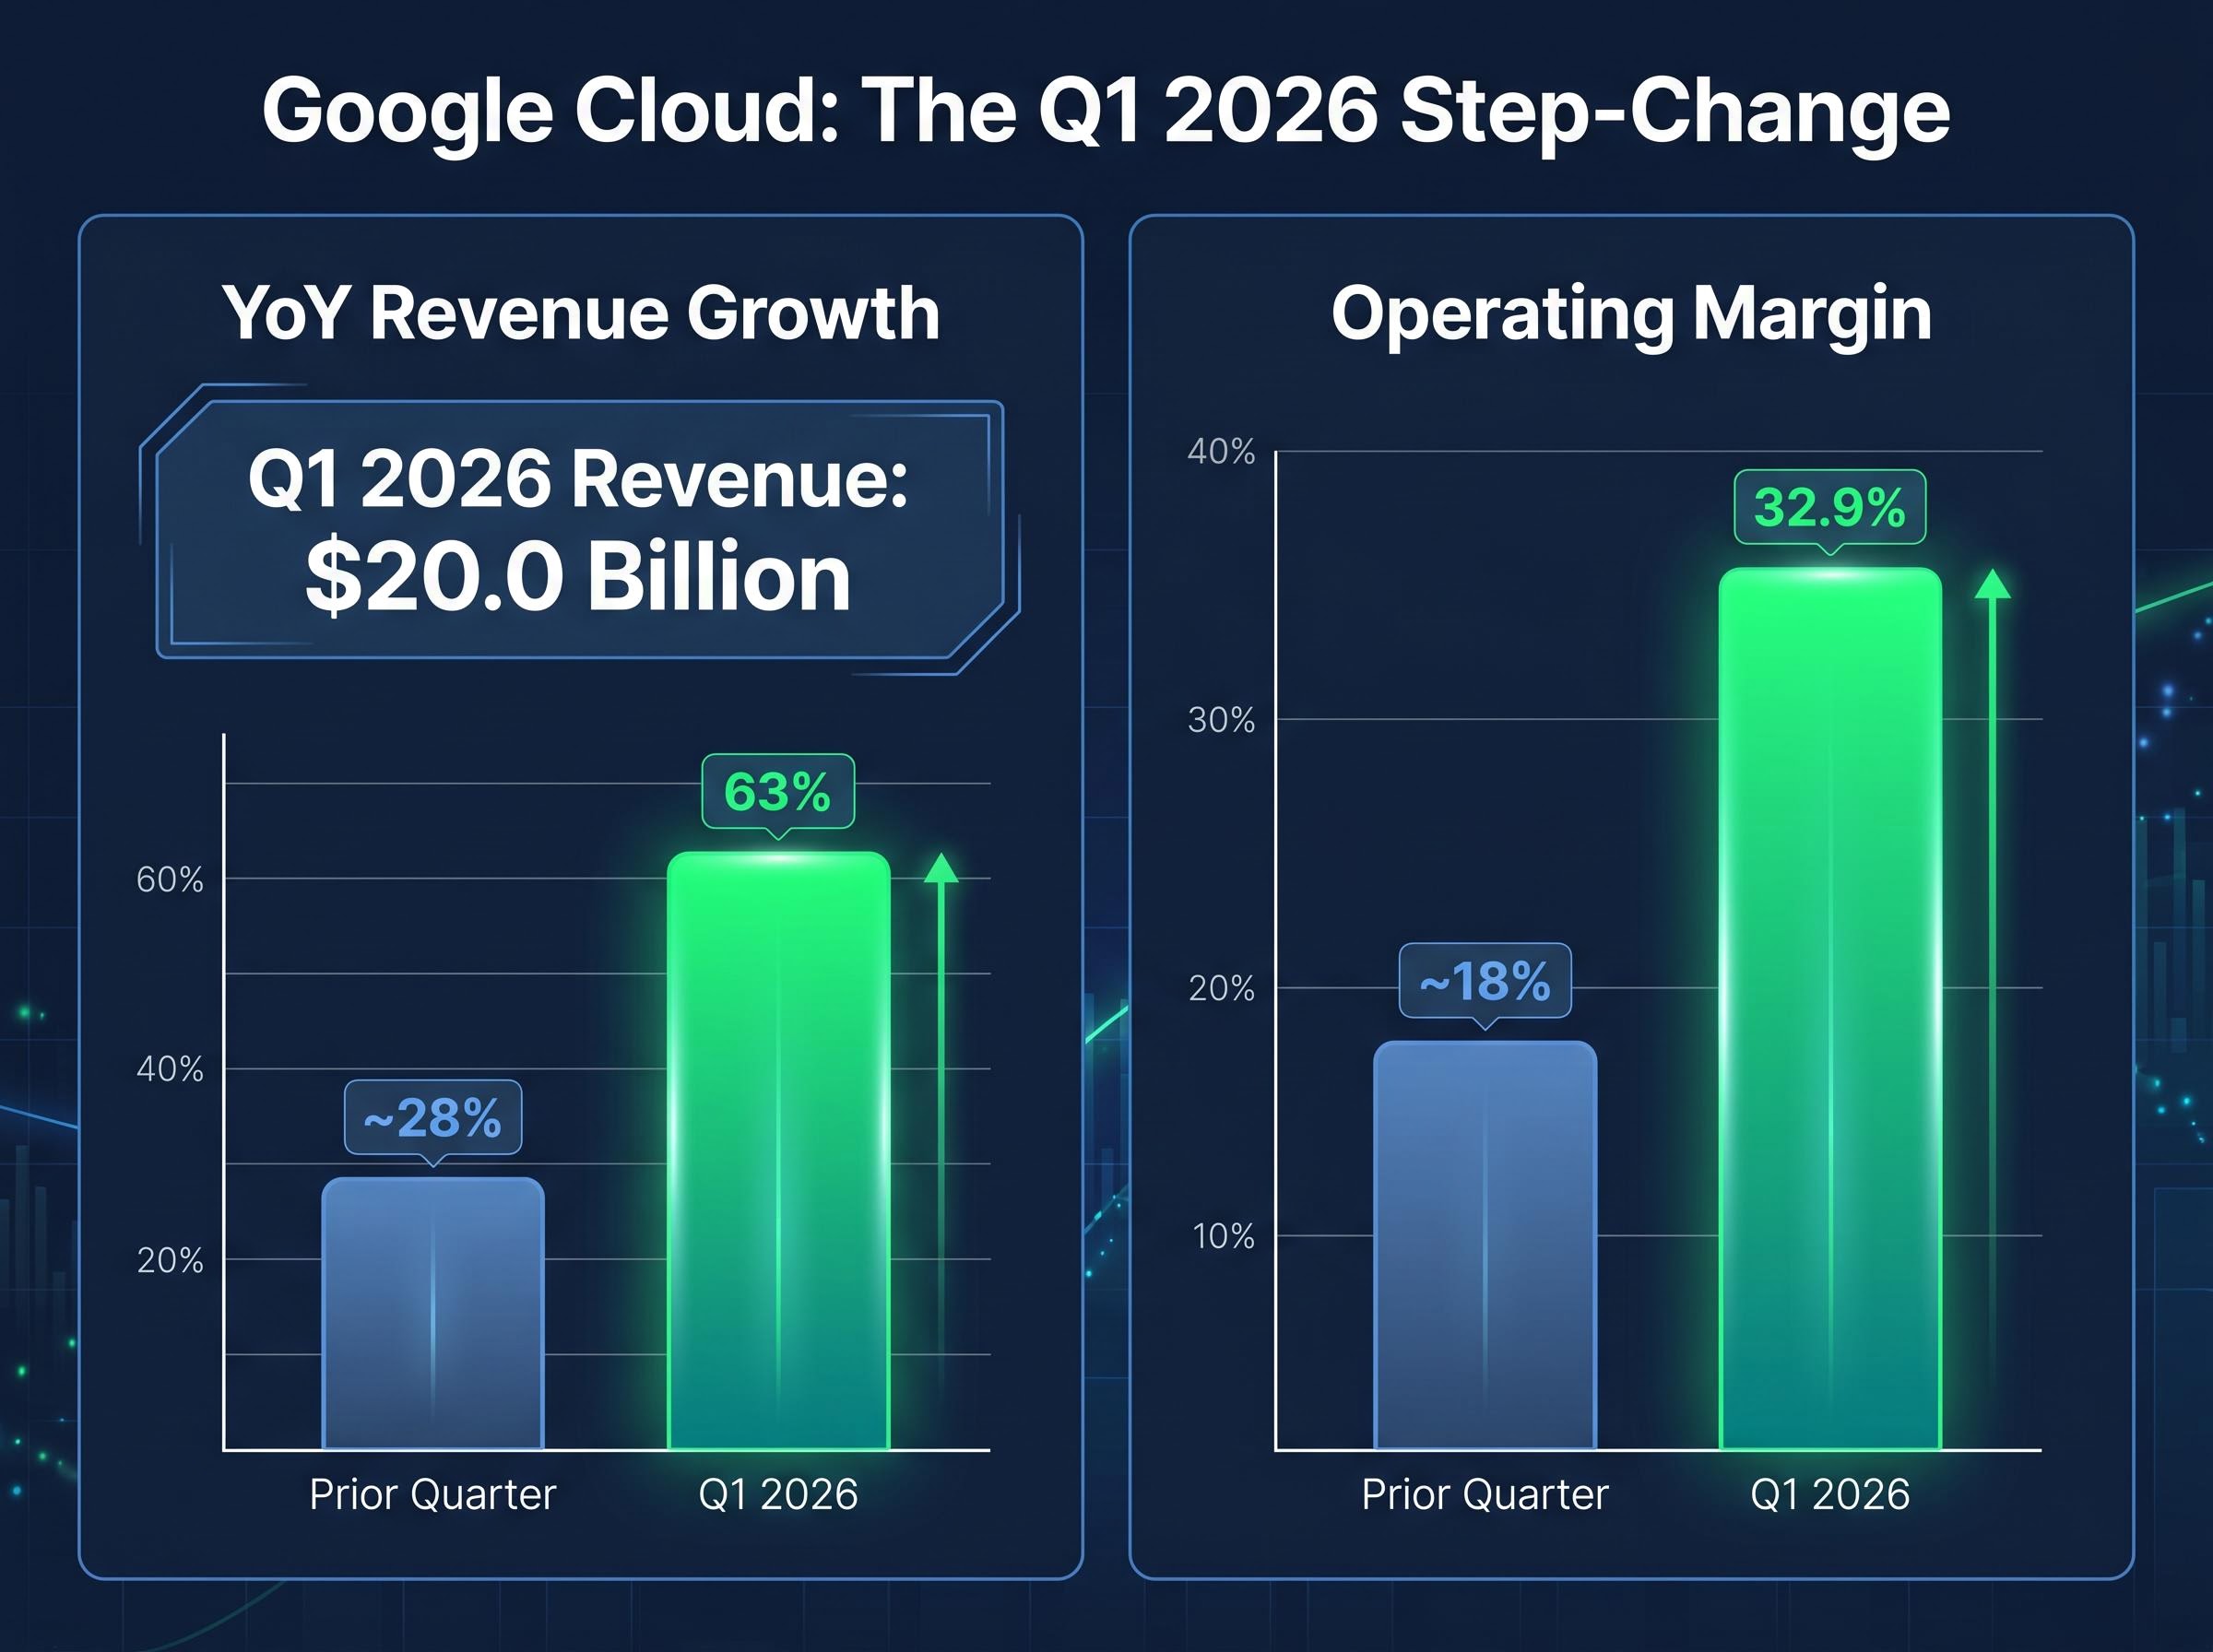
That expansion, roughly 15 percentage points in a single quarter, is the fastest such move among the three major cloud providers in recent memory. The comparison to AWS, which has historically operated in the mid-to-high 30% range, puts the shift in context.
| Provider | Prior Margin | Current/Recent Margin |
|---|---|---|
| Google Cloud | ~18% | 32.9% (Q1 2026) |
| AWS | Mid-30% range | Mid-to-high 30% range |
Google Cloud is no longer chasing the profitability tier of its hyperscale competitors. It is operating within it.
Why the supply constraint is a margin tailwind, not just a headline
AI compute demand, spanning both proprietary Tensor Processing Units (TPUs) and Nvidia GPUs, currently exceeds available supply. That imbalance reduces the price competition that typically compresses cloud margins during growth phases. Enterprises competing for limited capacity accept pricing terms they would negotiate harder on in a balanced market.
This dynamic is temporary. But for the current cycle, it is extending the window in which Google Cloud can grow revenue without the usual margin trade-off. Multi-year contract commitments reinforce this further: enterprises locking in long-duration agreements provide the operating leverage that makes margin improvement durable rather than episodic.
What AI infrastructure actually is, and why enterprises are committing now
The $460 billion backlog is not a software subscription pipeline. What enterprises are purchasing is compute infrastructure, the physical and virtual capacity to run AI workloads at scale. The distinction matters because the revenue mechanics, margin profiles, and contract structures differ materially from traditional cloud software.
Enterprise AI infrastructure demand falls into three layers, reflecting the production workflow companies are building:
- Training: Renting large-scale compute clusters to train proprietary AI models on internal data
- Inference: Running trained models in production, serving predictions and outputs to end users at scale
- Managed AI services: Using Google Cloud’s pre-built AI tools and platforms (including Gemini-based services) to integrate AI into existing applications
Demand exceeds supply. AI compute capacity, across both TPUs and Nvidia GPUs, remains constrained. Enterprises are signing multi-year contracts now because the cost of not securing capacity during an AI build-out cycle is higher than the commitment risk.
This supply constraint explains the contract urgency. Enterprises are not committing capital out of enthusiasm for AI as a concept; they are locking in capacity because failing to do so risks falling behind competitors who secured it first. Google Cloud’s proprietary TPUs alongside Nvidia GPU availability give it a differentiated offering that competitors cannot replicate identically, reinforcing the platform’s draw.
For investors, the distinction between locked-in multi-year compute contracts and speculative AI-adjacent demand is the key underwriting question for the growth rate’s sustainability.
The capex surge and what it costs shareholders today
| Metric | Value |
|---|---|
| Q1 2026 capex | $35.7 billion |
| Full-year 2026 capex guidance | $175-$190 billion |
| Capex year-over-year change | Approximately doubled |
| Free cash flow year-over-year change | Declined approximately 50% |
$35.7 billion in a single quarter. That figure places Alphabet’s infrastructure investment programme among the largest single-company capital commitments on record.
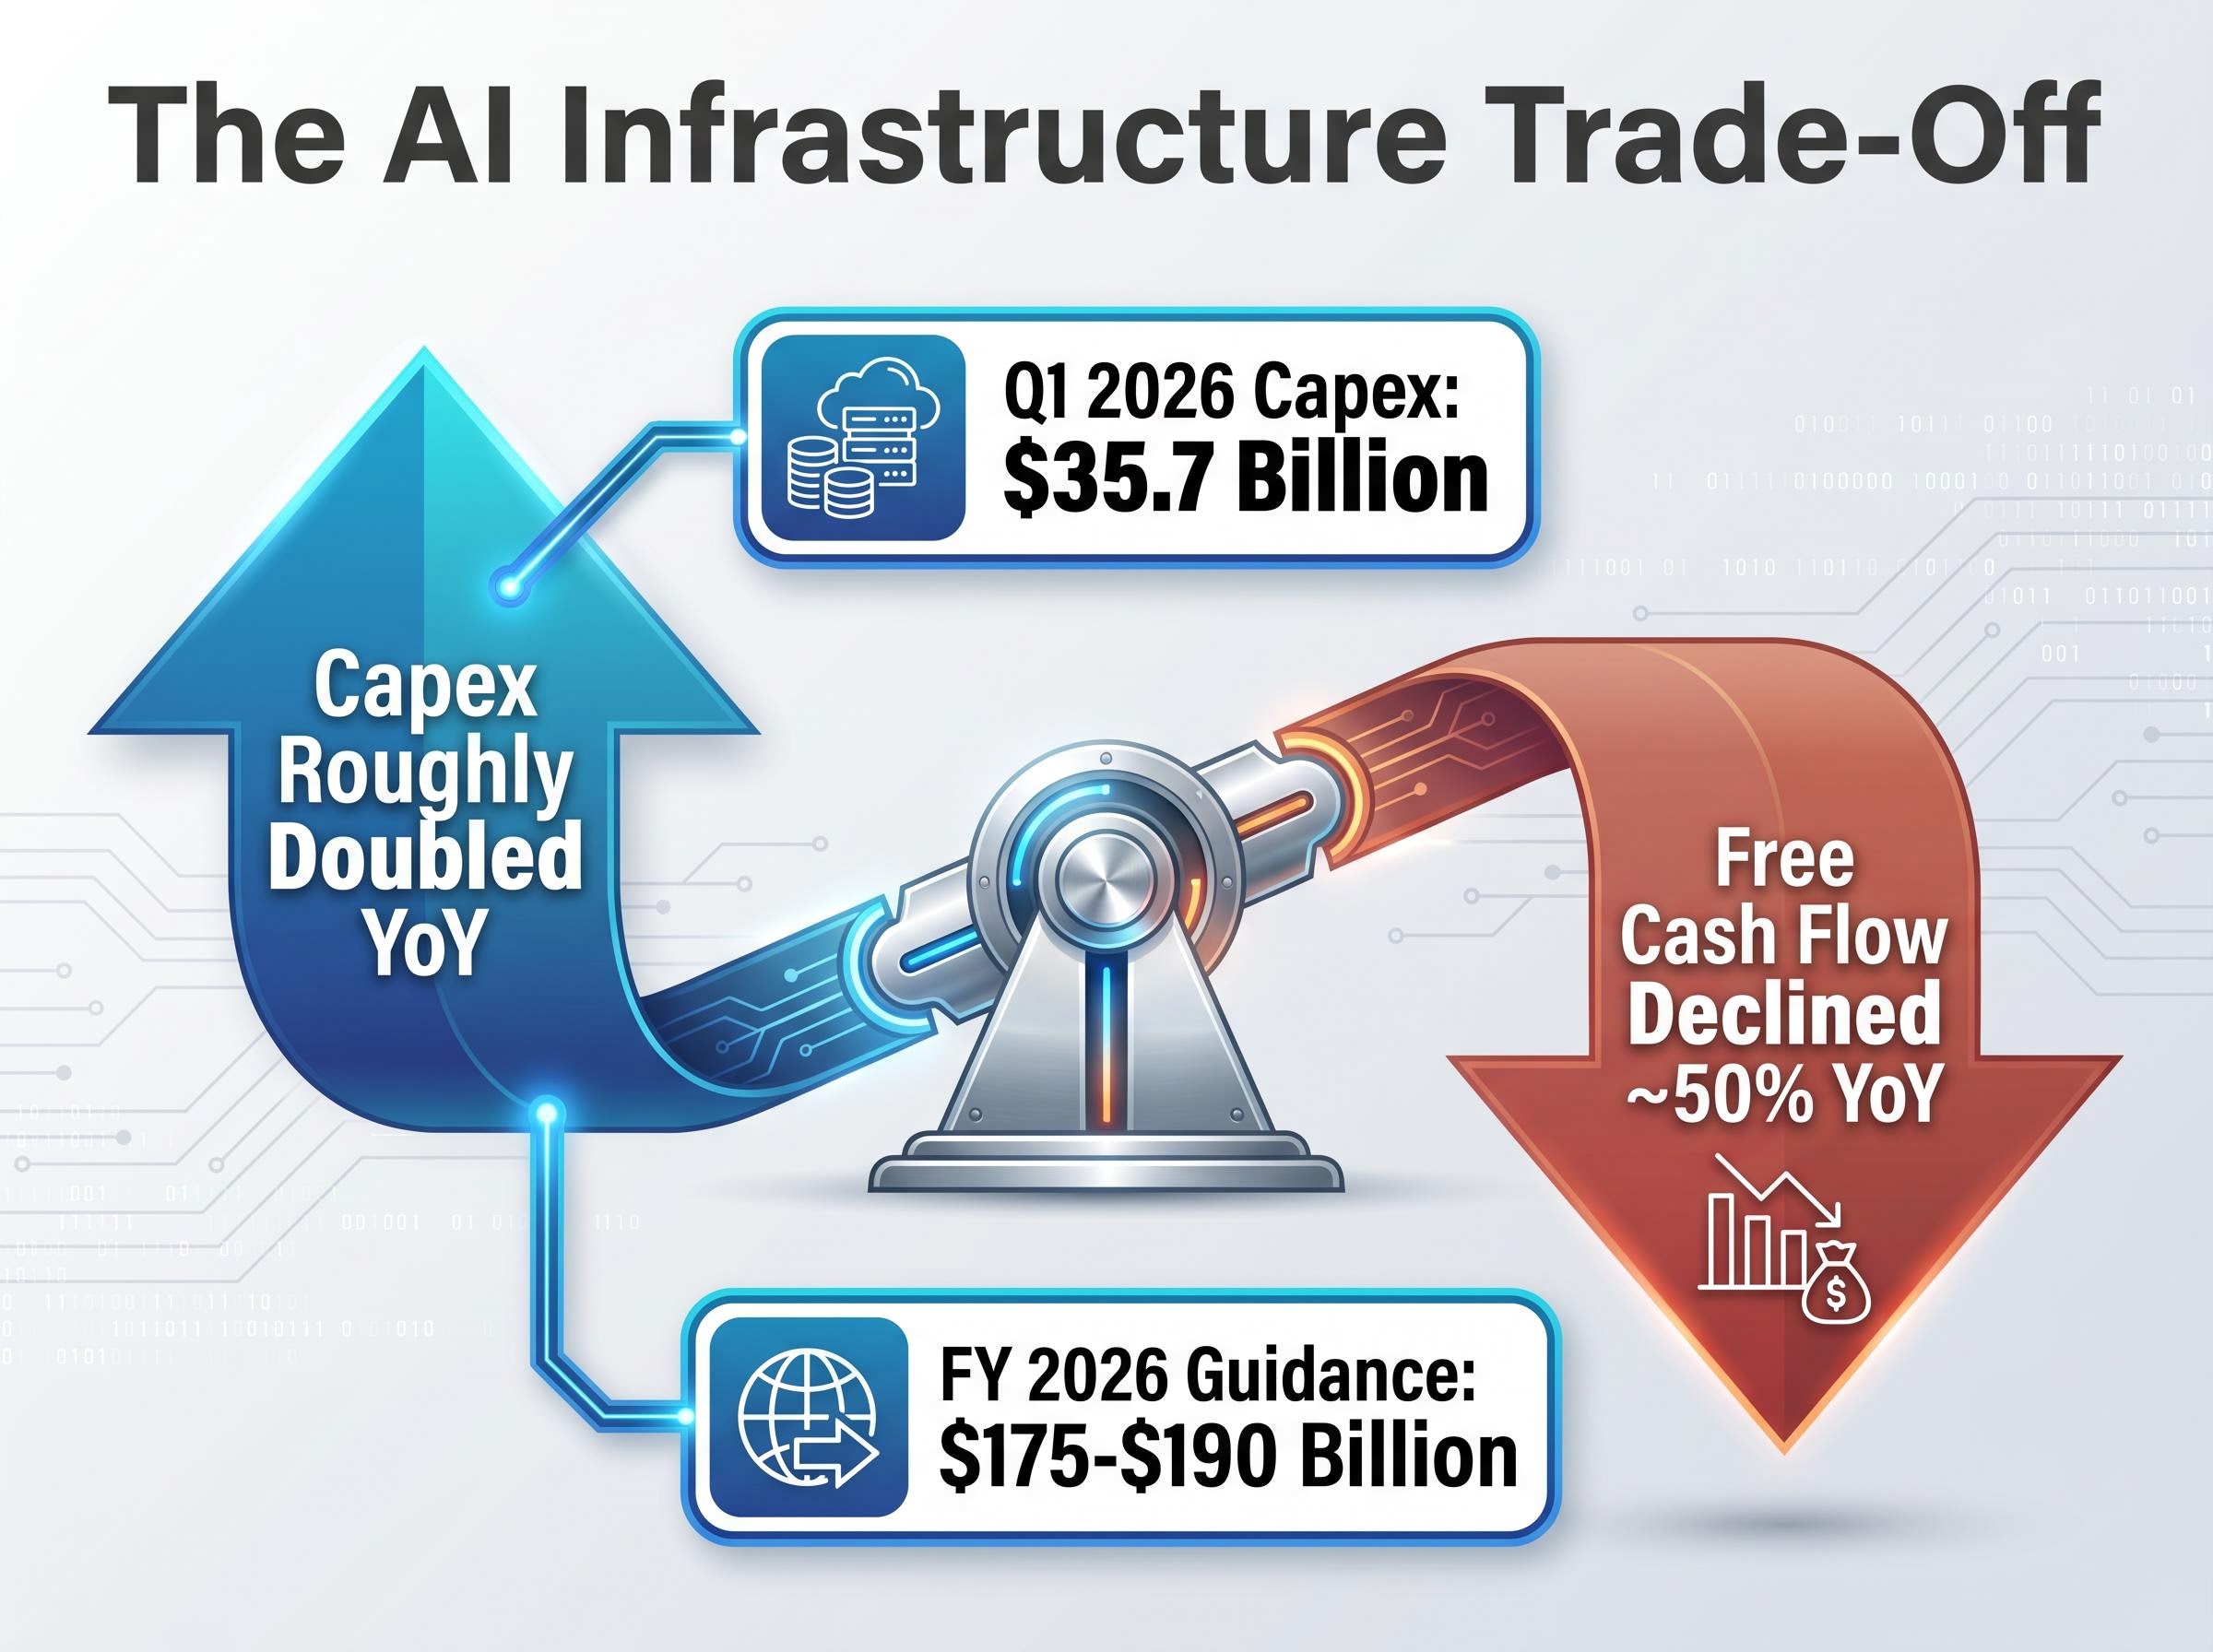
Full-year 2026 capex guidance: $175-$190 billion. Alphabet has raised the bar for AI infrastructure spending, signalling sustained heavy investment in data centres, custom silicon, and cloud capacity.
The direct consequence for shareholders is visible in free cash flow, which declined approximately 50% year-over-year as capex roughly doubled. That compression reduces near-term capacity for buybacks and dividends. The shareholder calculus is explicit: current investors are accepting compressed near-term returns in exchange for a bet that AI infrastructure investment generates disproportionate future cash generation.
This is not a company returning maximum capital to shareholders today. It is a company asking shareholders to fund an infrastructure build-out and wait for the payoff. The $460 billion backlog and 24-month conversion window are the nearest-term evidence that the payoff may materialise, but the gap between current outflows and future cash generation remains the central tension in the investment case.
The combined hyperscaler capex trajectory across Amazon, Microsoft, Alphabet, and Meta is projected at $725 billion for full-year 2026, with a $1 trillion annual run rate targeted for 2027, a scale that has prompted hyperscalers to issue approximately $121 billion in debt in 2025 alone and raises structural questions about whether returns will materialise at a pace that justifies the collective commitment.
Where Google Cloud sits in the competitive landscape, and what the growth rate reveals
The market share numbers tell one story. The growth rate tells another.
| Provider | Market Share | Notable Dynamic |
|---|---|---|
| AWS | ~32-33% | Incumbent leader; defending share in AI transition |
| Microsoft Azure | ~21-23% | OpenAI partnership driving enterprise AI adoption |
| Google Cloud | ~12-14% | 63% YoY growth; fastest share gains among top three |
According to Synergy Research, Google Cloud holds approximately 12-14% of the global cloud infrastructure market. That places it a distant third behind AWS and Azure. Read in isolation, the share figure suggests a follower.
The growth rate complicates that reading. At 63% year-over-year, Google Cloud is expanding materially faster than the broader market. A company growing at that pace from a 12% share base, in a market where share gains compound, is a different investment proposition than its current position implies.
Reading the hyperscaler earnings signals from Q1 2026 alongside Alphabet’s results adds important context: AWS posted a 93% year-over-year surge in backlog to approximately $364 billion while Goldman Sachs flagged that a material portion of Big Tech’s reported profit growth was driven by mark-to-market equity gains rather than core cloud operations, complicating like-for-like comparisons across the sector.
Antitrust remedies and the advertising risk that makes cloud matter more
The competitive picture cannot be assessed without the regulatory context. In September 2025, Judge Amit Mehta imposed behavioural remedies in the US Department of Justice antitrust case targeting Google’s search distribution agreements. The ruling banned exclusive distribution contracts, the agreements with Apple, wireless carriers, and browser makers that made Google the default search engine.
The DOJ antitrust remedies against Google, published by the Department of Justice in September 2025, confirmed the prohibition on exclusive search distribution contracts and mandated competitor data access, establishing the specific constraints that now apply to Google’s default search agreements with Apple, wireless carriers, and browser makers.
A second case, targeting Google’s control of the digital advertising stack, remains pending with remedies yet to be determined. Both cases carry appeal timelines extending into 2026-2027, creating extended uncertainty rather than a single resolution event.
The precise mechanics of how antitrust remedies on Search revenue interact with Google’s advertising margin structure matter more than the headline ruling: the ad-tech case carries the structurally deeper threat, with Judge Brinkema signalling openness to forcing a divestiture of DoubleClick for Publishers and the ad exchange, which would remove the closed-loop integration that underpins Google’s advertising margin quality.
Google Services still contributes approximately 45% operating margins, dwarfing cloud’s current profit contribution in absolute dollar terms. But the regulatory overhang on advertising revenue makes the diversification Google Cloud provides more valuable to the investment case, not less.
Bull, base, and bear: the return scenarios investors need to stress-test
At a stock price of approximately $397-$401 (GOOGL/GOOG), a market capitalisation of approximately $4.8 trillion, and a forward price-to-earnings ratio of 27-29x, Alphabet is priced for continued exceptional execution.
Forward P/E: 27-29x. With price-to-sales at a decade high and five-year stock appreciation exceeding 250%, the valuation reflects both the cloud acceleration and the assumption that Search remains resilient.
The analyst consensus stands at approximately 49 Buy ratings and 5 Hold ratings, a “Moderate Buy” that reflects broad institutional confidence tempered by the capex and regulatory variables. The return math varies significantly by scenario.
| Scenario | Key Assumption | Implied Upside/Downside | Key Risk |
|---|---|---|---|
| Bull | Cloud compounds at elevated rates; Search holds share; operating leverage across both segments | ~100% upside (implied ~$8-10T market cap) | Capex fails to convert to cash generation at scale |
| Base | Adequate execution; margins expand but growth normalises | Sideways with ~30% interim volatility | Multiple compression if growth decelerates |
| Bear | Search share erodes; adverse antitrust remedies; cloud growth slows | ~50% drawdown | Advertising revenue decline accelerates regulatory-driven losses |
Google Services still operates at approximately 45% operating margins, dominating Alphabet’s profit pool in absolute terms. Cloud’s 32.9% margin is rapidly closing the gap, but the advertising segment remains the earnings anchor. Investors evaluating the stock at current levels are underwriting a company where the margin of safety is thin but the earnings trajectory, if sustained, supports the premium.
Past performance does not guarantee future results. Financial projections are subject to market conditions and various risk factors.
The dual-engine bet and what investors are actually underwriting
Search and Cloud are both growing and both expanding margins. They also carry different risk profiles. Search faces regulatory pressure from two active antitrust proceedings. Cloud faces execution risk on a $175-$190 billion annual capex programme. Investors holding GOOGL hold both simultaneously.
Framing Alphabet as a vertically integrated AI operator rather than a search company with a cloud division changes the valuation inputs materially: exposure runs from foundational research and proprietary TPU chip design through cloud infrastructure and consumer deployment to long-horizon optionality in Waymo and Quantum AI, none of which are fully captured in a forward P/E derived from advertising earnings alone.
The investment thesis requires Alphabet to sustain cloud growth rates long enough to close the gap between current capex outflows and future cash generation at scale. The 24-month backlog conversion window is the nearer-term resolution point for that question.
Three conditions must hold for the thesis to play out:
- Cloud growth sustains: The 63% growth rate and $460 billion backlog must translate into durable revenue, not a one-cycle demand spike
- Search holds share: Despite the distribution contract ban and pending ad-tech remedy, advertising revenue must remain the dominant profit pool through the transition
- Capex converts to cash: The $175-$190 billion in annual infrastructure investment must generate returns that exceed the free cash flow it is currently consuming
The 63% cloud growth rate, the $460 billion backlog, and the 32.9% margin together represent the strongest single-quarter data point in favour of the thesis. Whether it can be repeated is the question every investor holding or considering Alphabet needs to answer.
This article is for informational purposes only and should not be considered financial advice. Investors should conduct their own research and consult with financial professionals before making investment decisions.