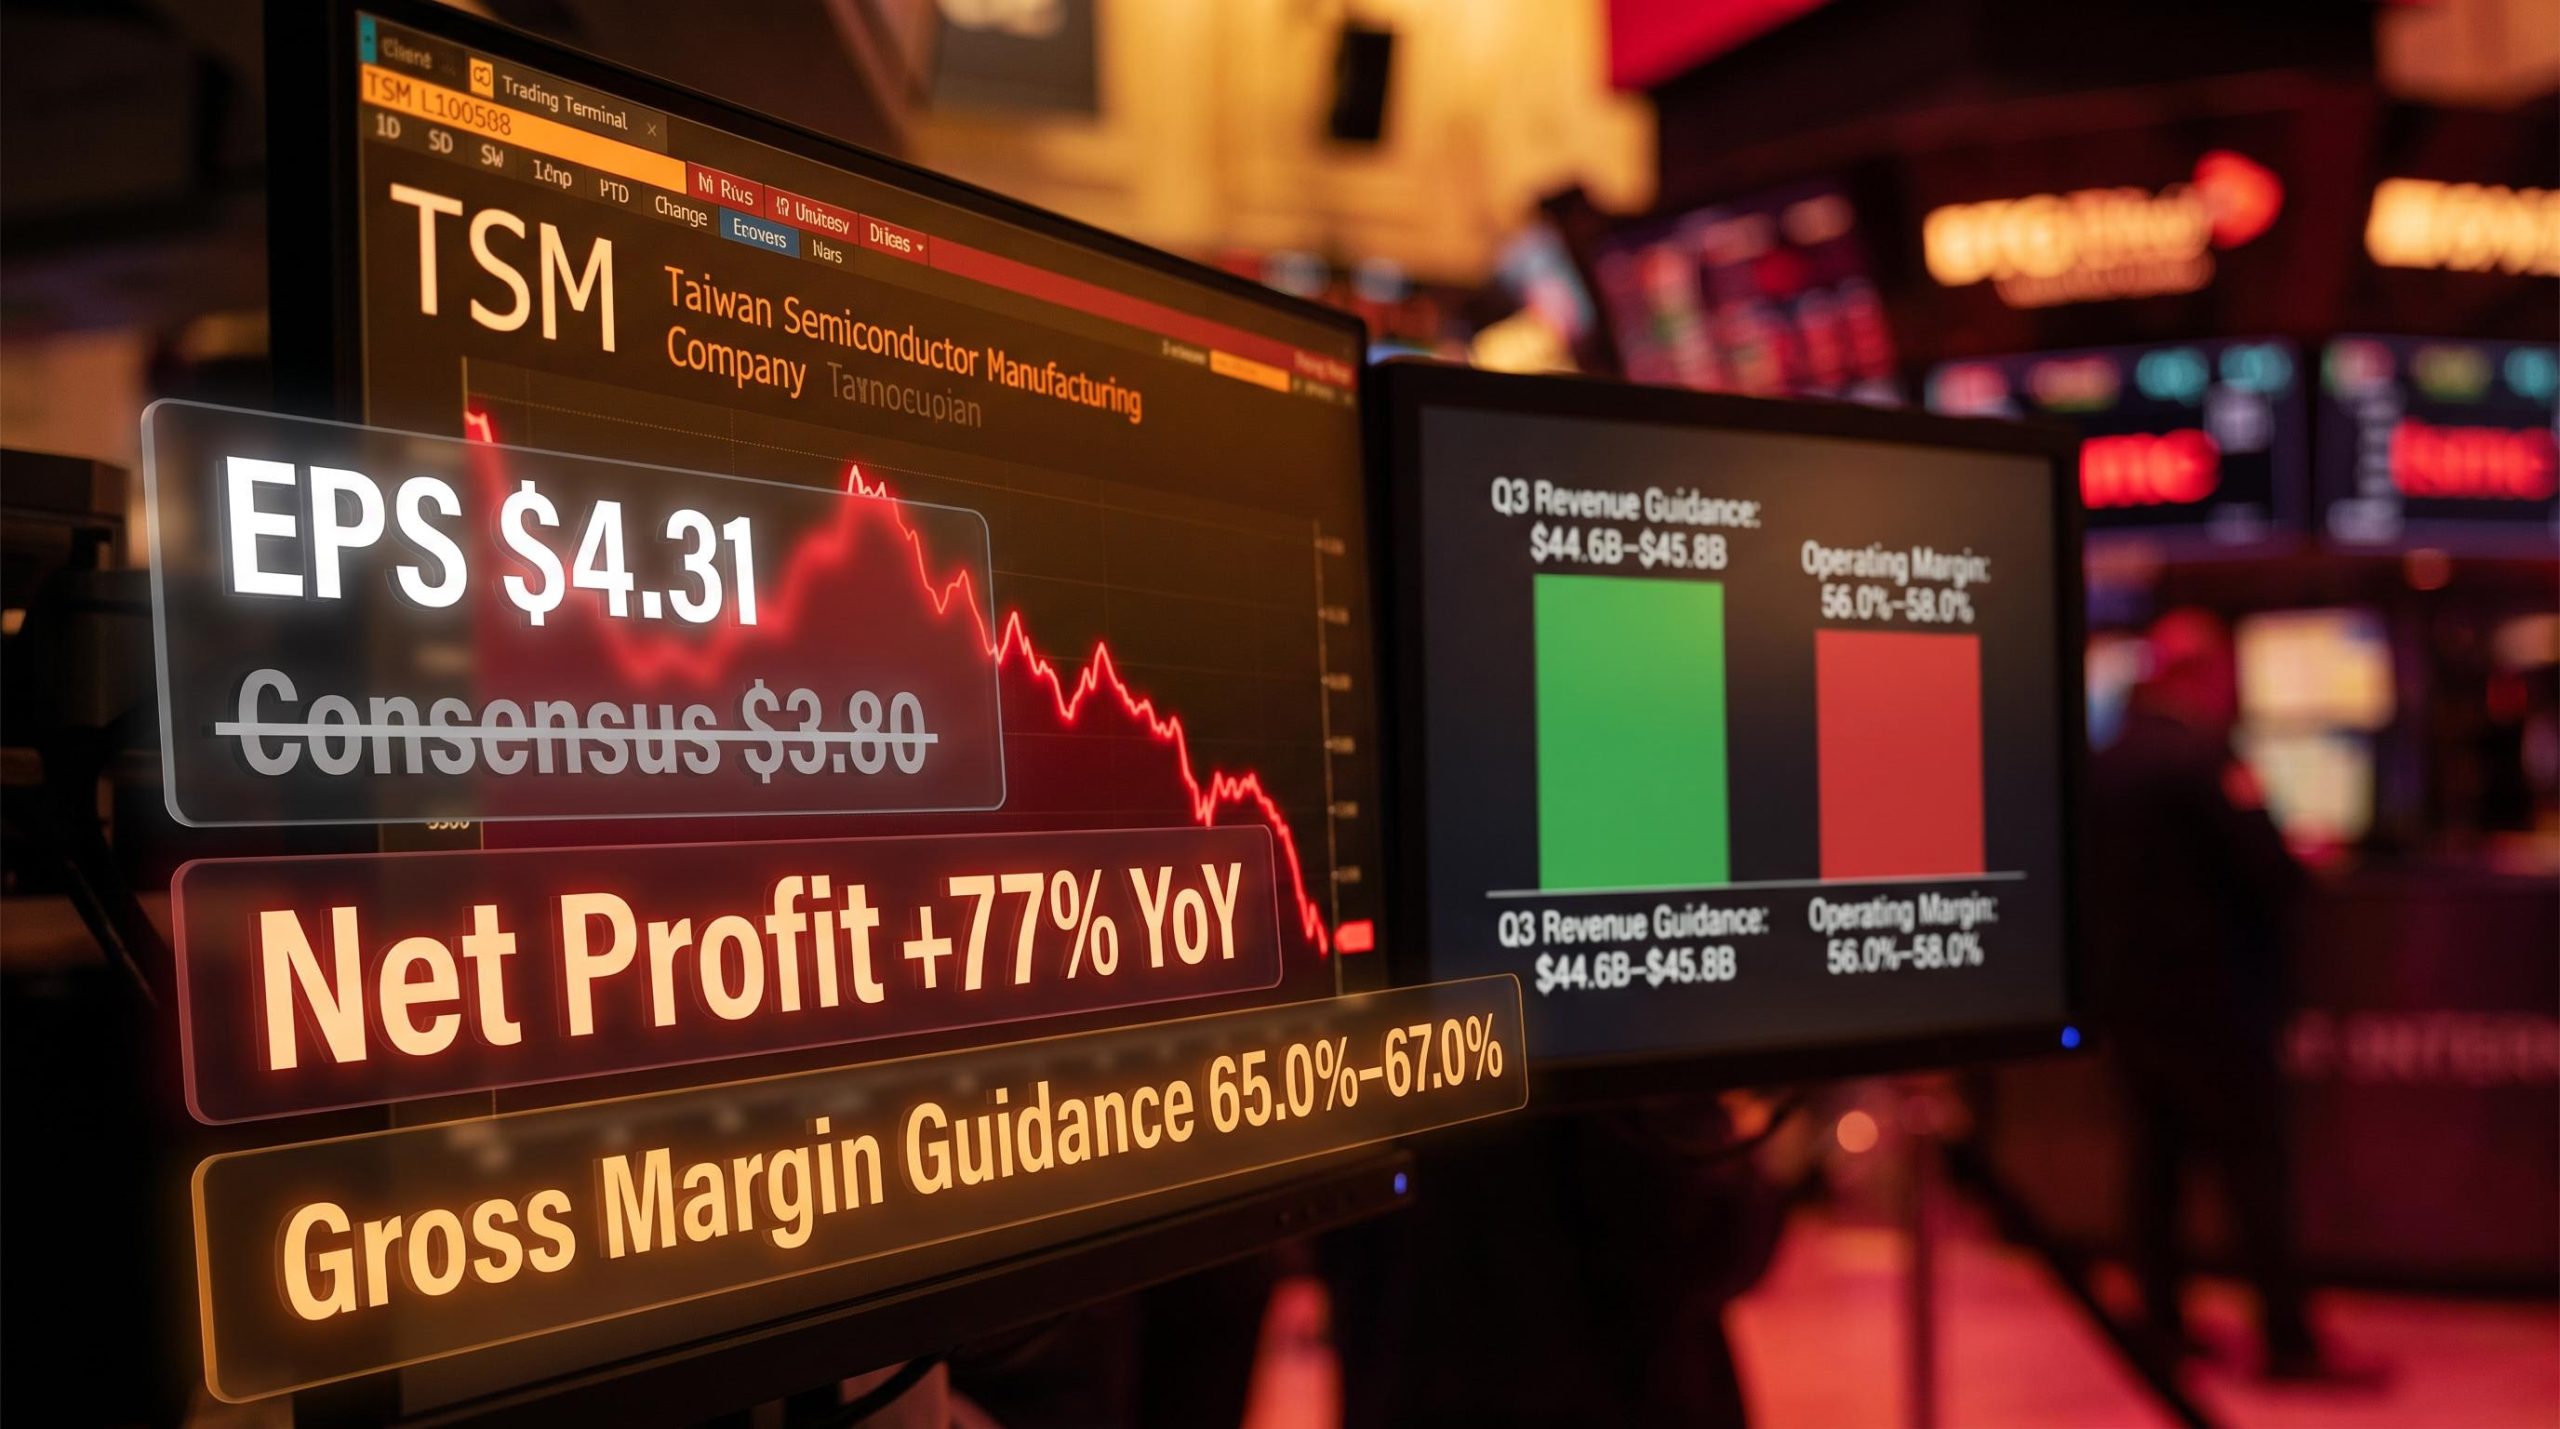
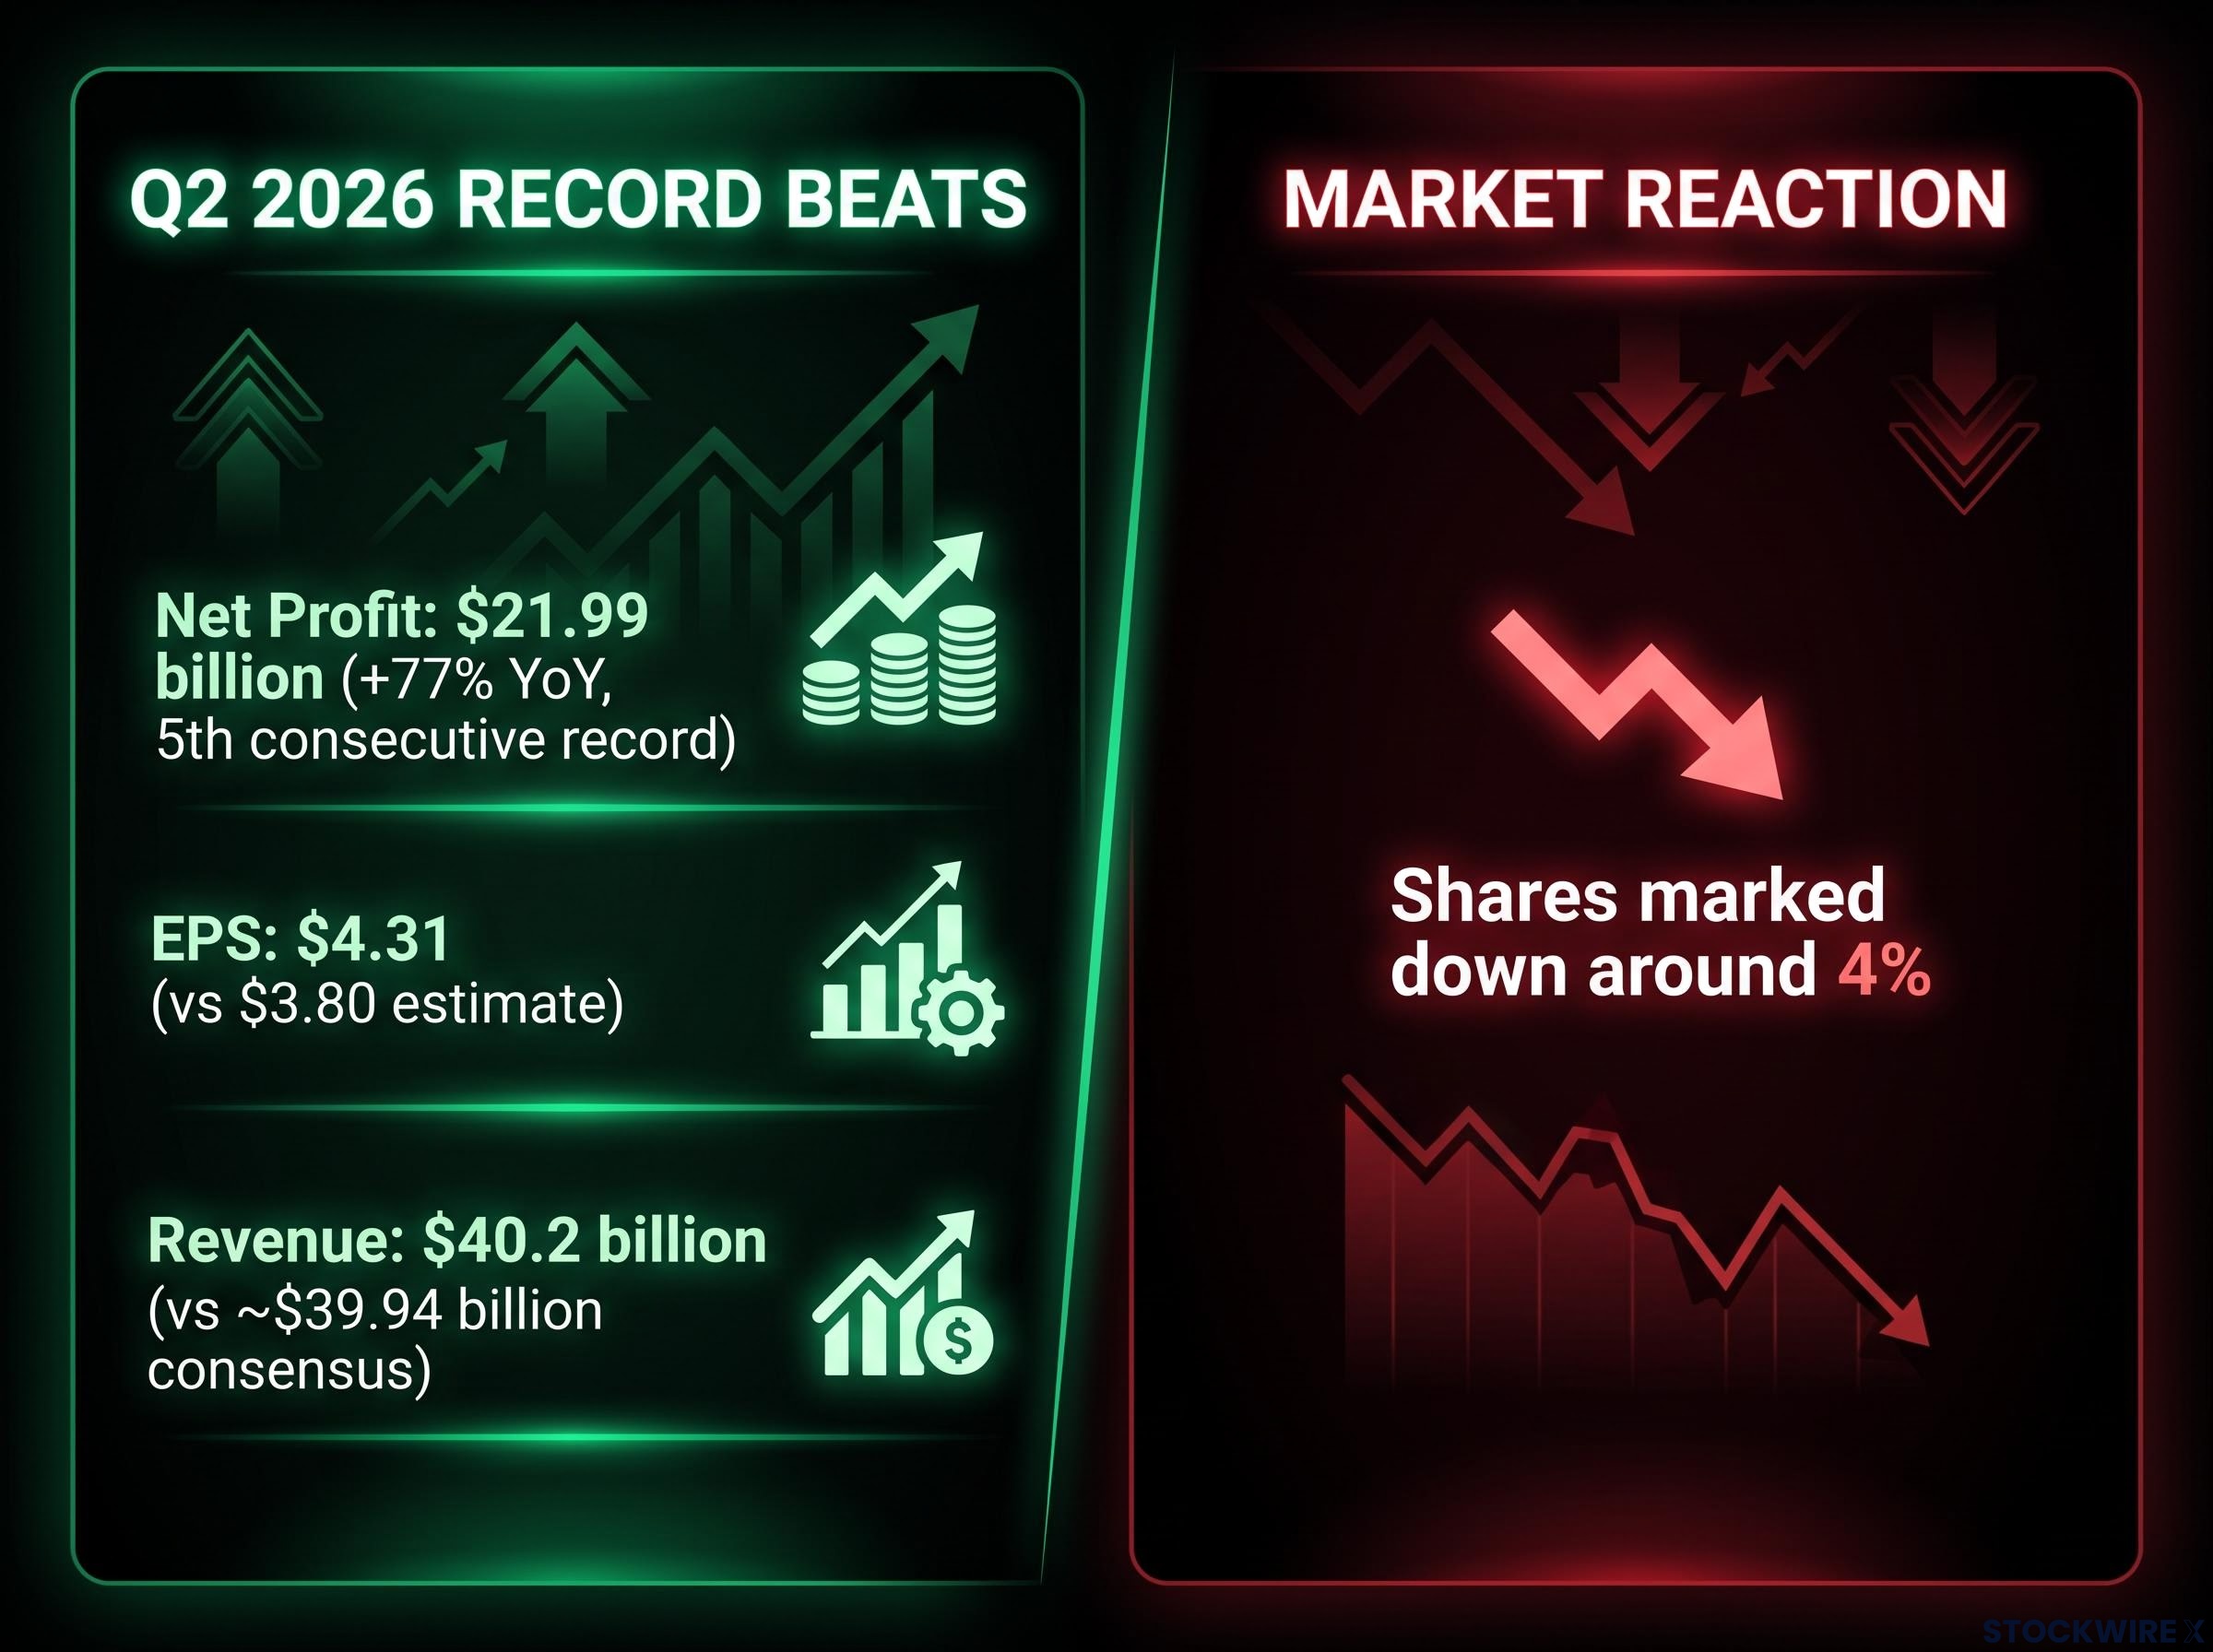
TSMC delivered Q2 2026 results that extended its winning streak to five record quarters in a row, with net income climbing 77% year on year and earnings per share of $4.31 clearing the $3.80 Wall Street estimate by a wide margin. The stock fell anyway.
The selloff was not irrational. It was a rational response to what management revealed about the road ahead. The numbers investors received on 16 July 2026 are backward-looking. What they sold on is forward-looking: the cost of an accelerating node ramp, a ballooning overseas build-out, and a valuation that leaves no room for any guidance that falls short of ideal.
Here is what actually drove the negative reaction, what the two specific cost pressures are that management flagged, and what that combination means for anyone evaluating TSM today, before acting on it.
Record profits, falling stock: what the headline numbers actually showed
The Q2 2026 scorecard was, by any conventional measure, emphatic. Every reported metric cleared the bar:
- Net profit: NT$706.56 billion (approximately $21.99 billion), reflecting a 77% year-on-year increase and a fifth straight all-time high
- Earnings per share: $4.31, comfortably ahead of the $3.80 figure analysts had pencilled in
- Revenue: $40.2 billion, topping both the company’s own guidance ceiling and the analyst consensus of roughly $39.94 billion
- Consecutive record quarters: Five in a row
| Metric | Reported Result | Analyst Consensus | vs Consensus |
|---|---|---|---|
| EPS | $4.31 | $3.80 | Beat by 13.4% |
| Revenue | $40.2B | ~$39.94B | Beat |
| Net Profit | $21.99B | — | Record (5th consecutive) |
Five consecutive records reflect sustained structural demand from AI and high-performance computing customers, not a one-off windfall. And yet, premarket trading saw the shares marked down around 4% on the day of the release. When a 77% profit surge beats every consensus line and still produces a lower stock price, the explanation is specific: forward-looking guidance carried more weight than the backward-looking print. The market’s attention was not on what TSMC had just earned but on the cost structure that will govern what it earns next.
The pre-earnings revenue confirmation published ahead of the 16 July call had already established top-line momentum, with June 2026 monthly revenue surging nearly 68% year-over-year to NT$442.68 billion, the strongest month of the quarter.
When big ASX news breaks, our subscribers know first
What spooked investors: the margin and guidance story
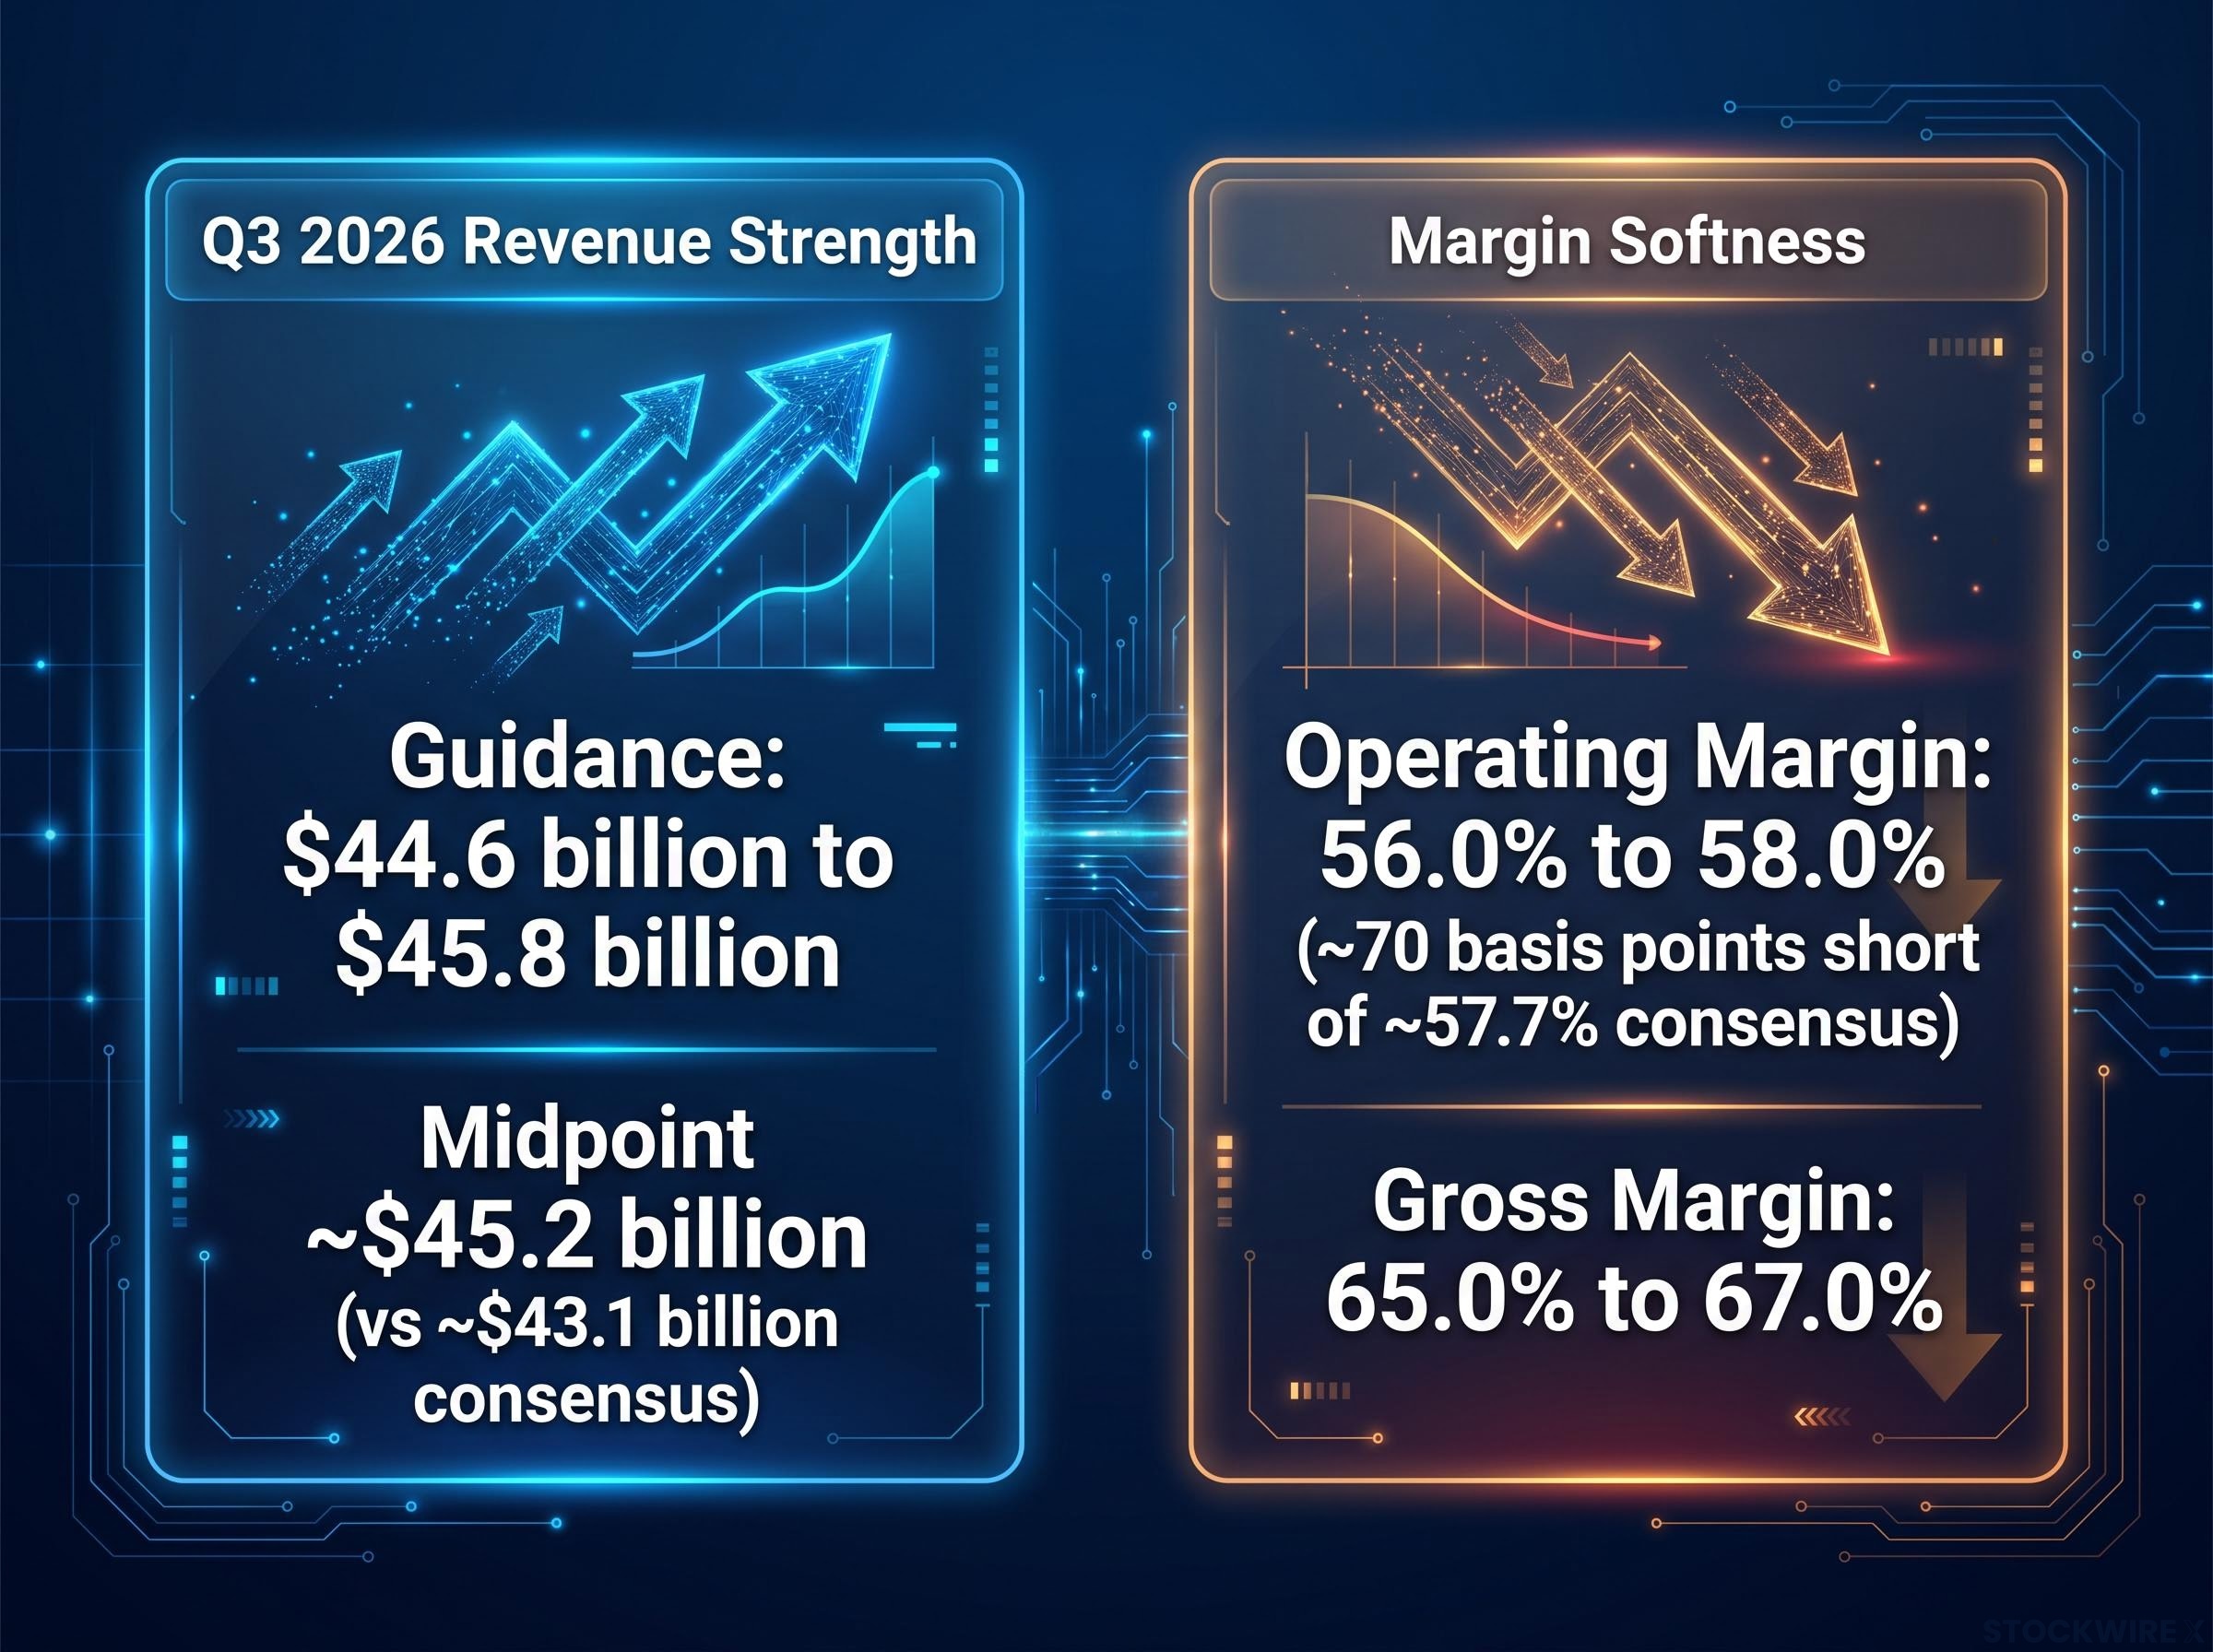
Start with the positive. Q3 2026 revenue guidance came in at $44.6 billion to $45.8 billion, with a midpoint of approximately $45.2 billion. That is roughly 5% above the Street consensus of approximately $43.1 billion. Demand, particularly from AI and data-centre customers, remains strong enough to clear a high bar.
Then the margin numbers arrived.
| Q3 2026 Guidance | Company Range | Analyst Consensus | vs Consensus |
|---|---|---|---|
| Revenue | $44.6B–$45.8B | ~$43.1B | ~5% above |
| Operating Margin | 56.0%–58.0% | ~57.7% | ~70bps below |
| Gross Margin | 65.0%–67.0% | — | See H2 2026 warning |
The operating margin guidance range of 56.0% to 58.0% put the midpoint around 70 basis points short of where analysts had forecast it. That shortfall is where the selloff lives. Revenue strength paired with margin softness is not a neutral outcome; it tells you TSMC is generating more top-line dollars but keeping less of each one.
Margin trend analysis is frequently the most revealing layer of any earnings report; a company can manufacture an EPS beat through cost cuts or one-time items while its underlying margin trajectory signals a deteriorating business mix that the headline number obscures.
Why the margin gap matters more than the revenue beat
Management also signalled that gross margins across the second half of 2026 are set to come in below the levels recorded in the first half of the year.
Management warning: Gross margins in H2 2026 are expected to decline relative to H1 2026 levels, reflecting the cost structure of ramping new process technology and expanding overseas fabrication capacity.
That compression is set to deepen, not stabilise, over the next two quarters. For a stock priced for perfection, a revenue beat cannot offset a deteriorating margin trajectory. The market processed both signals together and sold accordingly.
The two cost pressures behind the margin squeeze
The margin compression story is not one undifferentiated problem. It is two distinct forces converging simultaneously, with a third uncertainty sitting alongside them:
- 2nm production ramp costs: The primary structural source of near-term margin dilution. Early-phase node transitions carry a predictable cost profile: lower yields, elevated learning-curve expenses, and revenue that takes time to catch up.
- Overseas fab expansion costs: A separate and compounding pressure, distinct from the node ramp itself. Building fabrication capacity outside Taiwan adds to the capital and operating cost base.
- Consumer-segment softness: Management pointed to pockets of underperformance in smartphones and consumer electronics more broadly, adding a demand-side question mark alongside the cost-side pressures.
The combined impact is material. N2 ramp costs together with overseas expansion are expected to dilute gross margins by approximately 2-3 percentage points for full-year 2026. For a company earning at TSMC’s scale, that represents billions in foregone profit during the ramp window. It is the explicit cost of staying at the leading edge of chip manufacturing.
Full-year 2026 revenue growth remains projected above 30% in dollar terms, and capital expenditure is tracking toward the top of the prior $52 billion to $56 billion guidance range. The topline momentum is intact. The question is how much of it flows through to the bottom line.
Why new node ramps always cost margin first
Leading-edge node transitions follow a structural pattern. When a chipmaker begins producing on a new process technology, yields (the percentage of usable chips per wafer) start low and improve over time as engineers optimise the manufacturing process. Early production runs are more expensive per unit because the cost base is front-loaded relative to revenue recognition. The revenue from the new node only catches up as yields improve and volume scales. This is expected, not exceptional; it is how every major node transition has worked across the semiconductor industry.
Why chip giants keep triggering ‘sell the news’ reactions
Pull back from the specific quarter and the pattern becomes visible. Q2 2026 was not the first time TSMC printed strong numbers and watched the stock fall. Q1 2026 produced the same dynamic: AI-driven revenue beats followed by declines driven by capex concerns, margin trajectory, and valuation.
The mechanism is straightforward. At elevated valuations, even strong results leave no room for the market to reward upside. Any forward-looking concern, whether it is margin compression, capex commitments, or consumer softness, triggers immediate selling. The bar is not “good.” The bar is “perfect.”
The “priced-for-perfection” dynamic: When a stock’s valuation already reflects exceptional growth, beating expectations merely confirms what the price already assumed. Missing on any forward metric, even marginally, gives investors a reason to take profit. This is why TSMC can maintain a revenue growth outlook above 30% and commit to capex at the top of the $52 billion to $56 billion range, and still see shares fall on earnings day.
Taiwan’s geopolitical risk premium adds another layer. It is a structural discount factor that recedes during calm periods but re-emerges during any moment of earnings ambiguity, amplifying the sell-the-news dynamic. The pattern tells you that TSMC’s stock is not currently rewarding backward-looking earnings strength, and understanding that dynamic is necessary before interpreting any single quarter’s move as a verdict on the company’s competitive position.
The geopolitical risk premium tied to Taiwan’s role in global semiconductor production is not a static discount; it compresses during periods of diplomatic calm and re-expands at moments of earnings ambiguity or bilateral tension, acting as an amplifier on whatever direction sentiment is already moving.
What the long-term thesis looks like from here
The long-term investment case, TSMC as the indispensable leading-edge foundry for Apple, NVIDIA, AMD, and others, is not what the market sold on. That structural position is not in dispute.
What is in dispute is the near-term earnings quality. The two variables that will determine whether the margin compression story is temporary or persistent are specific and trackable:
- Near-term (H2 2026): Does margin compression stay within management’s own guided range of 65.0% to 67.0% gross margin, or does it undershoot? Execution on the 2nm ramp during the next two quarters is the immediate test.
- Medium-term (2027 and beyond): How quickly do 2nm yields improve, and when does margin re-expansion begin? The yield curve on the new node will determine the recovery timeline.
- Long-term (multi-year cycle): The AI and high-performance computing demand cycle, with revenue growth maintained above 30%, underpins the structural case. This is intact but does not resolve near-term margin pressure.
An elevated valuation, explicit margin headwinds, and consumer softness create a higher bar for the stock to advance on earnings day, regardless of headline profit strength.
The two numbers to watch in the next two quarters
Two specific metrics will determine whether the current margin compression is tracking as expected or deteriorating beyond the ramp-cost thesis. First, 2nm yield improvement: progress here signals the ramp is maturing on schedule and cost-per-unit is falling. Second, gross margin trajectory against the Q3 floor of 65.0% to 67.0%: if subsequent quarters hold within or above this range, the compression is temporary. If they slip below it, the market will reprice the recovery timeline accordingly. Those are the two numbers to watch when Q3 2026 results land.
Reading the selloff correctly before making any move
The core distinction is worth stating plainly. This selloff is a statement about near-term earnings quality and risk distribution. It is not a verdict on TSMC’s competitive position or long-term earnings power. Separating those two things is where most individual investors go wrong with high-valuation growth stocks.
Q3 2026 results will provide the first concrete test. If gross margins land within the 65.0% to 67.0% guided range and 2nm yield commentary is constructive, the compression narrative stays within management’s own framework. If margins undershoot that floor, the conversation changes. Meanwhile, capital expenditure tracking toward the top of the $52 billion to $56 billion range remains the sustained cost overhang to monitor quarter by quarter.
The distinction that matters: TSMC’s stock fell on record profits because the market is pricing near-term margin risk, not questioning the company’s long-term competitive position. Those are two different assessments, and conflating them is the most common error when interpreting this kind of earnings move.
The reader who finishes this piece should be able to articulate, in one sentence, why TSMC’s stock fell on record profits. That clarity is the specific value here: it separates the signal from the noise before the next quarter arrives.
For readers who want a step-by-step framework for navigating this exact scenario, our dedicated guide to reading earnings reports when good news tanks stocks covers the four behavioural traps investors fall into at the moment of maximum emotional noise.
This article is for informational purposes only and should not be considered financial advice. Investors should conduct their own research and consult with financial professionals before making investment decisions. Past performance does not guarantee future results. Financial projections are subject to market conditions and various risk factors.