Netflix closed at $73.68 on 15 July 2026, sitting 32% below its April post-earnings peak and resting on a support cluster that has held for weeks. Tonight, Q2 earnings drop after the bell. The chart says oversold. The options market says expect a 6.6% move in either direction.
This is a pre-earnings technical decision moment. If you trade or hold NFLX on chart-based logic, the levels that matter need to be mapped before the catalyst hits, not after. This piece deliberately sets aside fundamental earnings metrics for most of its length and focuses on what the price structure, momentum indicators, and options volatility are communicating right now.
Here is the technical setup, the key levels to watch, and a clear scenario framework for each direction, so you can evaluate the trade on chart terms before tonight’s number drops.
Why the $71-$73 zone is the most important level on the chart
The support case for NFLX at current prices is not built on a single line. It is built on a cluster, and the convergence of evidence within that cluster is what gives it weight.
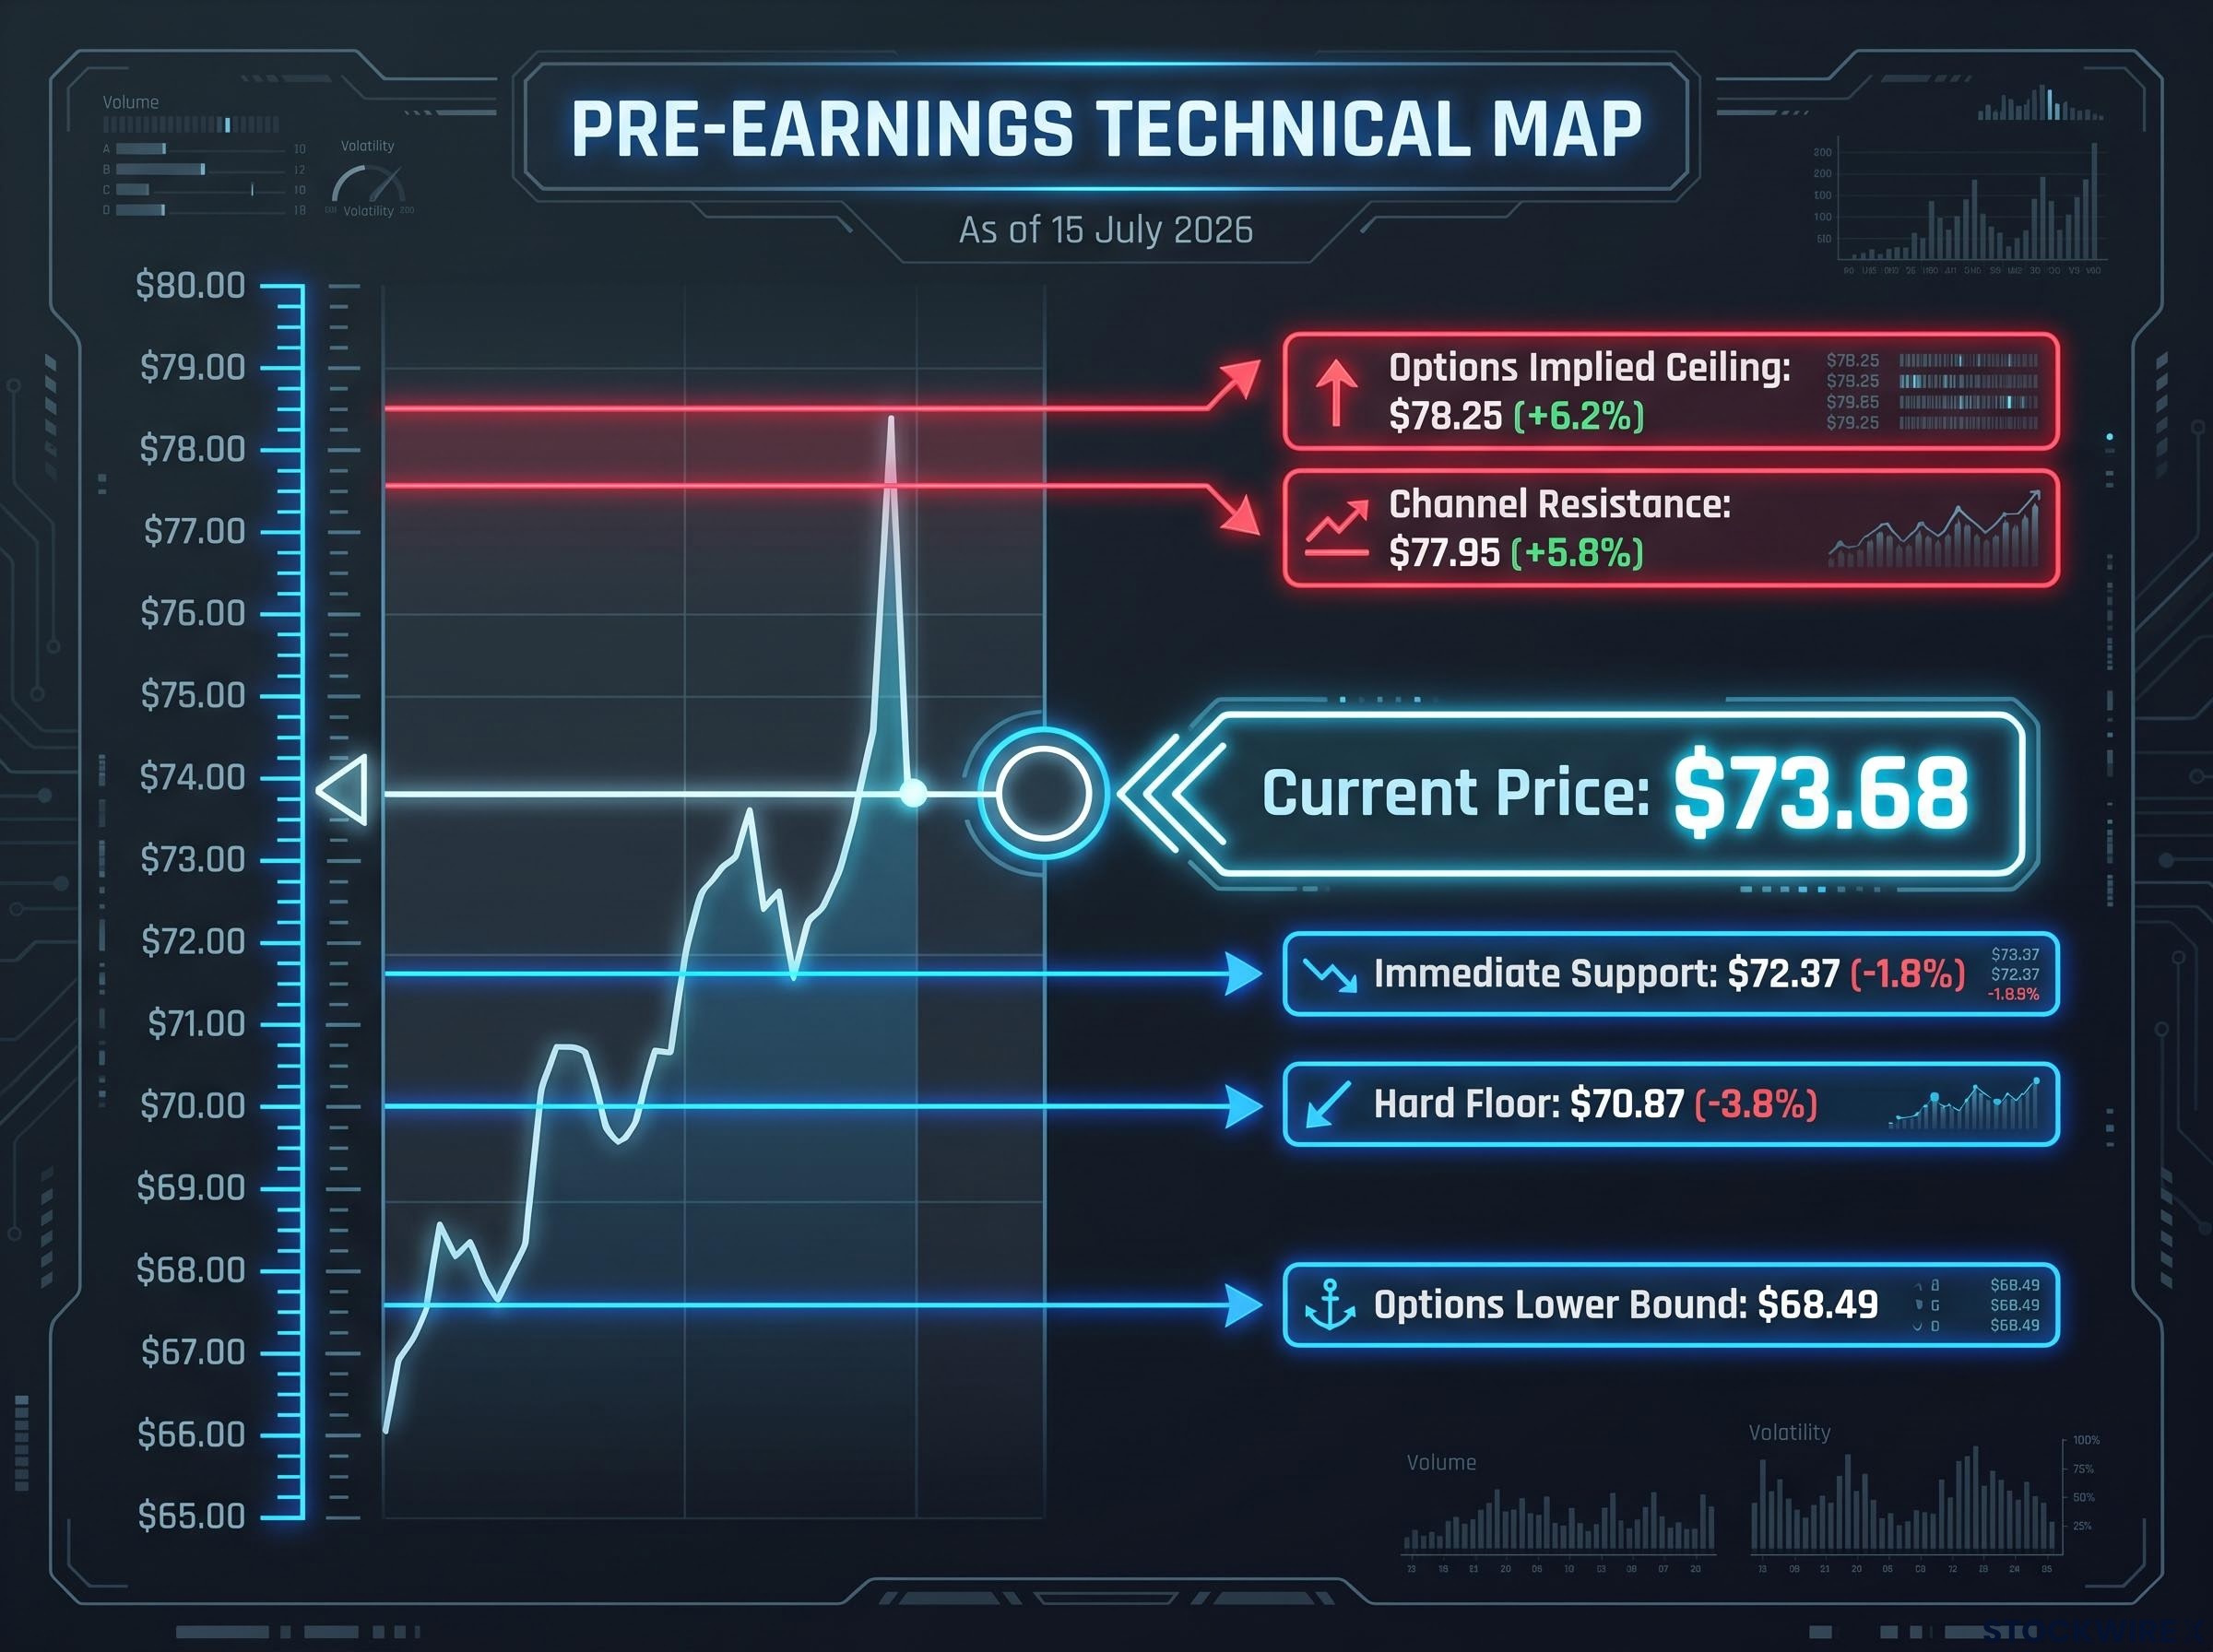
Start with where the stock has been trading. The 15 July session ranged from $72.28 to $74.01, meaning the stock is already compressing against the lower bound of its recent range. Widen the lens to the 52-week structure, $70.86 to $127.75, and the current price sits just 4% above the absolute floor of the past year. That is a multi-timeframe confluence, not a single arbitrary level.
Within that cluster, two specific prices carry different implications:
- Current price: $73.68 (15 July 2026 close)
- Immediate support: $72.37
- Hard structural floor: $70.87 (52-week low)
- Critical support cluster: $71-$73
- 52-week range: $70.86-$127.75
“The $72.37 and $70.87 levels are not the same risk. One is noise management; the other is a structural break.”
A dip to $72.37 is the stock testing the lower edge of its recent range. That is noise. A closing break below $70.87 is something different entirely: it tells chart-based traders the downtrend has entered new, technically uncharted territory with no visible structural demand beneath it.
When big ASX news breaks, our subscribers know first
Reading the descending channel and where resistance lives
NFLX has been falling within a clearly established downward-sloping channel that formed after the April peak. Both the floor and the ceiling of that channel carry analytical significance, but it is the ceiling that matters most for anyone watching a potential post-earnings bounce.
The upper channel boundary sits near $77.95-$78. That is approximately 5.9% above the current price, a move that aligns almost exactly with the options-implied expected range (more on that below). Short-term trader commentary references recovery targets in the high $70s to $80, bracketing this same zone as the tactical upside destination for a bounce setup.
What makes the $78 level technically interesting is the independent confirmation. The options market’s upper implied 7-day range sits at approximately $78.25. The fact that options pricing and channel structure converge on the same level tells you this is the ceiling the market itself is pricing as the limit for a post-earnings relief move. A closing break above $78 would not just be a bounce; it would be a potential channel exit signal worth watching closely.
Volume confirmation is the signal most likely to separate a genuine channel breakout above $78 from a low-conviction relief pop; a post-earnings surge that clears the upper boundary without volume of at least 1.5 times the 20-day average carries a materially higher risk of fading back into the channel within days.
| Level | Price | Distance from current | Signal type |
|---|---|---|---|
| Immediate support | $72.37 | -1.8% | Support |
| Hard floor | $70.87 | -3.8% | Structural break |
| Channel resistance | $77.95 | +5.8% | First resistance |
| Options implied ceiling | $78.25 | +6.2% | Options confirmation |
Without this channel context, traders risk misreading a stall at $78 as failure when it may simply be the stock meeting its structural ceiling.
What the MACD crossover and RSI readings are actually telling you
A MACD crossover, where the MACD line crosses above its signal line and the histogram begins printing positive bars, is one of the most commonly cited momentum signals in technical analysis. MACD stands for Moving Average Convergence Divergence, a momentum indicator that tracks the relationship between two moving averages of a stock’s price. When the crossover appears, it means the gap between those averages is narrowing, which suggests selling pressure is losing intensity.
NFLX is flashing that crossover right now, alongside two other converging signals:
- MACD bullish crossover: The MACD line has moved above the signal line and the histogram is now producing positive bars, pointing to a loss of momentum in the recent selling.
- RSI approaching oversold: The Relative Strength Index, which measures whether a stock has been bought or sold too aggressively over a recent period, is nearing oversold territory on key timeframes.
- 200 EMA on the weekly chart: Price is approaching the 200-period exponential moving average on the weekly timeframe, a level that longer-term traders watch as a potential zone of mean reversion.
The distinction between decelerating selling and confirmed reversal
Here is what those signals do not tell you: they do not confirm a reversal. In a 32% downtrend, a MACD crossover means the worst of the selling pressure may be decelerating. “May be” is the operative phrase. These indicators register momentum stabilisation, not trend change, and the distinction matters enormously before a binary catalyst event.
Tonight’s earnings release can override any pre-event technical signal in a matter of minutes. An earnings-driven gap, in either direction, can blow through readings that took weeks to develop. That makes position sizing the more important variable heading into the close than the momentum signal itself.
How the options market is pricing tonight’s earnings move
The options market is not predicting which way NFLX moves tonight. It is telling you how far.
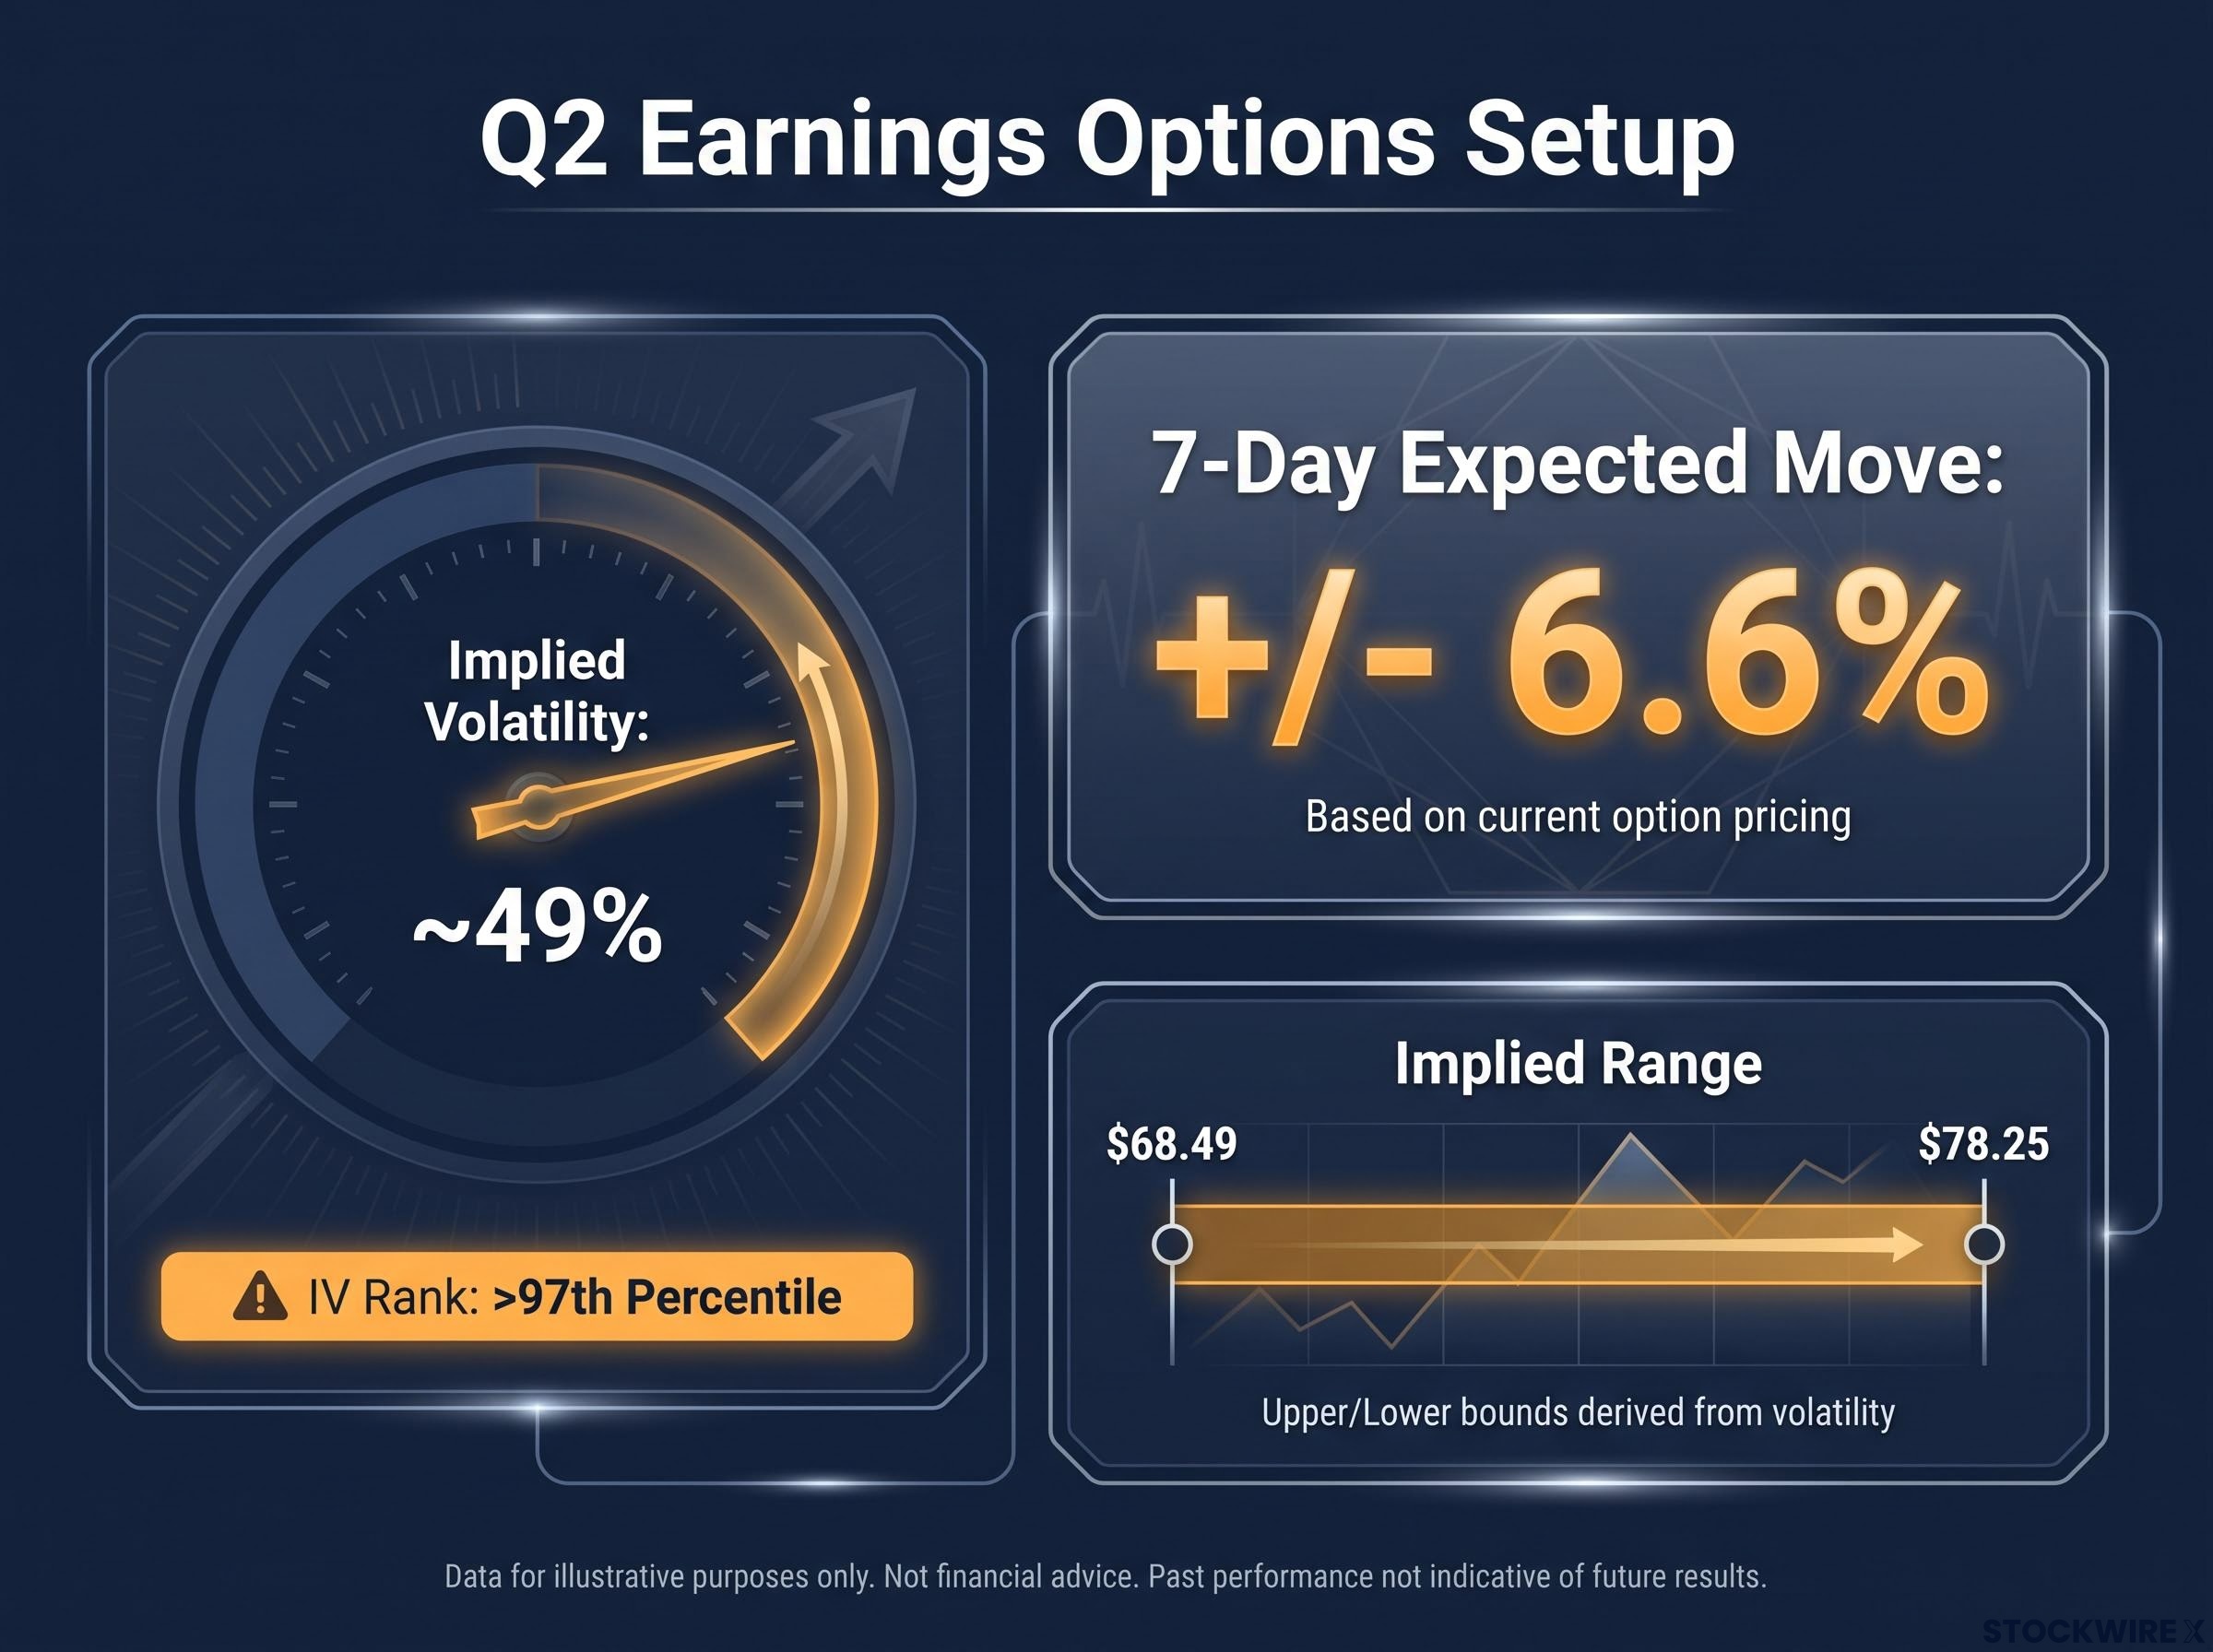
Implied volatility (IV), which measures how much movement options traders are pricing into a stock over a given period, sits at approximately 49%. More telling is the IV rank: above the 97th percentile of historical readings. That means the market is pricing in more uncertainty about this earnings release than it has for virtually any prior period on record.
Implied volatility signals from the options market measure expected magnitude, not direction, and comparing current IV against a stock’s historical average provides the clearest objective lens for identifying whether the market is overpricing or underpricing event risk before a binary catalyst.
“An IV rank above 97 means the market is pricing in more uncertainty than it has for more than 97% of all prior periods.”
Priced into the options market is a 7-day expected move of roughly 6.6%, placing the implied range between $68.49 and $78.25. Laying those bounds against the chart structure already discussed sharpens the picture considerably. The upper boundary ($78.25) aligns with descending channel resistance, while the lower boundary ($68.49) falls beneath the $70.87 52-week low, indicating that the options market is actively pricing in the possibility that key structural support gives way.
| Scenario | Trigger | Technical target |
|---|---|---|
| Recovery / Base case | “Not worse than feared” earnings; Q2 meets conservative guidance | $78 channel resistance (5.9% upside) |
| Bear case | Deterioration in guidance or subscriber metrics | Close below $70.87; unstructured downside below $68.49 |
| Extended move | Significant earnings gap (common at elevated IV) | Either direction, potentially overshooting channel levels |
At an IV rank above 97, anyone expressing a directional view should be treating position sizing as the primary risk control, not the chart setup alone. Both extremes are live scenarios, and the options market is pricing them as roughly equally plausible.
The next major ASX story will hit our subscribers first
The fundamental floor beneath the technical setup
The $71-$73 support zone is not only a technical artifact. It also coincides with a zone where fundamental buyers are likely stepping in, which helps explain why the level has held with real force rather than drifting through uncontested.
Netflix’s full-year 2026 financial targets, confirmed in the Q1 shareholder letter and left unchanged despite near-term pressure, paint the picture:
- FY2026 revenue guidance: $50.7 billion to $51.7 billion
- FY2026 operating margin target: 31.5%
- FY2026 free cash flow guidance: $12.5 billion (raised)
- Advertising tier 2026 revenue target: $3 billion (doubling year-over-year)
At $73.68, NFLX trades at approximately a 35-42% discount to the Street’s average 12-month price target (consensus near $112-$113, with a Moderate Buy rating, though these figures have not been independently verified).
“At $73.68, NFLX trades at a 35-42% discount to the Street’s average 12-month price target, meaning the technical demand zone coincides with a zone of perceived fundamental undervaluation.”
Morningstar highlights Netflix’s massive customer base and level of profitability as competitive advantages supporting the longer-term case. The advertising-supported tier’s $3 billion revenue target, representing a doubling year-over-year, is the structural growth catalyst that value-oriented buyers are likely weighing at this price level. The convergence of a credible fundamental case with a technically oversold chart is precisely the condition that attracts longer-term buyers into an earnings-driven dip.
The expectations gap is the mechanism that determines whether a technically oversold chart recovers or continues lower after an earnings release; a result that clears a depressed consensus can produce a sharp technical bounce even when the absolute numbers look uninspiring in isolation.
What the chart setup actually tells you before tonight’s number drops
The technical picture condenses into three pre-defined levels that remove the need for a real-time emotional decision when the number hits tonight:
- Recovery toward $78: If earnings come in “not worse than feared,” the oversold momentum readings and channel structure position the stock for a technical move toward $77.95-$78 channel resistance. That is where you reassess, not where you assume a trend change.
- Hold at $72.37 without signal: If the stock dips into the immediate support zone but holds above $70.87 on a closing basis, the support cluster remains intact. No action signal, just continued monitoring.
- Close below $70.87: A closing break below the 52-week low is the clean bearish confirmation. It signals to chart-based traders that the downtrend has entered unstructured territory, and the next implied level sits near the options lower bound at $68.49.
The IV rank above 97 governs all of this. The chart provides context; tonight’s earnings release is the dominant force.
Position sizing matters more than chart conviction at IV rank above 97
At this volatility extreme, chart levels are guideposts, not guarantees. Sizing the position to survive a gap-down through $70.87 is a more defensible choice than relying on the level to hold. Pre-defined levels and disciplined sizing are what convert a technical framework into a risk management tool.
For investors wanting a structured framework for what to do after tonight’s number lands, our dedicated guide to post-earnings hold and trim decisions covers conditional decision rules, analyst revision timing, and the after-tax cost of acting within 24 hours of a catalyst.
This article is for informational purposes only and should not be considered financial advice. Investors should conduct their own research and consult with financial professionals before making investment decisions. Past performance does not guarantee future results. These forward-looking scenarios are speculative and subject to change based on market developments and company performance.