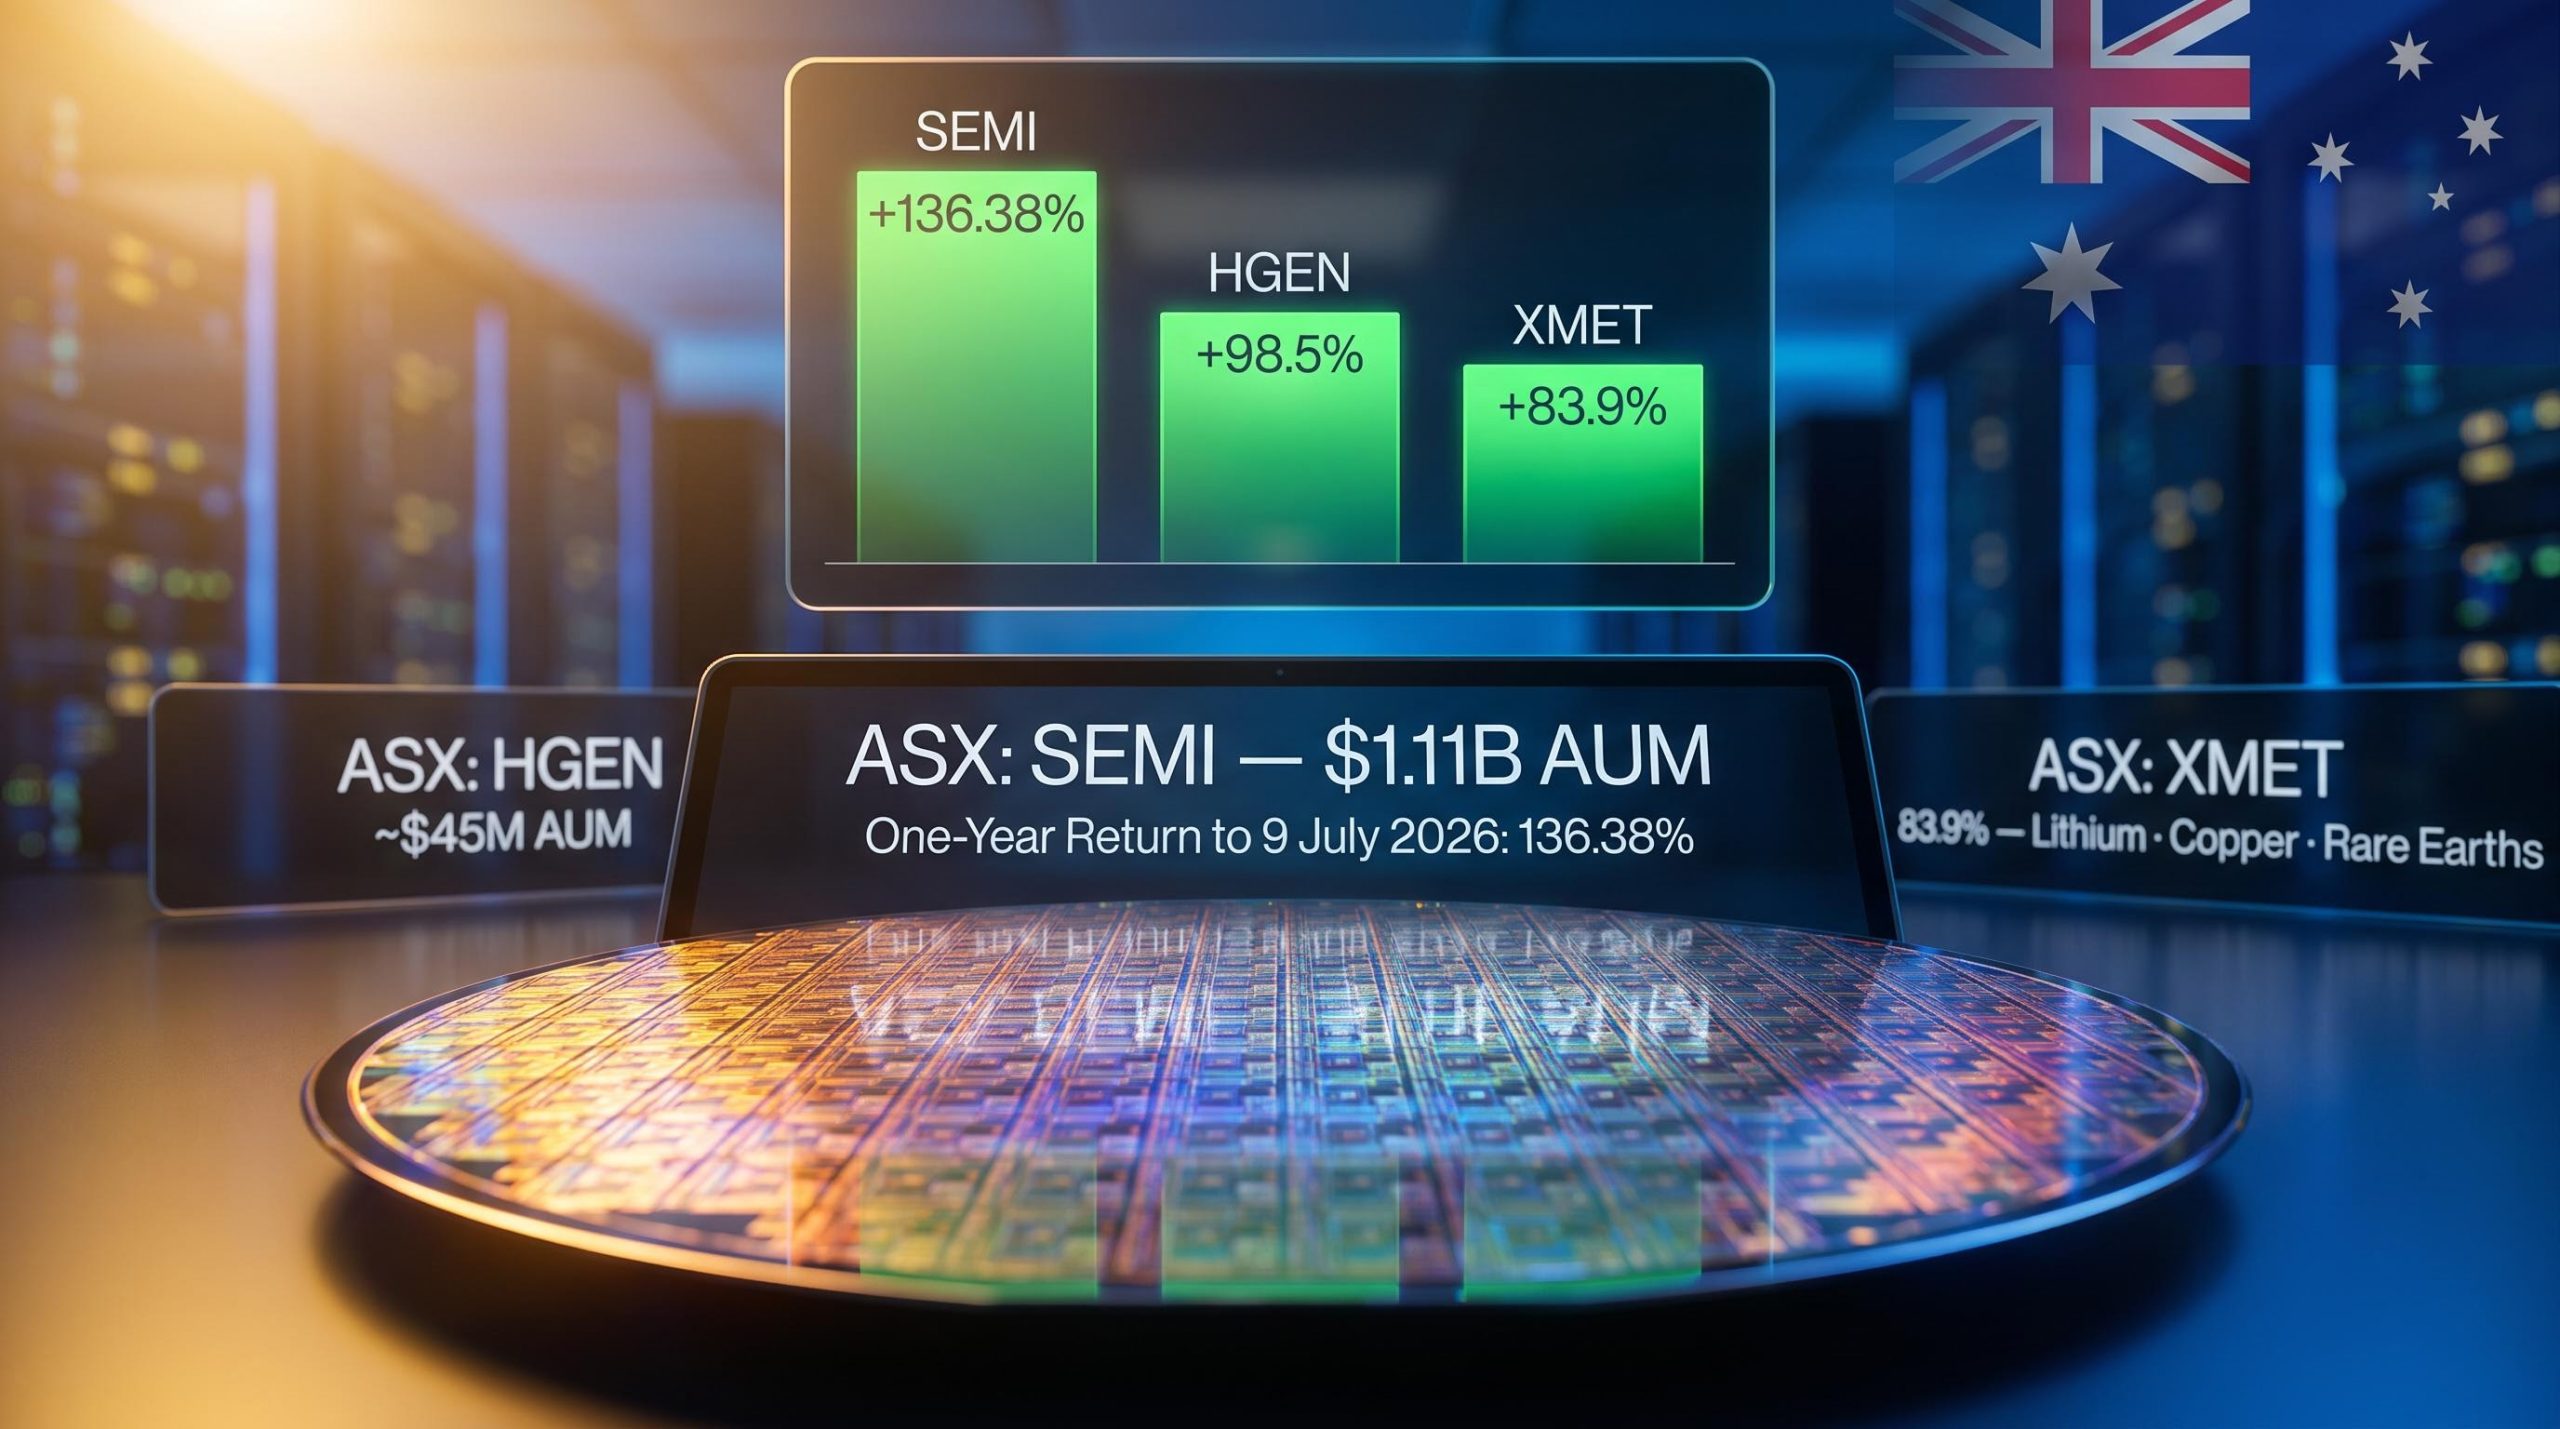
Three areas of the ASX delivered returns between 83.9% and 136.38% over the year to mid-July 2026. Not three individual stocks. Three sector ETFs, each tracking a different structural theme, each accessible through a single ASX trade.
Broad-market index funds did their job over the same period, delivering solid but unremarkable gains. The performance gap between those diversified funds and the concentrated thematic ETFs covered here raises a straightforward question: is your current all-index approach leaving thematic upside on the table?
Here is a breakdown of the three strongest-performing ASX sector ETFs from the past twelve months, what drives each one, and a framework for deciding whether any of them fits your portfolio rather than just your watchlist.
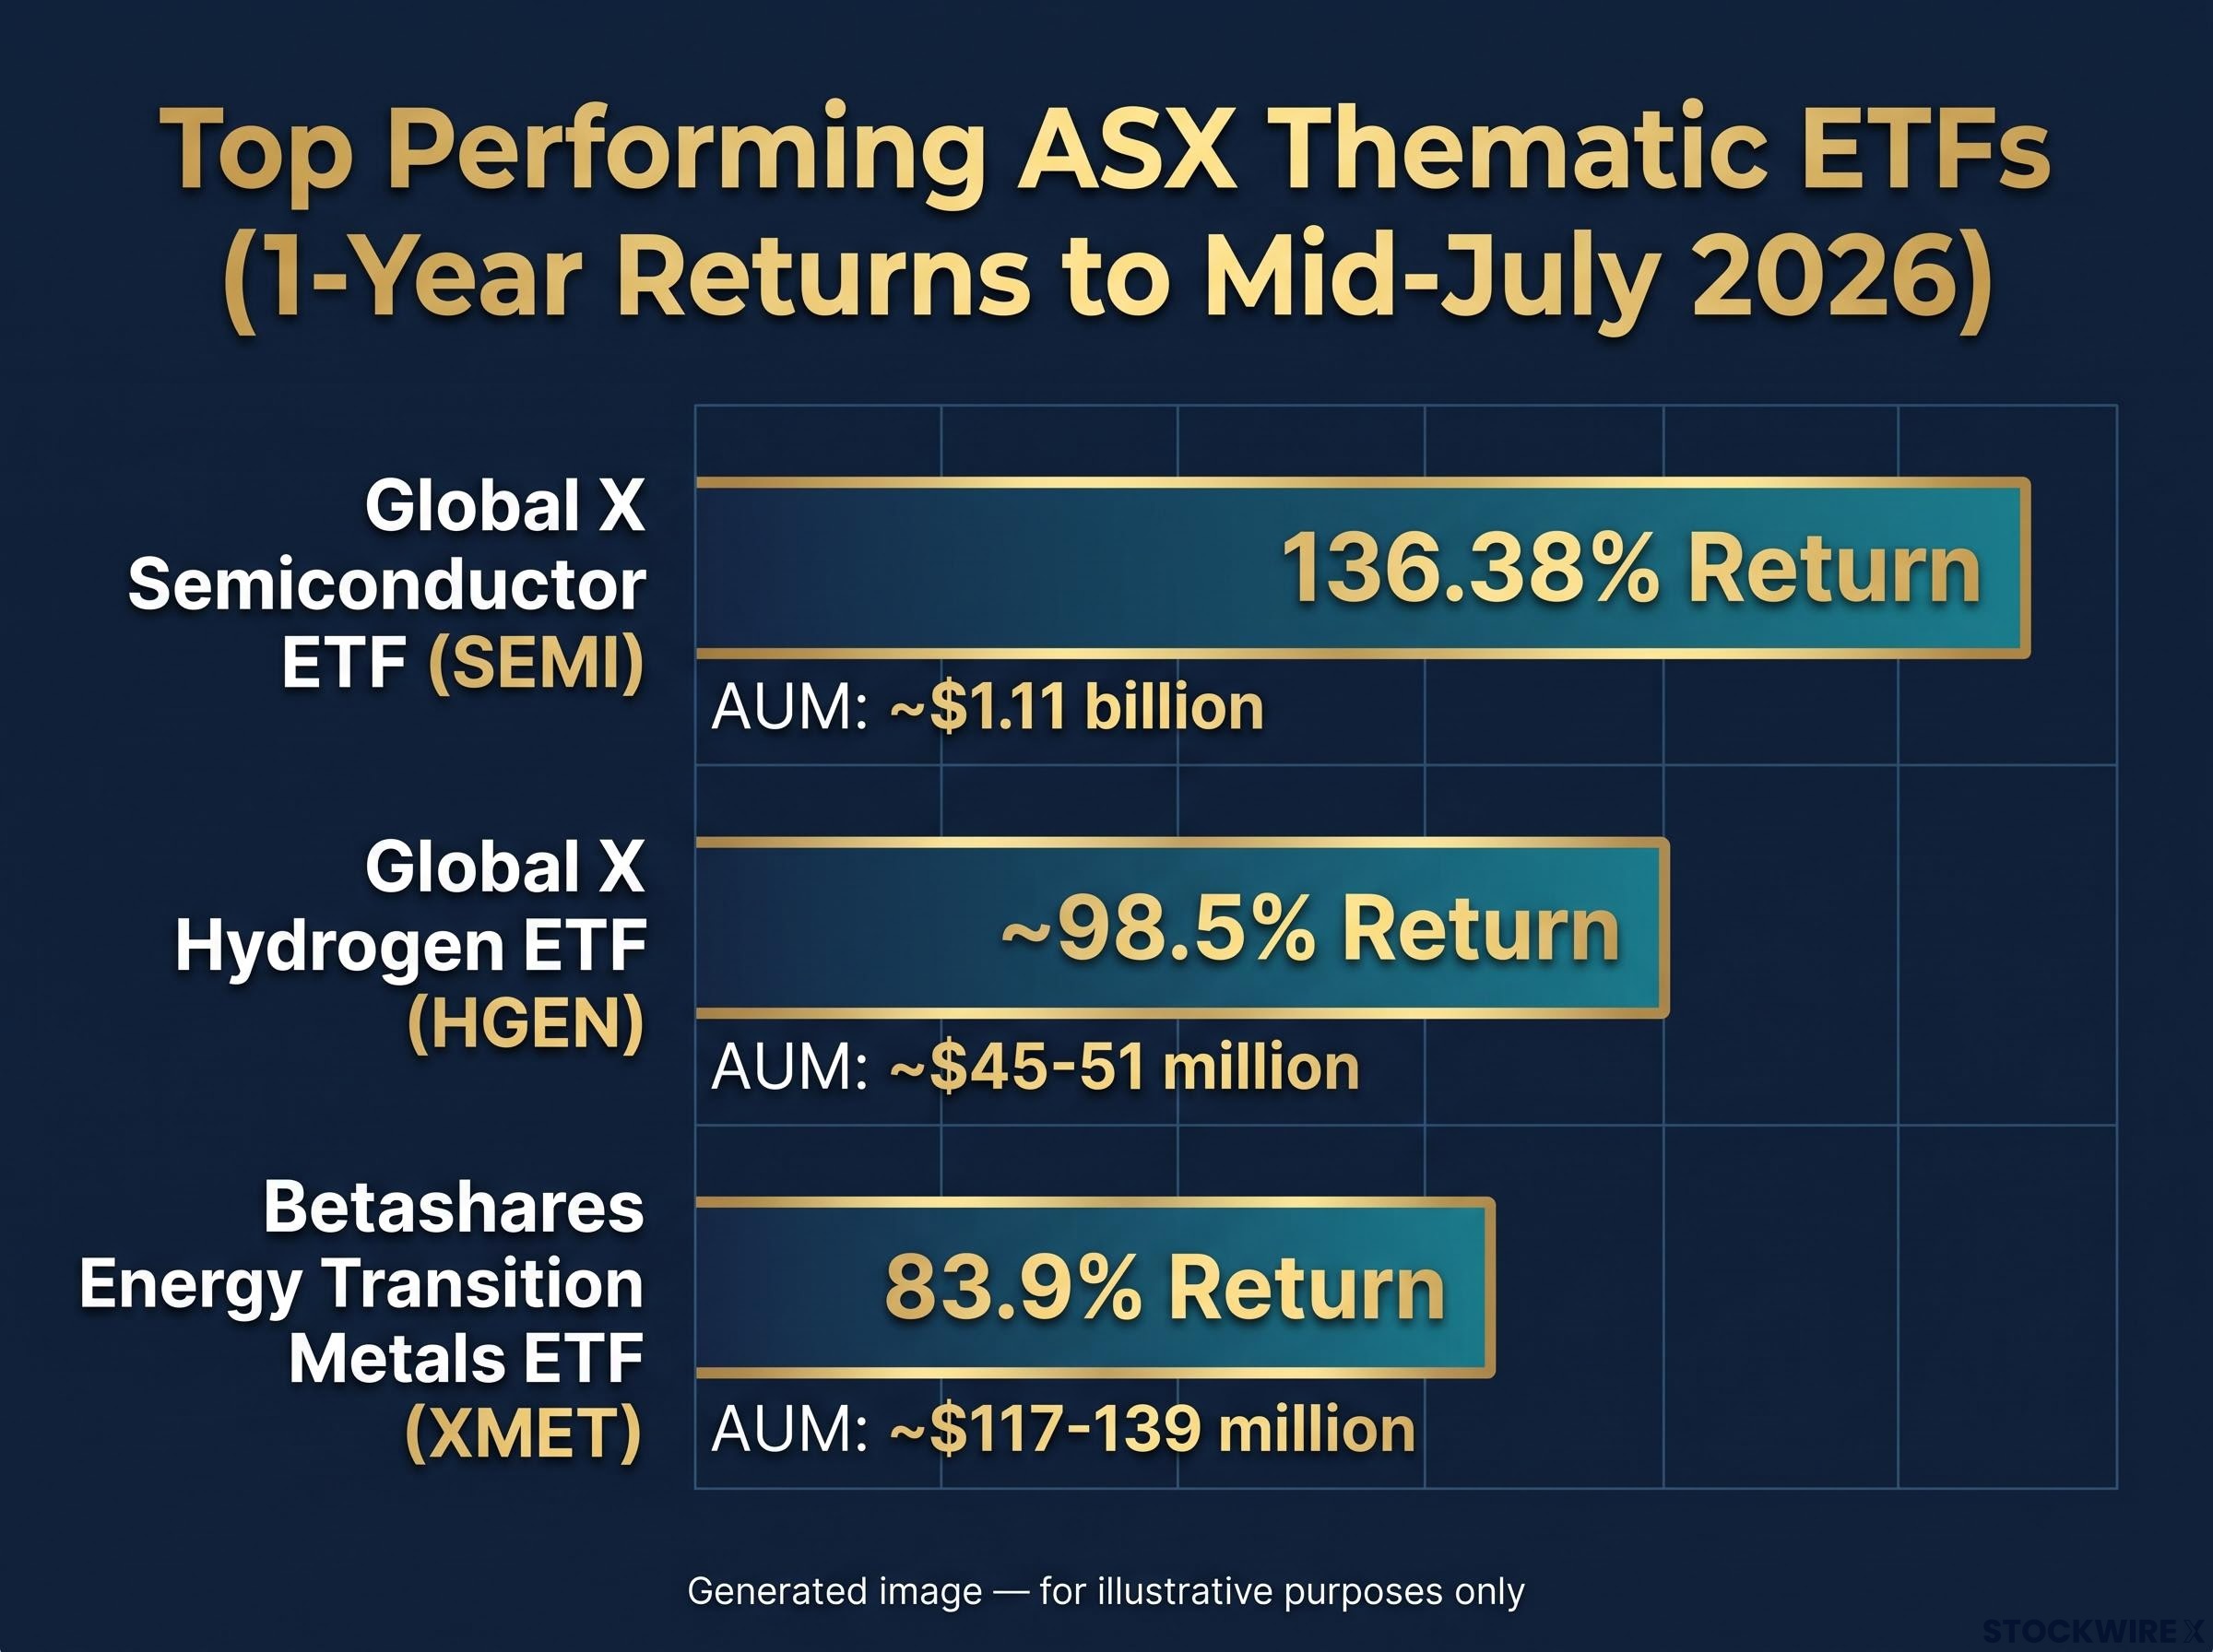
- Global X Semiconductor ETF (ASX: SEMI): 136.38% one-year total return
- Global X Hydrogen ETF (ASX: HGEN): approximately 98.5% one-year total return
- Betashares Energy Transition Metals ETF (ASX: XMET): 83.9% one-year total return
What makes sector and thematic ETFs different from index funds
If you hold a broad ASX index fund, your money is spread across hundreds of companies spanning financials, materials, healthcare, technology, and everything in between. That diversification smooths returns. It also means that when one sector is riding a structural tailwind, your portfolio captures only a fraction of that movement.
Thematic ETFs work differently. They concentrate holdings around a single structural driver, typically holding 20-40 companies rather than hundreds. A small number of high-conviction positions drive the bulk of performance.
That concentration cuts both ways:
Hidden ETF concentration is a structural risk that extends beyond thematic funds: the top 10 stocks in the ASX 200 account for roughly 50% of that index, meaning investors who pair a broad ASX ETF with one of the sector funds reviewed here may be doubling down on overlapping positions without realising it.
- Amplified gains when the structural driver is active
- Higher volatility when sector conditions shift or reverse
- Greater sensitivity to a single risk factor (policy change, commodity downturn, geopolitical shock)
This is by design, not a limitation.
How concentration affects returns
When AI chip demand surged over the past year, a fund holding 30 semiconductor companies captured nearly all of that upside. A broad index fund holding those same companies alongside banks, retailers, and utilities diluted the gain across hundreds of positions. The sector ETF’s concentration is what produced the 136.38% return, not luck.
Why fund size matters for trading costs
Fund size, measured by assets under management (AUM), directly affects your trading costs. Larger funds attract more daily trading volume, which keeps the gap between buy and sell prices (the bid-ask spread) tight.
SEMI manages approximately $1.11 billion in assets. That scale means you can enter and exit positions with minimal friction. HGEN, at roughly $45-51 million, is a fraction of that size. The practical effect is wider spreads and higher effective costs per trade, something worth factoring into your position-sizing decision, particularly if you trade frequently.
When big ASX news breaks, our subscribers know first
ASX: SEMI returned 136.38% in one year on the back of AI chip demand
One-year total return to 9 July 2026: 136.38%
That figure made SEMI the strongest performer of the three funds under review, and the structural story behind it explains why the return was not a one-off spike.
AI infrastructure build-out drove unprecedented demand for high-performance chips over the past twelve months. Data centres expanded capacity. Cloud computing providers committed billions to GPU procurement. The companies SEMI holds sit at the centre of that spending pipeline.
The fund tracks the Solactive Global Semiconductor 30 Index (before fees and expenses), holding approximately 30 of the world’s leading chip companies. Geographic exposure is weighted toward the United States, Taiwan, and the Netherlands, the three jurisdictions where advanced semiconductor manufacturing and design are concentrated.
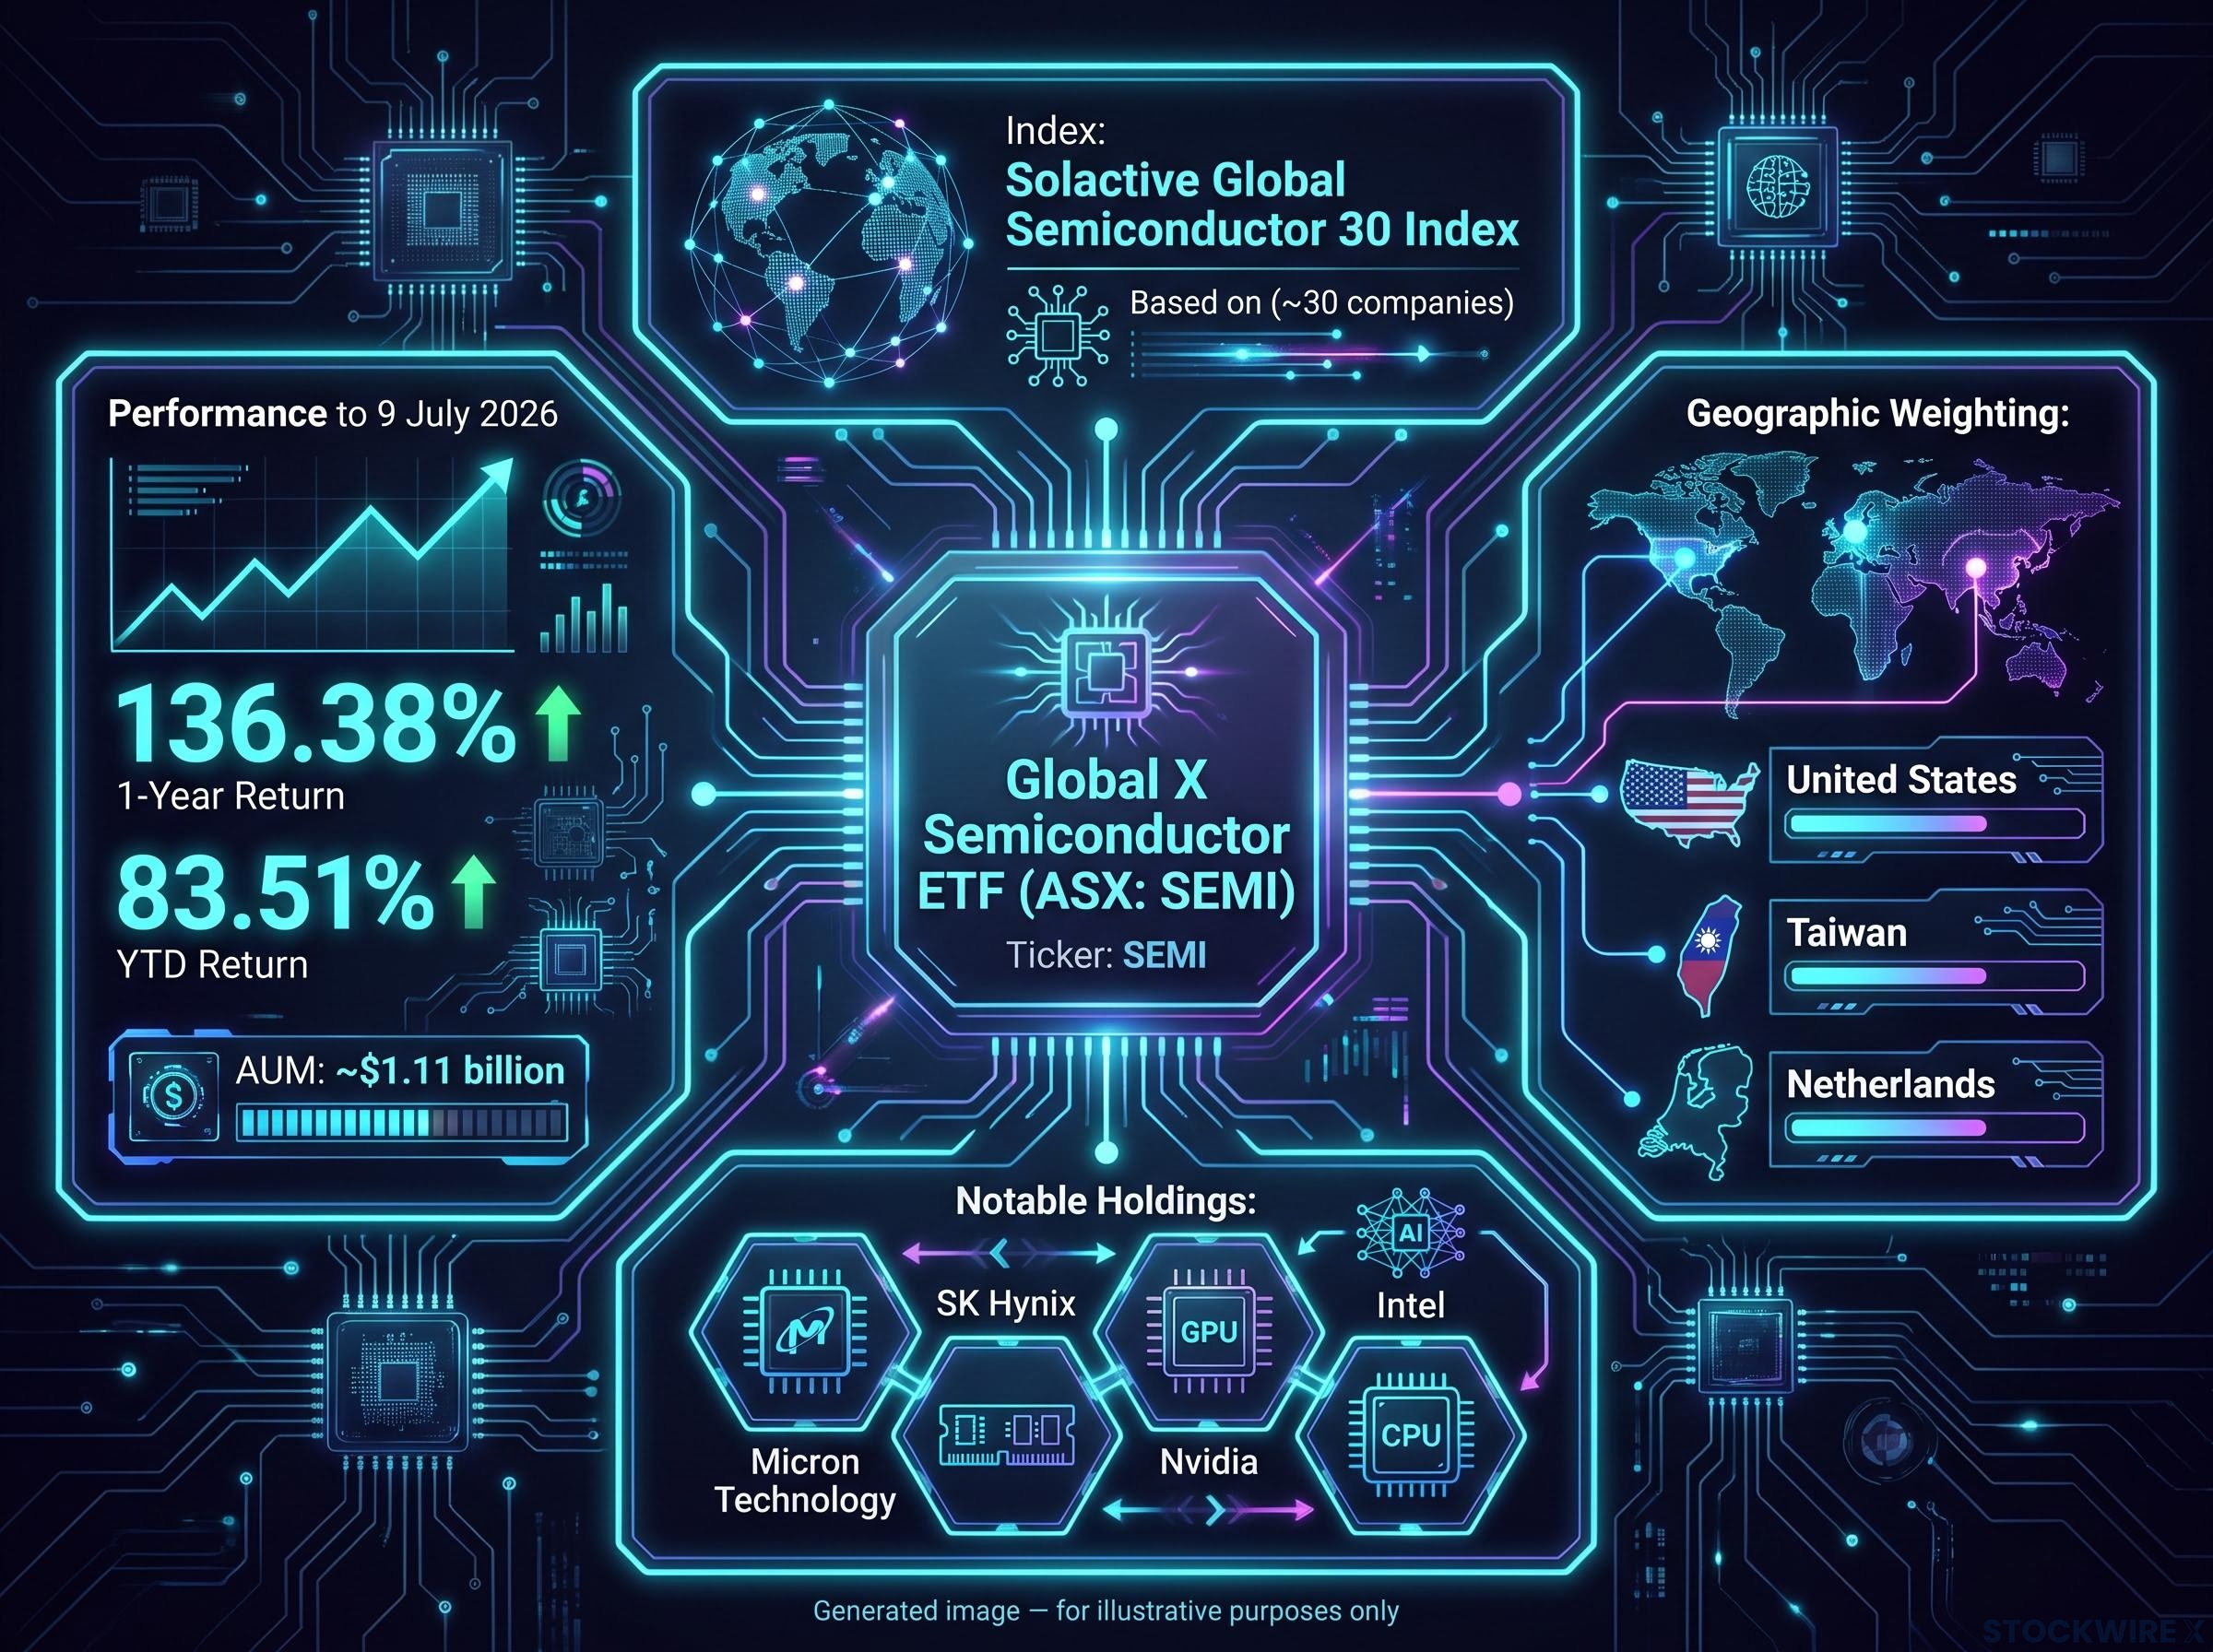
Notable holdings include:
- Micron Technology
- SK Hynix
- Nvidia
- Intel
- Year-to-date return (to 9 July 2026): 83.51%
- AUM (as of 10 July 2026): approximately $1.11 billion
- Performance figures sourced from the Global X issuer fact sheet dated 9-10 July 2026
The US-Taiwan-Netherlands weighting means you are taking on meaningful geopolitical risk tied to US-China chip trade policy alongside the AI demand upside. If that tension escalates, the same concentration that delivered 136.38% could work against you with equal force. SEMI’s scale and liquidity make it the most accessible entry point of the three funds, but its forward outlook depends on whether AI infrastructure spending sustains its current pace.
ASX: HGEN nearly doubled in twelve months as hydrogen policy momentum accelerated
HGEN returned approximately 98.5% over the year to 14 July 2026, and the driver was not a commodity price surge. It was policy.
Government commitments to clean hydrogen accelerated over the past twelve months, particularly for hard-to-abate industrial sectors where electrification alone cannot deliver decarbonisation targets. That policy momentum translated directly into capital flows toward the companies HGEN holds.
The fund spans the entire hydrogen value chain, holding companies across four distinct activities: producing hydrogen at scale; connecting hydrogen supply into wider energy systems; building and advancing fuel cell technology; and manufacturing the electrolysers that make green hydrogen production viable.
The 2026 rally is a recovery from a prior hydrogen sector drawdown of 60-70% following the 2021 peak, which means investors entering on momentum alone are buying into a fund whose headline return reflects cyclical recovery as much as structural policy progress.
That mandate gives HGEN a technology-company character as much as an energy character. You are buying into commercialisation timelines and policy execution, not a barrel price.
Understanding HGEN’s risk profile
The most recent one-month return tells a different story: approximately -5.2%. Against a twelve-month gain of roughly 98.5%, that drawdown is a reminder that HGEN rewards conviction-based holding rather than short-term trading. If you cannot tolerate sharp interim swings, size this position conservatively.
HGEN’s AUM sits at approximately $45-51 million, making it the smallest of the three funds. That smaller size does not disqualify it, but it does change how you should think about entry, exit, and position size. Wider bid-ask spreads mean your effective cost of trading is higher than with a billion-dollar fund like SEMI. Factor that into your calculations before committing.
Performance figures sourced from the Global X fund website as reported by Motley Fool Australia (14 July 2026), corroborated by review of issuer materials.
ASX: XMET gained 83.9% by tracking the metals that power the energy transition
XMET returned 83.9% over the year to 14 July 2026, and the story sits in a different layer of the energy transition entirely.
Where SEMI captures the technology layer and HGEN captures the policy-and-infrastructure layer, XMET captures the physical materials layer. Batteries, electric vehicles, and clean energy infrastructure all require specific metals in large quantities. XMET holds the companies that extract and produce them.
The fund targets:
- Lithium (battery cathodes and anodes)
- Copper (grid infrastructure and EV wiring)
- Nickel (battery chemistry)
- Graphite (battery anodes)
- Cobalt (battery cathodes)
- Manganese (battery chemistry)
- Silver (solar panels and electronics)
- Rare earth elements (EV motors and magnets)
Notable ASX holdings include Pilbara Minerals Ltd (ASX: PLS), BHP Group Ltd (ASX: BHP), and Lynas Rare Earths Ltd (ASX: LYC), giving the fund meaningful domestic company exposure alongside its global index mandate.
That Australian miner exposure means you are not only getting energy transition positioning. You are also taking on the commodity cycle volatility and capital intensity risks that come with mining equities specifically. A copper price correction or a lithium oversupply would hit this fund harder than a diversified index.
XMET’s AUM sits at approximately $117-139 million (sourced from the Betashares issuer fact sheet, 8 July 2026), placing it in a mid-tier liquidity position: more liquid than HGEN, smaller and more concentrated than SEMI.
Comparing the three funds side by side
| Fund (ASX Code) | Issuer | One-Year Return | YTD Return | AUM |
|---|---|---|---|---|
| SEMI | Global X | 136.38% | 83.51% | ~$1.11 billion |
| HGEN | Global X | ~98.5% | Not specified | ~$45-51 million |
| XMET | Betashares | 83.9% | Not specified | ~$117-139 million |
Performance data referenced to approximately 9-14 July 2026 per issuer fact sheets.
The pattern the table reveals is straightforward. The highest return came with the largest fund (SEMI), where scale and liquidity make execution easiest. The second-highest return came with the smallest fund (HGEN), where policy sensitivity delivers upside but volatility and trading costs are materially higher. XMET occupies the commodity-cycle middle ground: strong returns, mid-tier liquidity, and direct exposure to mining sector risks.
The AUM column tells you something the returns column cannot. SEMI’s scale makes it the most practical entry point for most retail investors. HGEN’s smaller size demands more care around execution and position sizing.
Investors should review each fund’s Product Disclosure Statement (PDS) before making investment decisions. All returns cited reflect historical performance over a specific period; past performance is not a reliable indicator of future results.
ASIC Regulatory Guide RG 282 sets out the obligations ETF issuers must meet under the Corporations Act 2001, including disclosure standards and liquidity arrangements that govern how funds like SEMI, HGEN, and XMET are admitted to and monitored on the ASX.
Selecting a sector ETF that fits your strategy, not just the return headline
The practical question is not which fund returned the most last year. It is whether the structural driver behind each fund is likely to persist long enough to justify the concentration risk you are taking on today.
Three variables should guide that decision:
- Your existing portfolio concentration. If you already hold significant technology exposure, adding SEMI doubles down on that sector rather than diversifying it. If your portfolio is materials-heavy, XMET does the same.
- Your tolerance for thematic volatility. HGEN’s one-month drawdown of approximately -5.2% is not an anomaly; it is the cost of concentrated thematic exposure. If that kind of interim swing would prompt you to sell, the position is too large.
- Your conviction in the structural driver. AI chip demand, hydrogen policy momentum, and energy transition metals demand are three distinct theses. Each requires its own assessment of durability.
There is a meaningful difference between using a sector ETF as a satellite allocation alongside a core index position and replacing index exposure with a concentrated thematic bet. The first approach limits downside if the thesis weakens. The second amplifies it.
The behaviour gap between reported fund returns and actual investor returns is consistently widest in thematic ETFs; ARK Innovation’s +233% time-weighted return translated into approximately -35% for the typical investor who bought near peak valuations, a pattern that applies directly to any concentrated thematic position entered after a strong run.
Sector concentration in each of these funds means a single-sector deterioration, whether from policy reversal, commodity downturn, or geopolitical shock, can produce outsized losses relative to a diversified portfolio. SEMI’s $1.11 billion AUM remains the liquidity benchmark against which the smaller funds should be evaluated when you are sizing positions.
This article is for informational purposes only and should not be considered financial advice. Investors should conduct their own research and consult with financial professionals before making investment decisions. Past performance does not guarantee future results. Financial projections are subject to market conditions and various risk factors.