
Harvest’s MicroStrategy ETFs have seen their unit price fall from roughly $19 to around $2, a decline of approximately 90%. Investors are still buying them. New unit creation is increasing, not shrinking. Combined assets under management sit at approximately $344 million.
That contradiction, a fund whose price chart looks like a disaster while its asset base looks like a going concern, is the question this article resolves. MSTE and MSTY are Canadian single-stock ETFs linked to MicroStrategy, which is itself a leveraged proxy for Bitcoin. The price collapse reflects the compounding risk baked into that structure. The fund’s continued operation reflects something entirely different: how ETF viability actually works.
What you take away here is not a verdict on whether to own these funds. It is a framework for understanding how high-income, leveraged, and single-stock ETF structures behave under stress, what actually triggers a closure, and how to read the signals that matter. Those tools apply well beyond this one product.
The fund that looks broken but keeps running
The numbers, taken at face value, look alarming:
- MSTE NAV: approximately $1.85 per unit (52-week range: $19.07 high, $1.59 low)
- MSTE net assets: approximately $298 million
- MSTY net assets: approximately $46 million
- Combined AUM: approximately $344 million
The unit price has collapsed. The fund’s asset base has not. Understanding why both things can be true at the same time requires separating two metrics that most investors instinctively treat as the same thing.
NAV per unit measures what each individual unit is worth. Total assets under management measures what the entire fund holds. ETF viability is governed by the second number, not the first. A fund can trade at $1.85 per unit and still be one of the larger single-stock ETFs in the Canadian market, because enough investors hold enough units for the total pool to remain substantial.
“A lower NAV may affect the achievable distribution amount, but the fund’s viability depends on total assets under management, not NAV per unit.” — Harvest ETFs
That $344 million in combined AUM tells you this is not a fund on life support. It is a large fund whose unit price has collapsed, and those are structurally different situations. The first carries closure risk. The second does not, at least not on current evidence. Getting that distinction right changes how you assess every high-income ETF you encounter.
When big ASX news breaks, our subscribers know first
What these funds actually hold, and why that makes them volatile
MSTE holds Class A shares of MicroStrategy (MSTR) directly, not through synthetic replication. It then applies approximately 25% bank leverage to that position and writes covered calls on roughly 33-40% of the portfolio (up to a 50% maximum) to generate monthly income.
MSTY also references MicroStrategy shares as its underlying, but it does not apply bank-level leverage. It uses a covered call strategy on the same MSTR exposure to generate high income, with net assets of approximately $46 million.
Both funds are single-stock income ETFs. Their performance is dominated by what happens to MicroStrategy and, indirectly, to Bitcoin, rather than a diversified equity basket.
How MicroStrategy became a leveraged Bitcoin proxy
In 2020, MicroStrategy (now rebranded as Strategy) pivoted its corporate focus to accumulating Bitcoin as a treasury asset, committing approximately $250 million to an initial purchase at around $11,000 per coin. While the company retains a technology services operation, its holdings of Bitcoin have become the dominant driver of its business and valuation.
Because Strategy has raised capital through equity issuance and debt to fund its Bitcoin accumulation, MSTR tends to amplify Bitcoin’s price movements in both directions, rising faster when Bitcoin climbs and falling harder when it retreats. At the time of the original source discussion, Strategy’s market capitalisation had slipped to roughly a 25-30% discount to the implied value of its Bitcoin holdings, with investors applying a negative premium to reflect concern about the company’s leverage.
That makes the risk architecture a three-layer stack:
- Bitcoin volatility: Bitcoin rose to approximately $125,000-$126,000 per coin at its peak before declining. Its price behaviour more closely resembles technology and AI-related equities than traditional safe-haven assets.
- MicroStrategy corporate leverage: Strategy amplifies Bitcoin moves in both directions because its Bitcoin positions are debt-funded. When Bitcoin falls, MSTR falls harder.
- MSTE fund-level leverage: The fund adds approximately 25% bank leverage on top of an already leveraged stock, and covered calls cap the upside on 33-40% of the position in exchange for option income.
When sentiment turns negative at any one of those layers, the losses at the fund level are amplified beyond what any single exposure would produce on its own. The 90% drawdown is not a surprise given this structure. It is the predictable output of compounding risks working in the same direction simultaneously.

What it actually takes to close a Canadian ETF
If the unit price has collapsed, why hasn’t Harvest closed these funds? Because Canadian ETF closures are driven by assets under management falling below economic viability thresholds, not by poor performance or low unit prices.
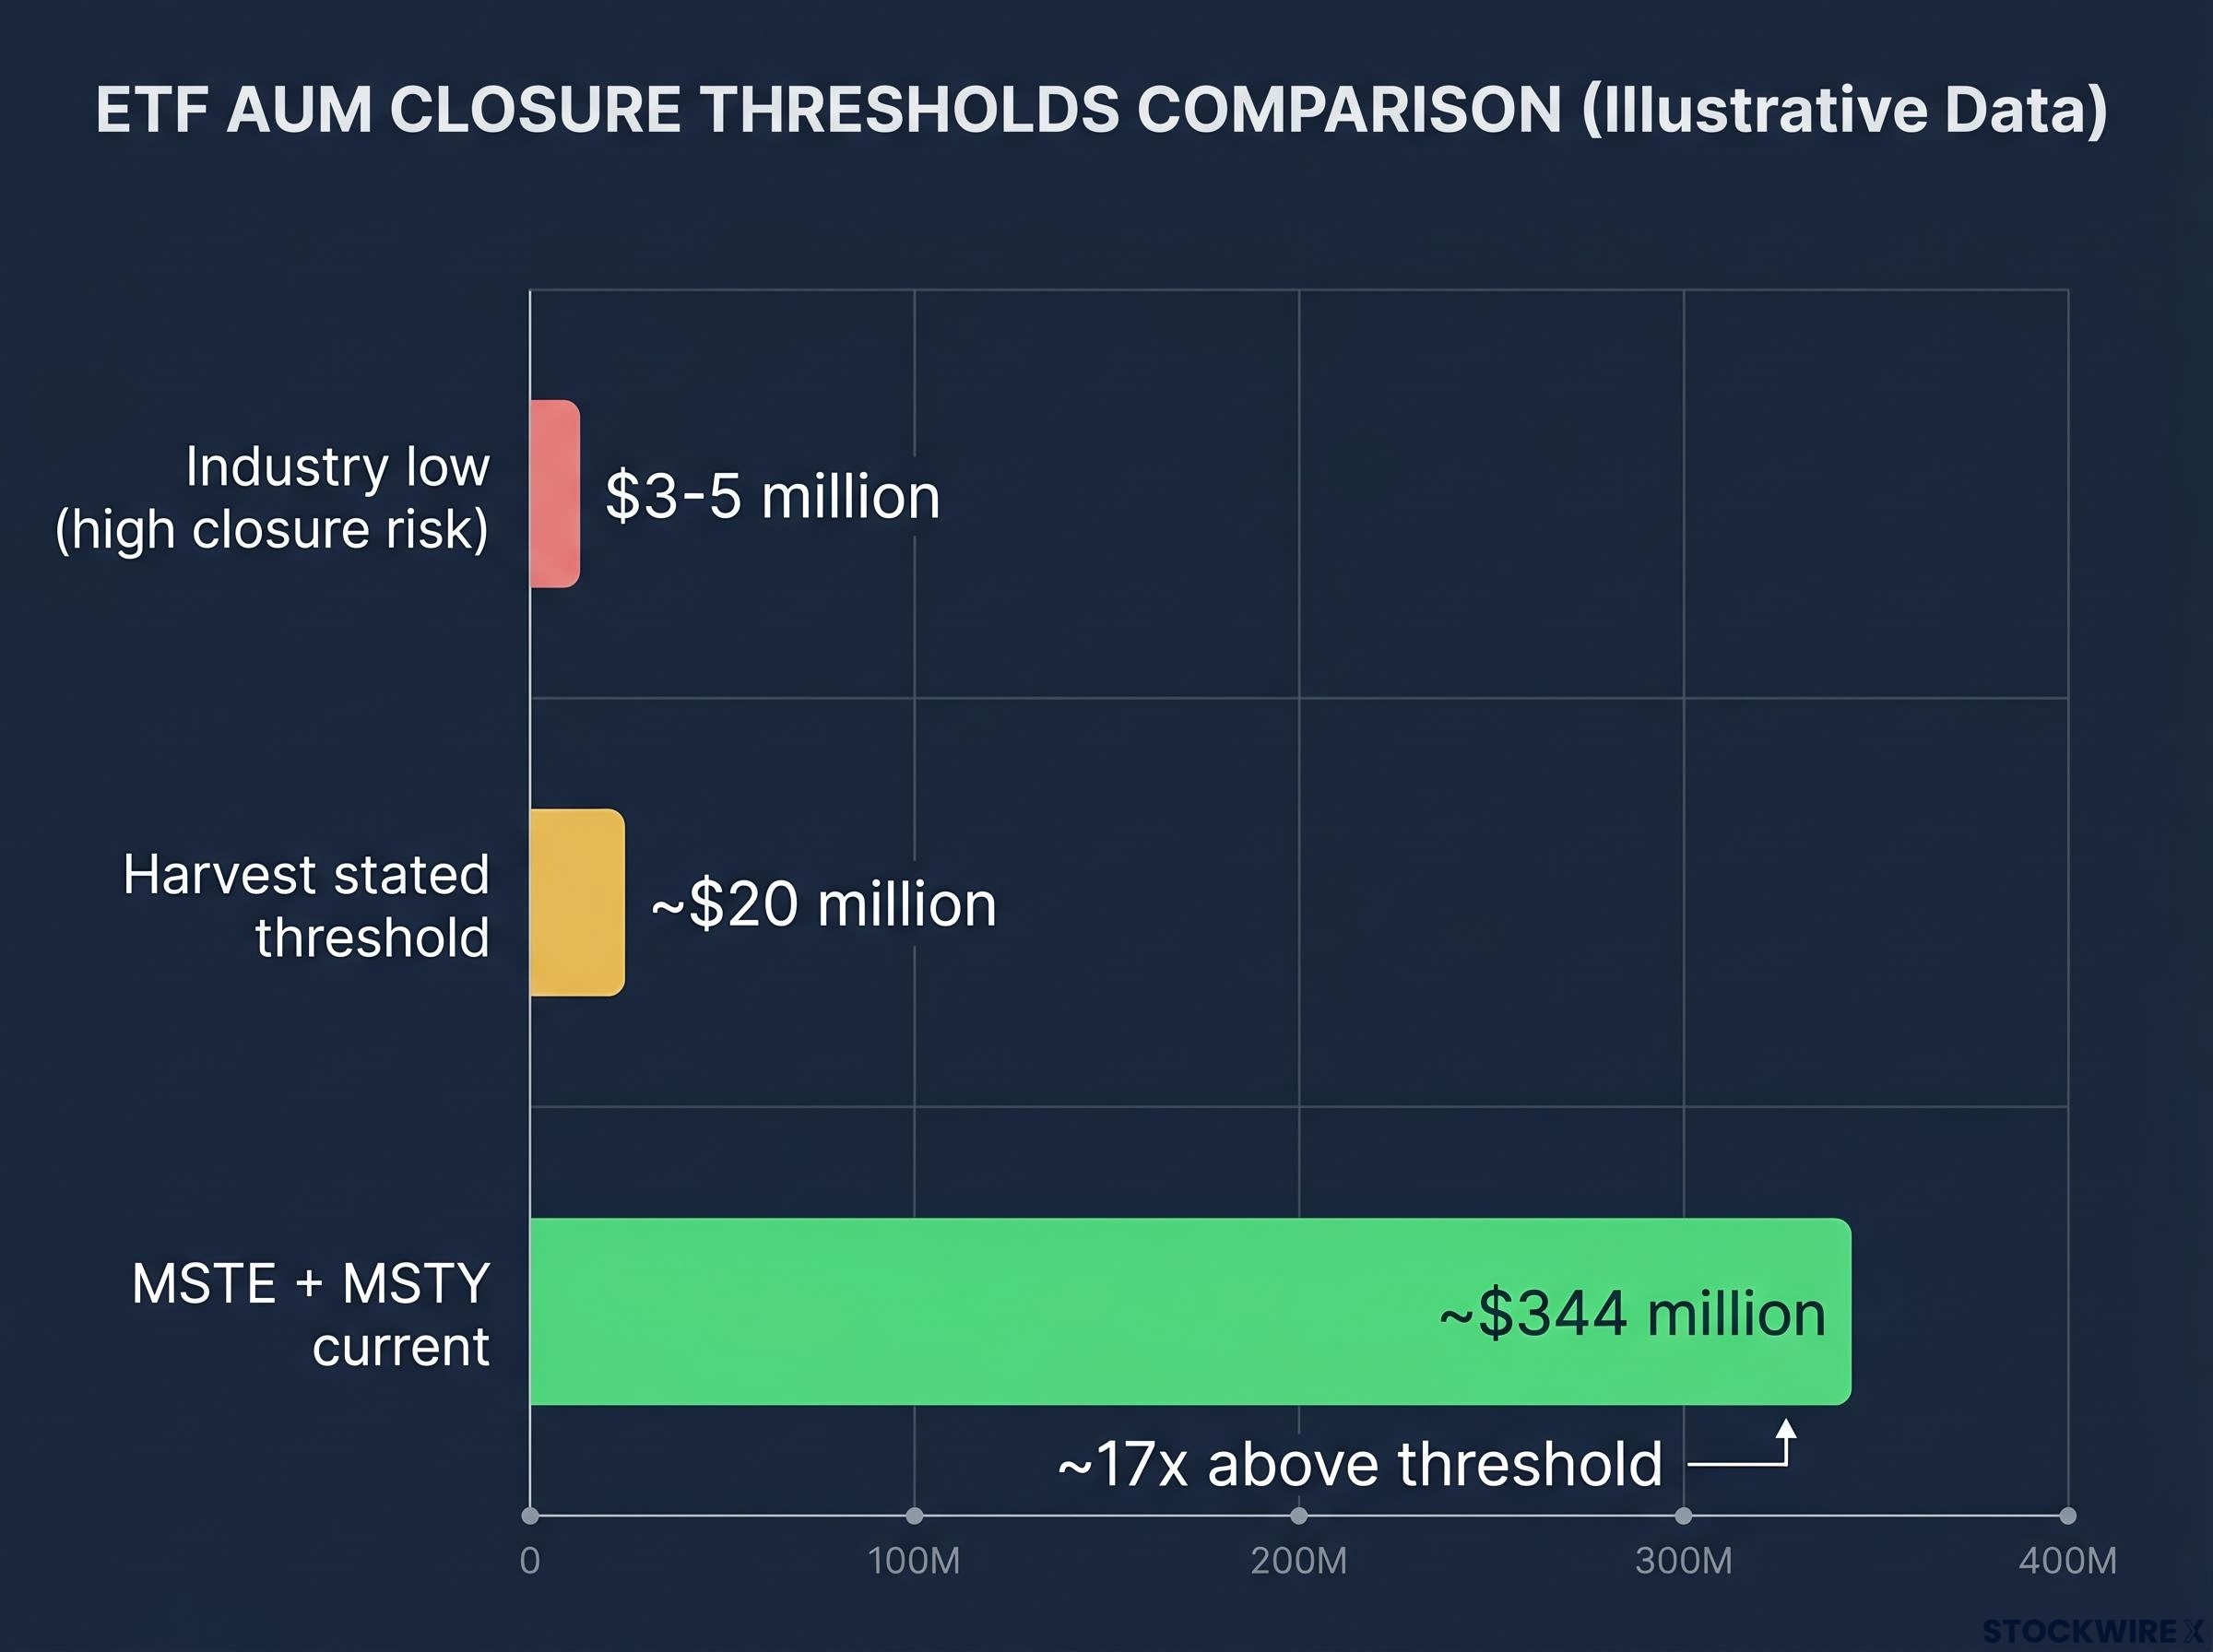
According to Harvest, a fund’s cost structure starts to become problematic when sustained AUM falls to around $20 million or below. More broadly across the industry, funds carrying less than $3-5 million in assets face a very high probability of closure, as fixed operating costs such as market-making, exchange listing, compliance, and custody become impossible to cover from fee income alone.
| Threshold Level | AUM Figure | Status |
|---|---|---|
| Industry low (high closure risk) | $3-5 million | High risk of closure |
| Harvest stated threshold | ~$20 million | Economically viable |
| MSTE + MSTY current | ~$344 million | Well above threshold (~17x) |
At approximately 17 times the stated viability level, MSTE and MSTY are nowhere near the zone where closure becomes a serious consideration. Harvest has confirmed that new unit creation has been increasing meaningfully as NAV has declined, meaning investors are actively choosing to enter the fund at lower prices, producing net inflows rather than the persistent outflows that would signal a closure trajectory.
The U.S.-listed REX Shares single-stock ETF known as MSI was wound down after failing to build an asset base large enough to sustain its operations. That example makes the principle concrete: insufficient AUM was what ended the fund, not the performance of the underlying or its unit price.
ETF closure mechanics follow a precise sequence: the fund provider announces a wind-down date, the portfolio is liquidated, and investors receive a cash payout based on NAV per unit at the record date, not a distressed sale price determined by market panic.
For any ETF you hold, the question “is this fund going to close?” is answered by looking at AUM and flow data, not at the chart of the unit price. That is the diagnostic the market rarely makes explicit, but it is the one that actually matters.
Canadian ETF Association AUM data published monthly tracks net assets and flow trends across the domestic ETF market, giving investors a direct way to benchmark any individual fund’s asset trajectory against industry-wide patterns.
This article is for informational purposes only and should not be considered financial advice. Investors should conduct their own research and consult with financial professionals before making investment decisions.
How the distribution adjusts when NAV collapses
When a fund’s NAV falls 90%, the distribution does not stay the same. As the unit price declined from $19 to around $2, Harvest reduced the payout progressively to avoid depleting the fund’s asset base. The monthly distribution was recently reduced from $0.15 to $0.10 per unit, and management has indicated it has been cut several times as both NAV and option premiums compressed.
The reason is straightforward. If you hold a high dollar distribution constant on a much lower NAV, you are effectively paying out the investor’s own capital faster, accelerating the erosion of AUM. Reducing the distribution as NAV falls slows that erosion and helps keep AUM above the economic viability threshold that protects the fund from closure.
Three variables determine what the distribution can actually be at any given time:
- NAV size: A smaller asset base means less capital generating returns
- Option premium levels: These depend on market volatility and conditions; when volatility compresses, premiums shrink
- Percentage of portfolio written against: Harvest maintains the covered call write range at 33-40% of the portfolio regardless of NAV level
“Currently, there are no plans to eliminate the distribution. We will continue to maintain the write-levels. Note, as NAV has declined and option premiums have shrunk accordingly, the distribution has been reduced several times.” — Harvest ETFs
The $0.10 monthly distribution on a $1.85 NAV implies a very high trailing yield. But that number only makes sense if you understand it partly reflects reduced option premiums on a smaller asset base and may include return of your own capital, not a stable income stream in the bond-coupon sense. Trailing yield on a collapsed NAV is a product of the structure’s arithmetic, not a signal of sustainable income.
Robust covered call ETF evaluation replaces headline yield with three metrics that actually predict income sustainability: distribution streak length, lifetime payout growth rate, and total return context relative to a benchmark, each of which provides diagnostic information that a trailing yield figure on a collapsed NAV cannot.
Why a reverse split has not happened, and what would trigger one
A reverse split consolidates units, for example converting 10 old units into 1 new unit, which raises the quoted price per unit. It is a cosmetic adjustment. Here is what it changes and what it does not:
- What a reverse split changes: quoted price per unit, number of units outstanding
- What it does not change: total NAV, underlying exposure, economic position of the holder
Harvest has confirmed that no reverse split is currently planned. The company’s position is that the unit price would need to fall considerably further than current levels before such a step warranted serious discussion, with a price somewhere below $0.50 representing a more plausible trigger point for that conversation.
At a NAV of approximately $1.85, the fund is comfortably above any listing or operational threshold that would mandate a reverse split. Knowing that specific trigger point gives you an actual number to track rather than a vague sense of structural uncertainty. If MSTE’s NAV moves toward $0.50, the reverse split conversation becomes relevant. At current levels, it is not.
The more important signals remain the ones covered earlier: AUM trends and net flow direction. A reverse split would not change the fund’s economics. AUM and flows data tell you whether the economics are healthy.
What this case study reveals about leveraged income ETFs as a category
MSTE and MSTY surface three structural lessons that apply across the growing universe of single-stock and covered call ETFs.
First, AUM is the survival metric, not price. A fund at $2 with $344 million in assets is structurally healthier than a fund at $20 with $5 million in assets. The REX Shares closure, driven by insufficient AUM despite being a functioning product, and MSTE’s continued operation, despite a 90% unit price decline, illustrate the same principle from opposite directions.
Second, high yield on a collapsed NAV is not the same as sustainable income. A 90% fall in NAV produces eye-catching trailing yield figures that are a function of the maths involved, not a reflection of the fund’s earning power. What actually matters is the composition of each distribution payment: specifically, how much derives from genuine option premium income and how much represents a return of the investor’s own contributed capital.
Return of capital distributions are not inherently harmful, but they change the after-tax economics of a position and affect NAV in ways that accelerate erosion if the organic income ratio falls too far below the stated payout, making the composition of each payment a central variable in any income fund assessment.
Third, covered calls provide income and partial cushioning, but they do not hedge the core directional risk. Option premiums support distributions and can modestly dampen drawdowns. They do not protect you from large declines in the underlying leveraged stock.
Three questions to ask before buying any leveraged single-stock income ETF
Before you commit capital to any product in this category, apply these three diagnostics in sequence. Each one is answerable with publicly available fund data.
- What is the fund’s AUM relative to its provider’s viability threshold, and is the flow trend positive or negative? Check the fund’s total net assets and units outstanding over time. If AUM is declining toward the $20 million range for a Canadian ETF (or the equivalent threshold for U.S. products), closure risk is real regardless of what the yield looks like.
- How many layers of leverage exist between your capital and the ultimate underlying asset? Count every layer: underlying asset volatility, corporate leverage at the stock level, fund-level leverage, and any synthetic replication. Each additional layer amplifies moves in both directions. A three-layer stack like MSTE’s produces outcomes that bear little resemblance to the underlying asset’s returns.
- What proportion of the distribution comes from option premiums versus return of capital? Check the fund’s distribution composition disclosures. If a meaningful share of the payout is classified as return of capital, you are partly receiving your own money back, not earning income. That changes the after-tax economics and the sustainability assessment entirely.
Past performance does not guarantee future results. Financial projections are subject to market conditions and various risk factors.
What the $344 million tells you, and what it does not
The structural conclusion is clear. MSTE and MSTY remain open because they are large, economically viable funds with ongoing investor demand, and their mechanics are operating as designed. This is not management inertia or oversight. It is a fund executing its stated strategy at an AUM level that remains approximately 17 times the stated viability threshold, with new unit creation still increasing.
What the $344 million AUM confirms:
- The funds are well above any closure threshold
- Investor demand remains active, with net inflows continuing
- The covered call and leverage strategies are still operationally functional
What it does not resolve:
- Whether the unit price will recover from current levels
- Whether MicroStrategy or Bitcoin will reverse their trajectory
- Whether the distribution is sustainable over a multi-year horizon at current NAV levels
If you came to this article asking whether this fund is going to close, the answer is: not on current evidence. But that is a separate question entirely from whether the investment is likely to recover, and the $344 million figure answers only the first one. The diagnostic framework you now have, covering AUM viability, leverage stack architecture, and distribution composition, applies to every leveraged income ETF you evaluate from here.
For readers who want to extend these diagnostics into a full ETF evaluation process, our dedicated guide to comparing ETFs covers bid-ask spreads, tracking difference, replication method, and securities lending income across an 8-step framework that applies to any fund type.