
SpaceX Is Now in Your QQQ Fund, Whether You Chose It or Not
33 mins ago

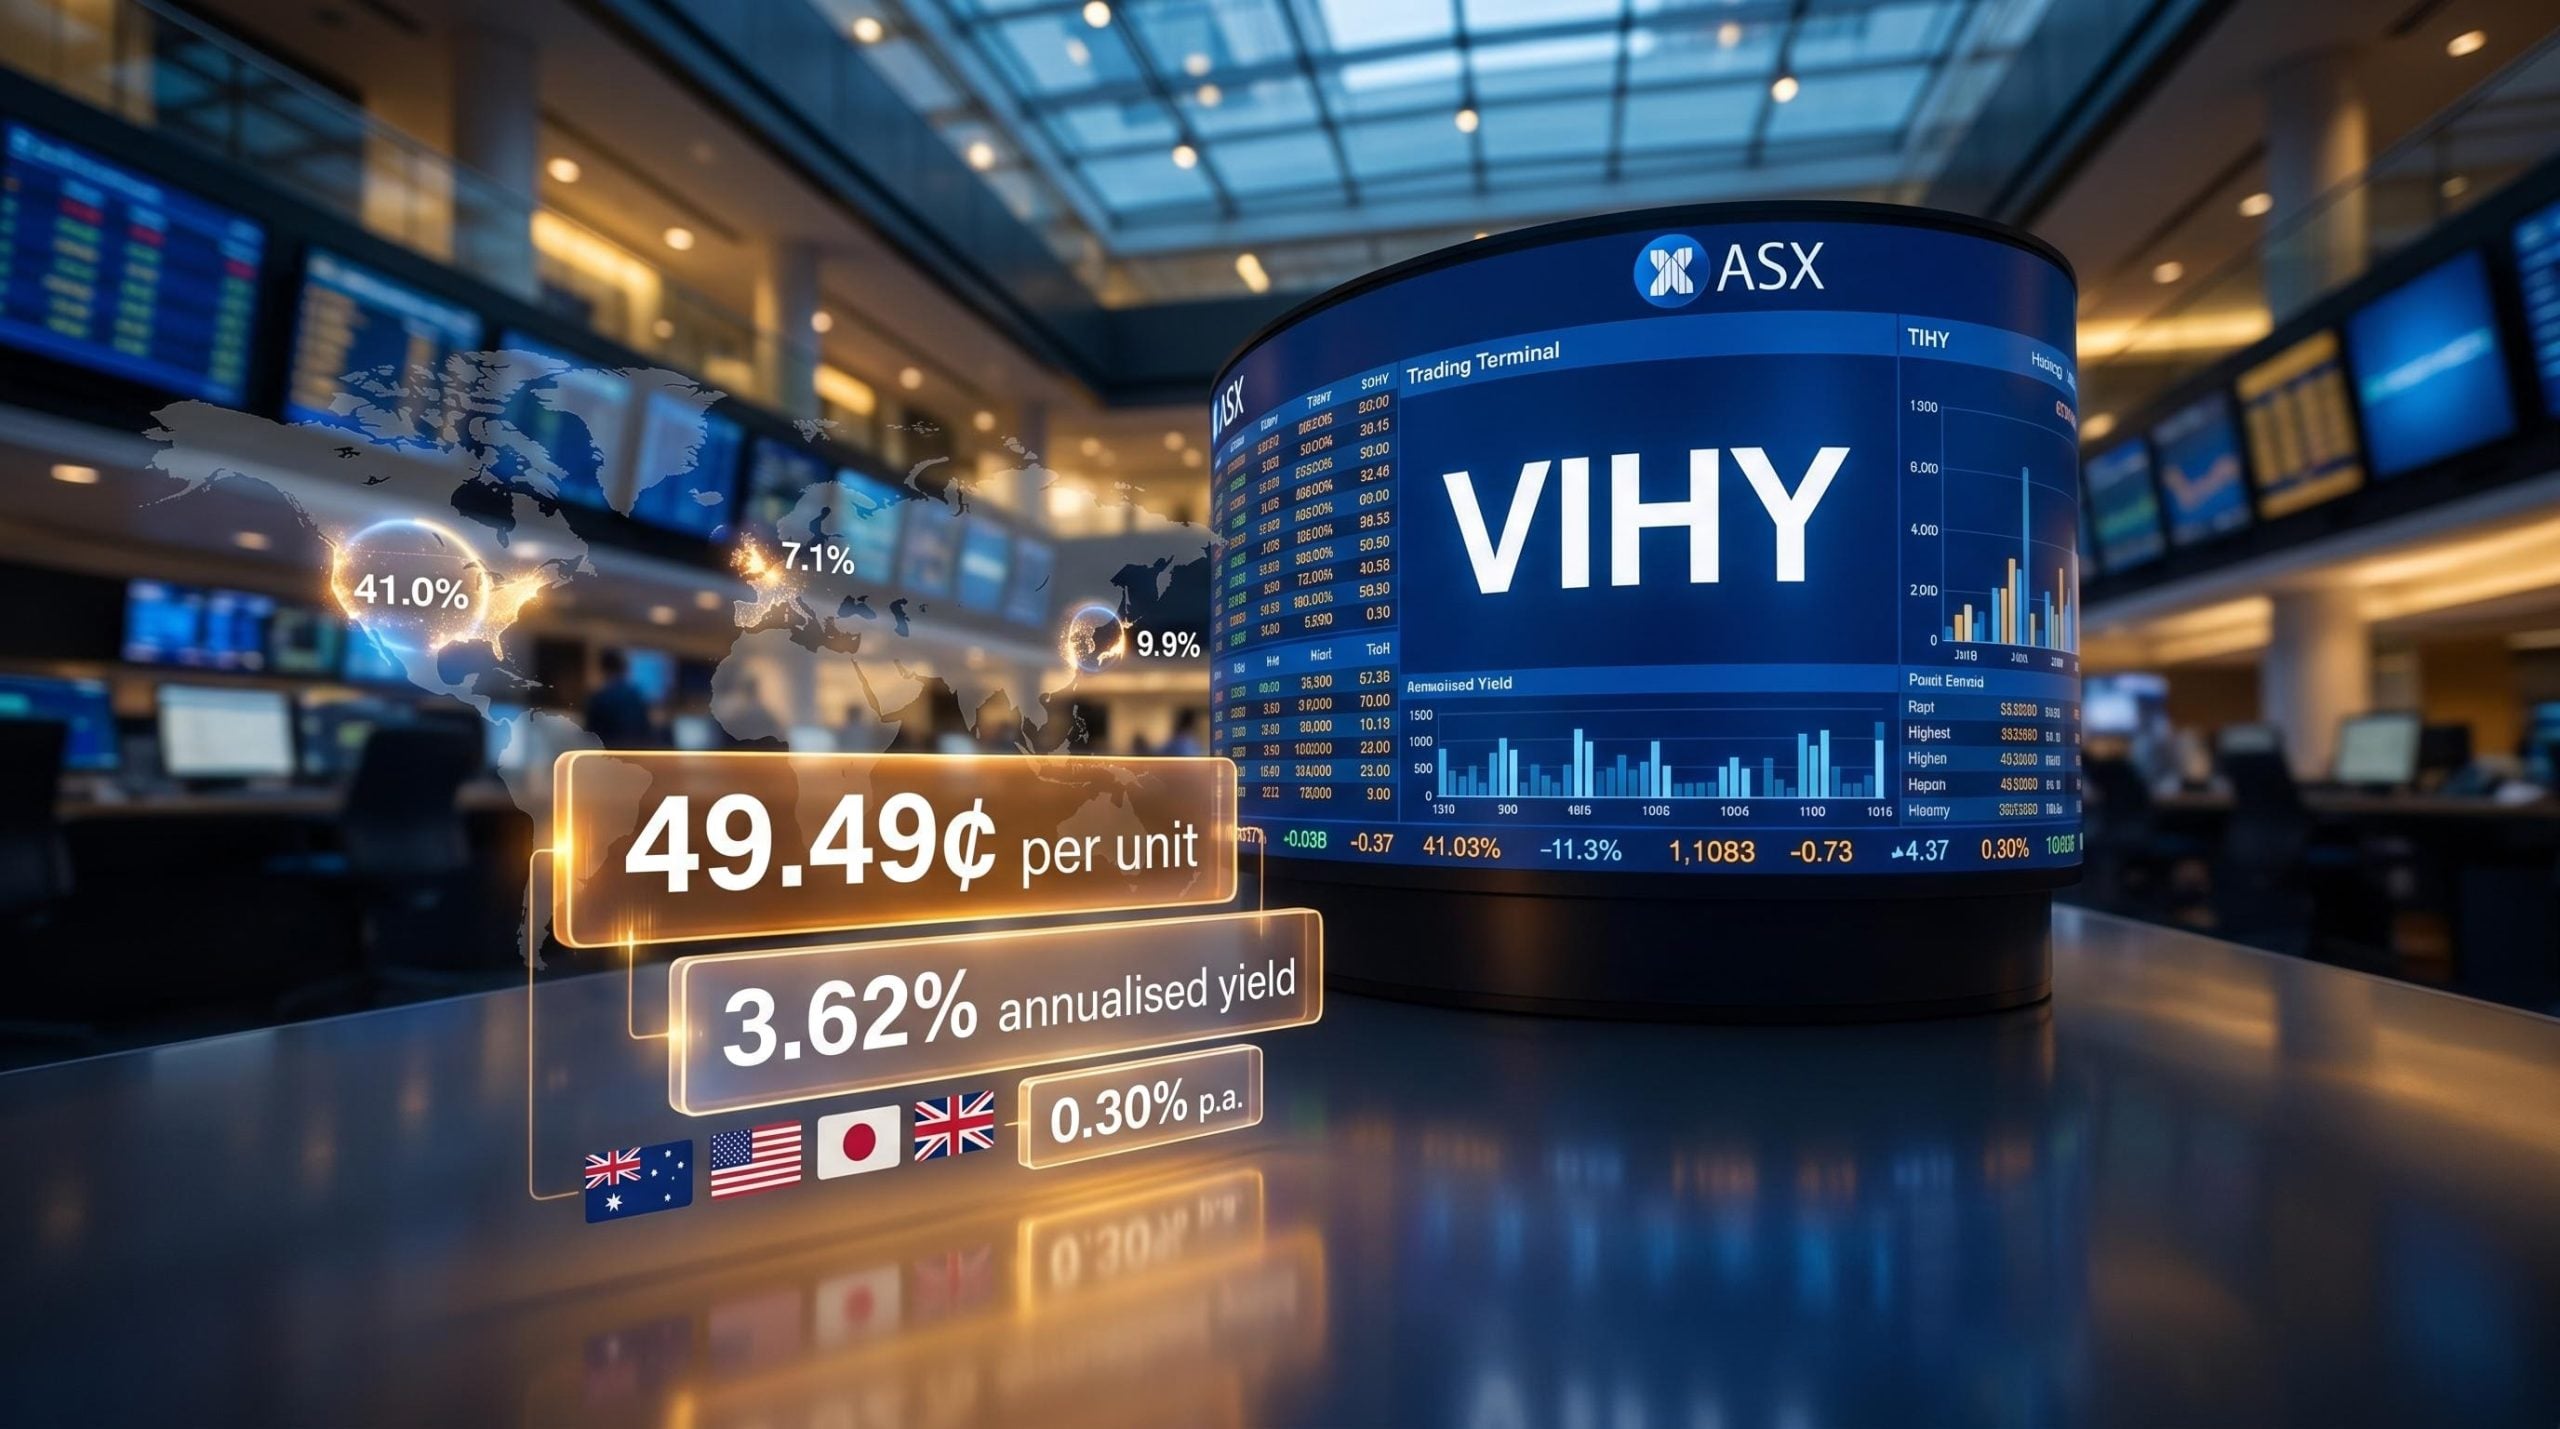
Vanguard has just declared VIHY’s first-ever distribution, 49.49 cents per unit, and for Australian income investors who have been watching this fund since its March 2026 launch, that number finally gives them something concrete to evaluate.
VIHY is Vanguard’s new internationally focused high-dividend ETF, listed on the ASX and designed specifically to sit alongside domestic income holdings rather than replace them. It tracks a global index of approximately 1,600 dividend-paying companies across developed and emerging markets, excludes Australia and REITs entirely, and charges 0.30% per annum. That first distribution implies an annualised yield of roughly 3.62%, but one payment does not a track record make, and the caveats around that number matter as much as the number itself.
Here is a framework for reading that yield figure honestly, understanding the structural trade-offs VIHY introduces, and deciding whether it earns a place alongside your existing ASX dividend holdings.
VIHY tracks the FTSE All-World ex Australia High Dividend Yield Net Tax Index, covering large and mid-cap stocks across developed and emerging markets with higher-than-average forecast dividend yields. That word, forecast, matters. The index selects companies based on forward-looking yield expectations rather than trailing dividends already paid, meaning VIHY tilts toward companies expected to pay well, not companies that have already paid well. It is a subtle distinction, but it shapes how the fund’s income profile is constructed over time.
Two structural exclusions are deliberate, not incidental. Australian shares are removed entirely to avoid overlap with domestic holdings. REITs are excluded to keep the fund as pure equity income. The fund launched on 24 March 2026, pays quarterly distributions, is unhedged, and charges a management fee of 0.30% per annum.
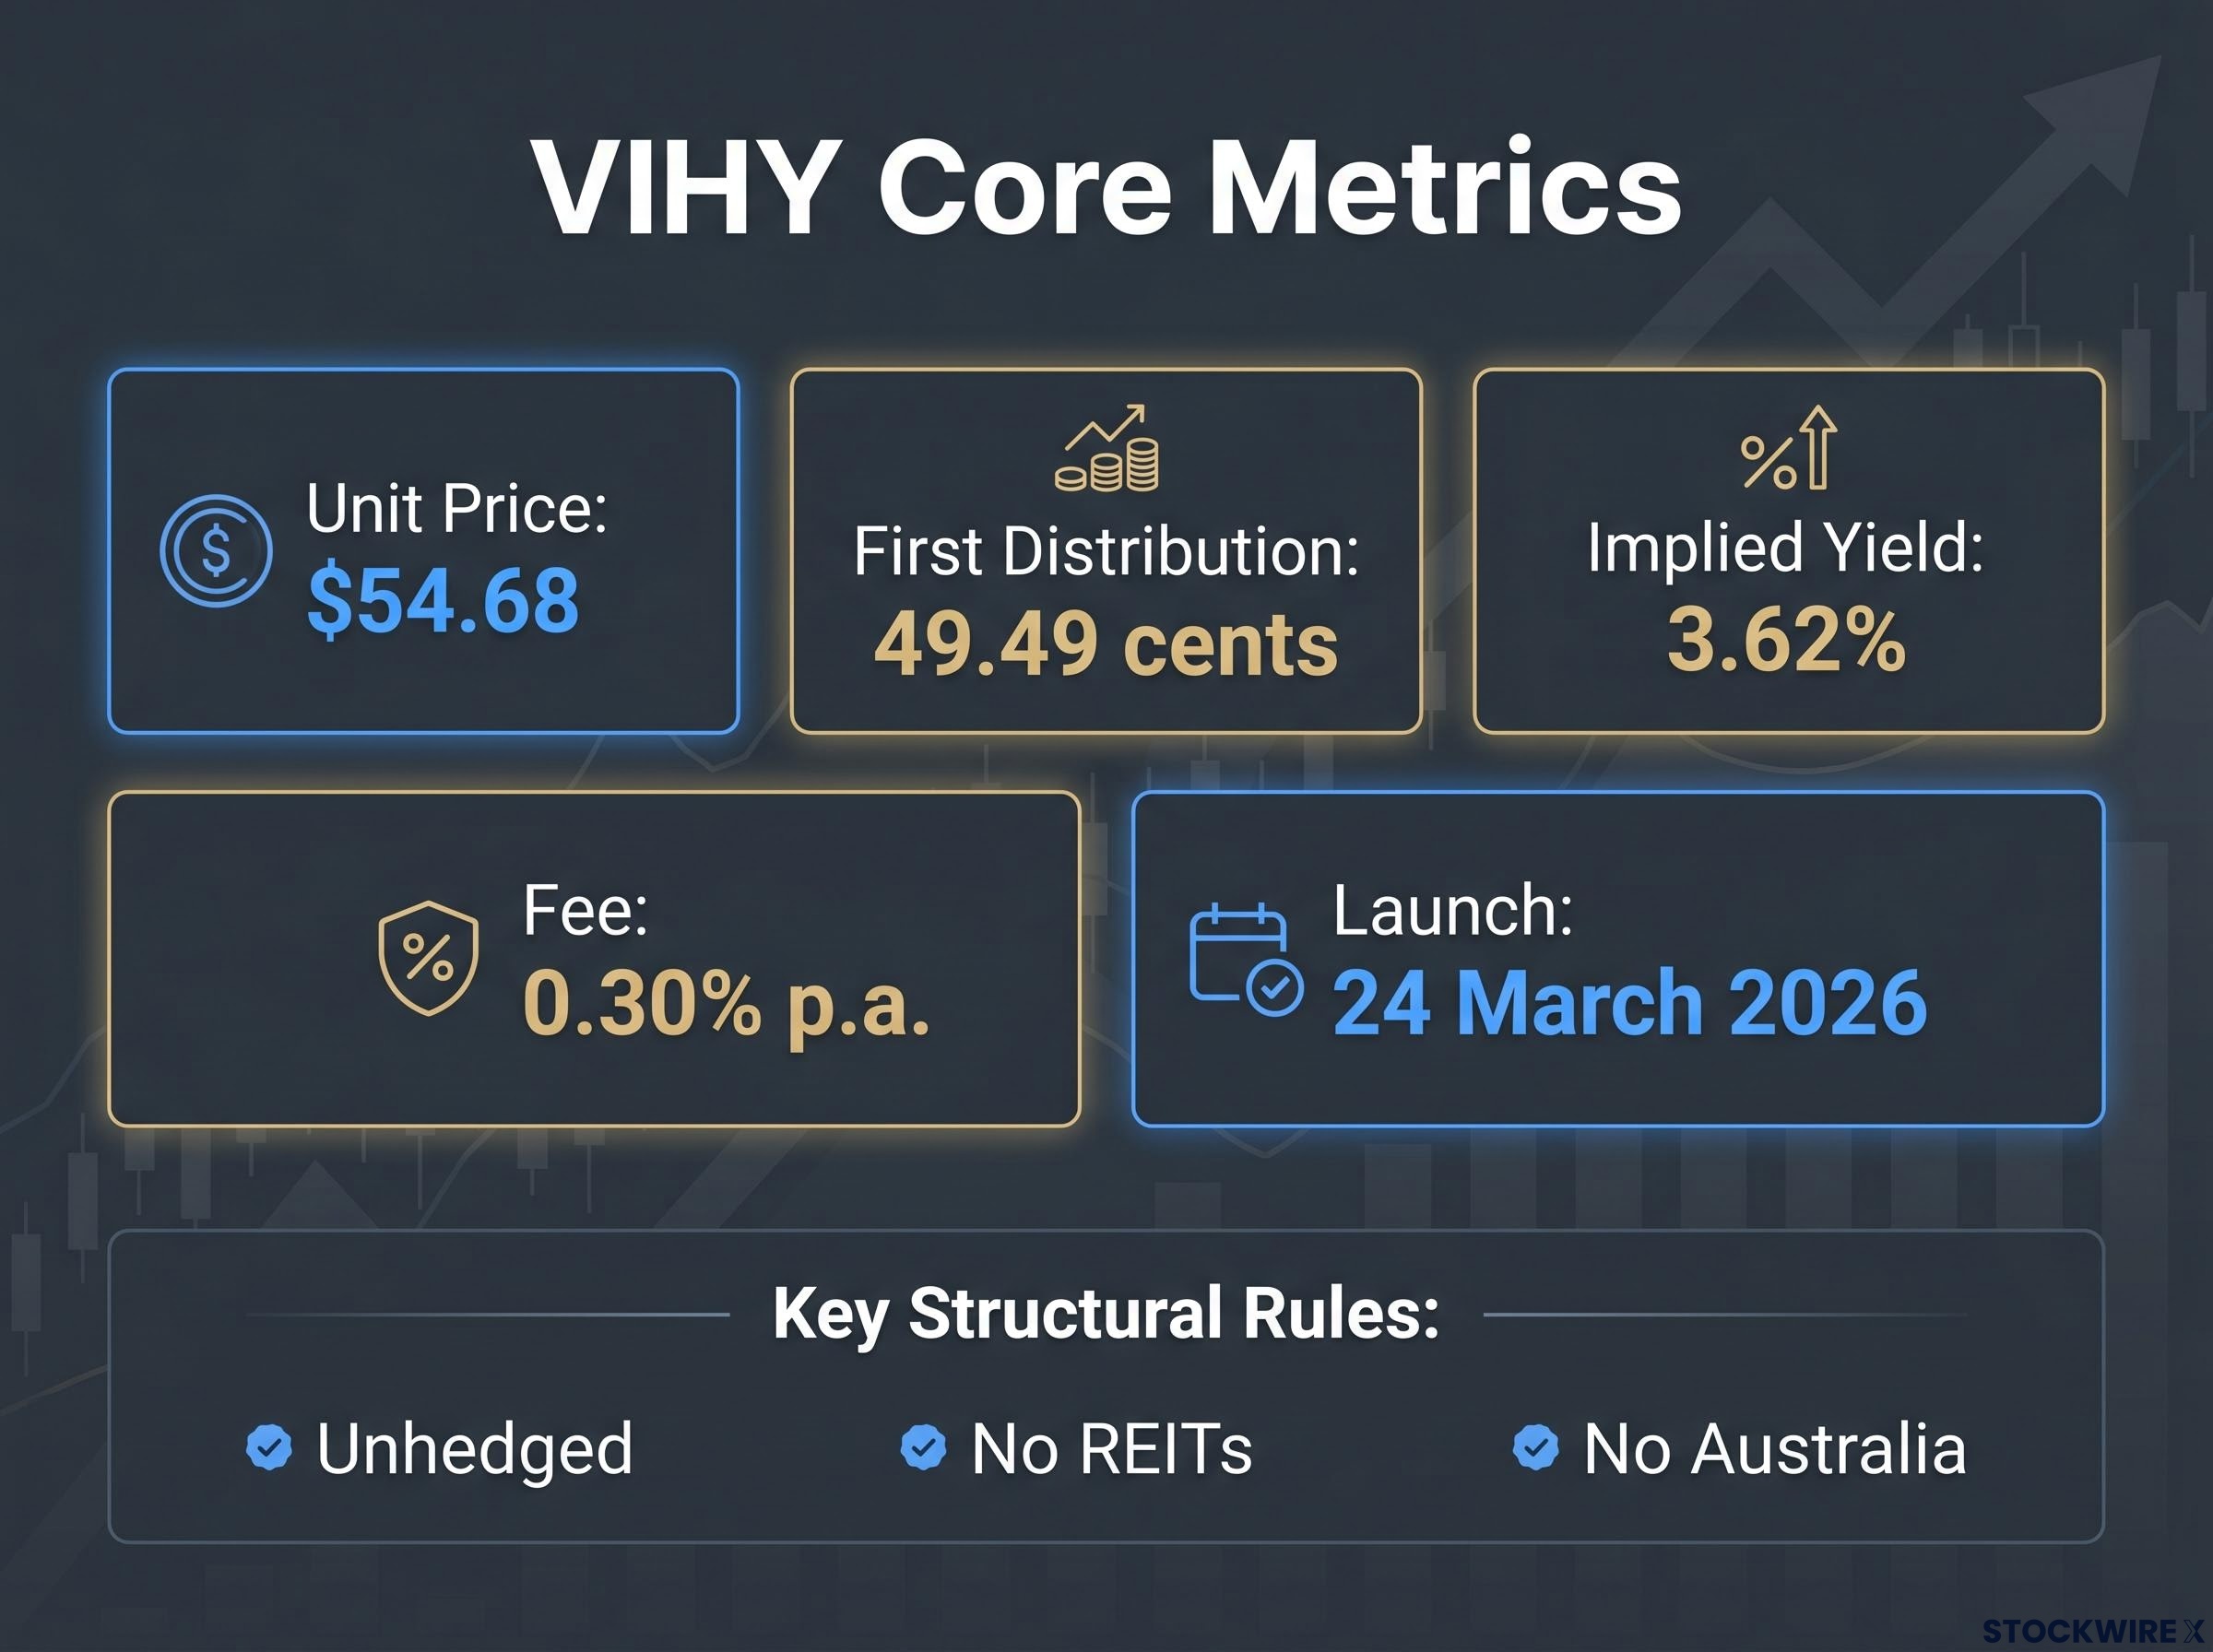
| Detail | Information |
|---|---|
| ASX Code | VIHY |
| Index Tracked | FTSE All-World ex Australia High Dividend Yield Net Tax Index |
| Inception Date | 24 March 2026 |
| Management Fee | 0.30% p.a. |
| Currency Hedging | None (unhedged) |
| Distribution Frequency | Quarterly |
| REITs Included | No |
| Australia Included | No |
VIHY draws from an index universe of more than 2,300 stocks and holds approximately 1,600 positions. Its largest holdings are globally recognised dividend payers spanning financial services, energy, healthcare, consumer goods, and technology:
The geographic breakdown tells a concentration story. As of 31 May 2026, the United States accounts for 41.0% of VIHY’s portfolio, which is the single most important number in the allocation table.
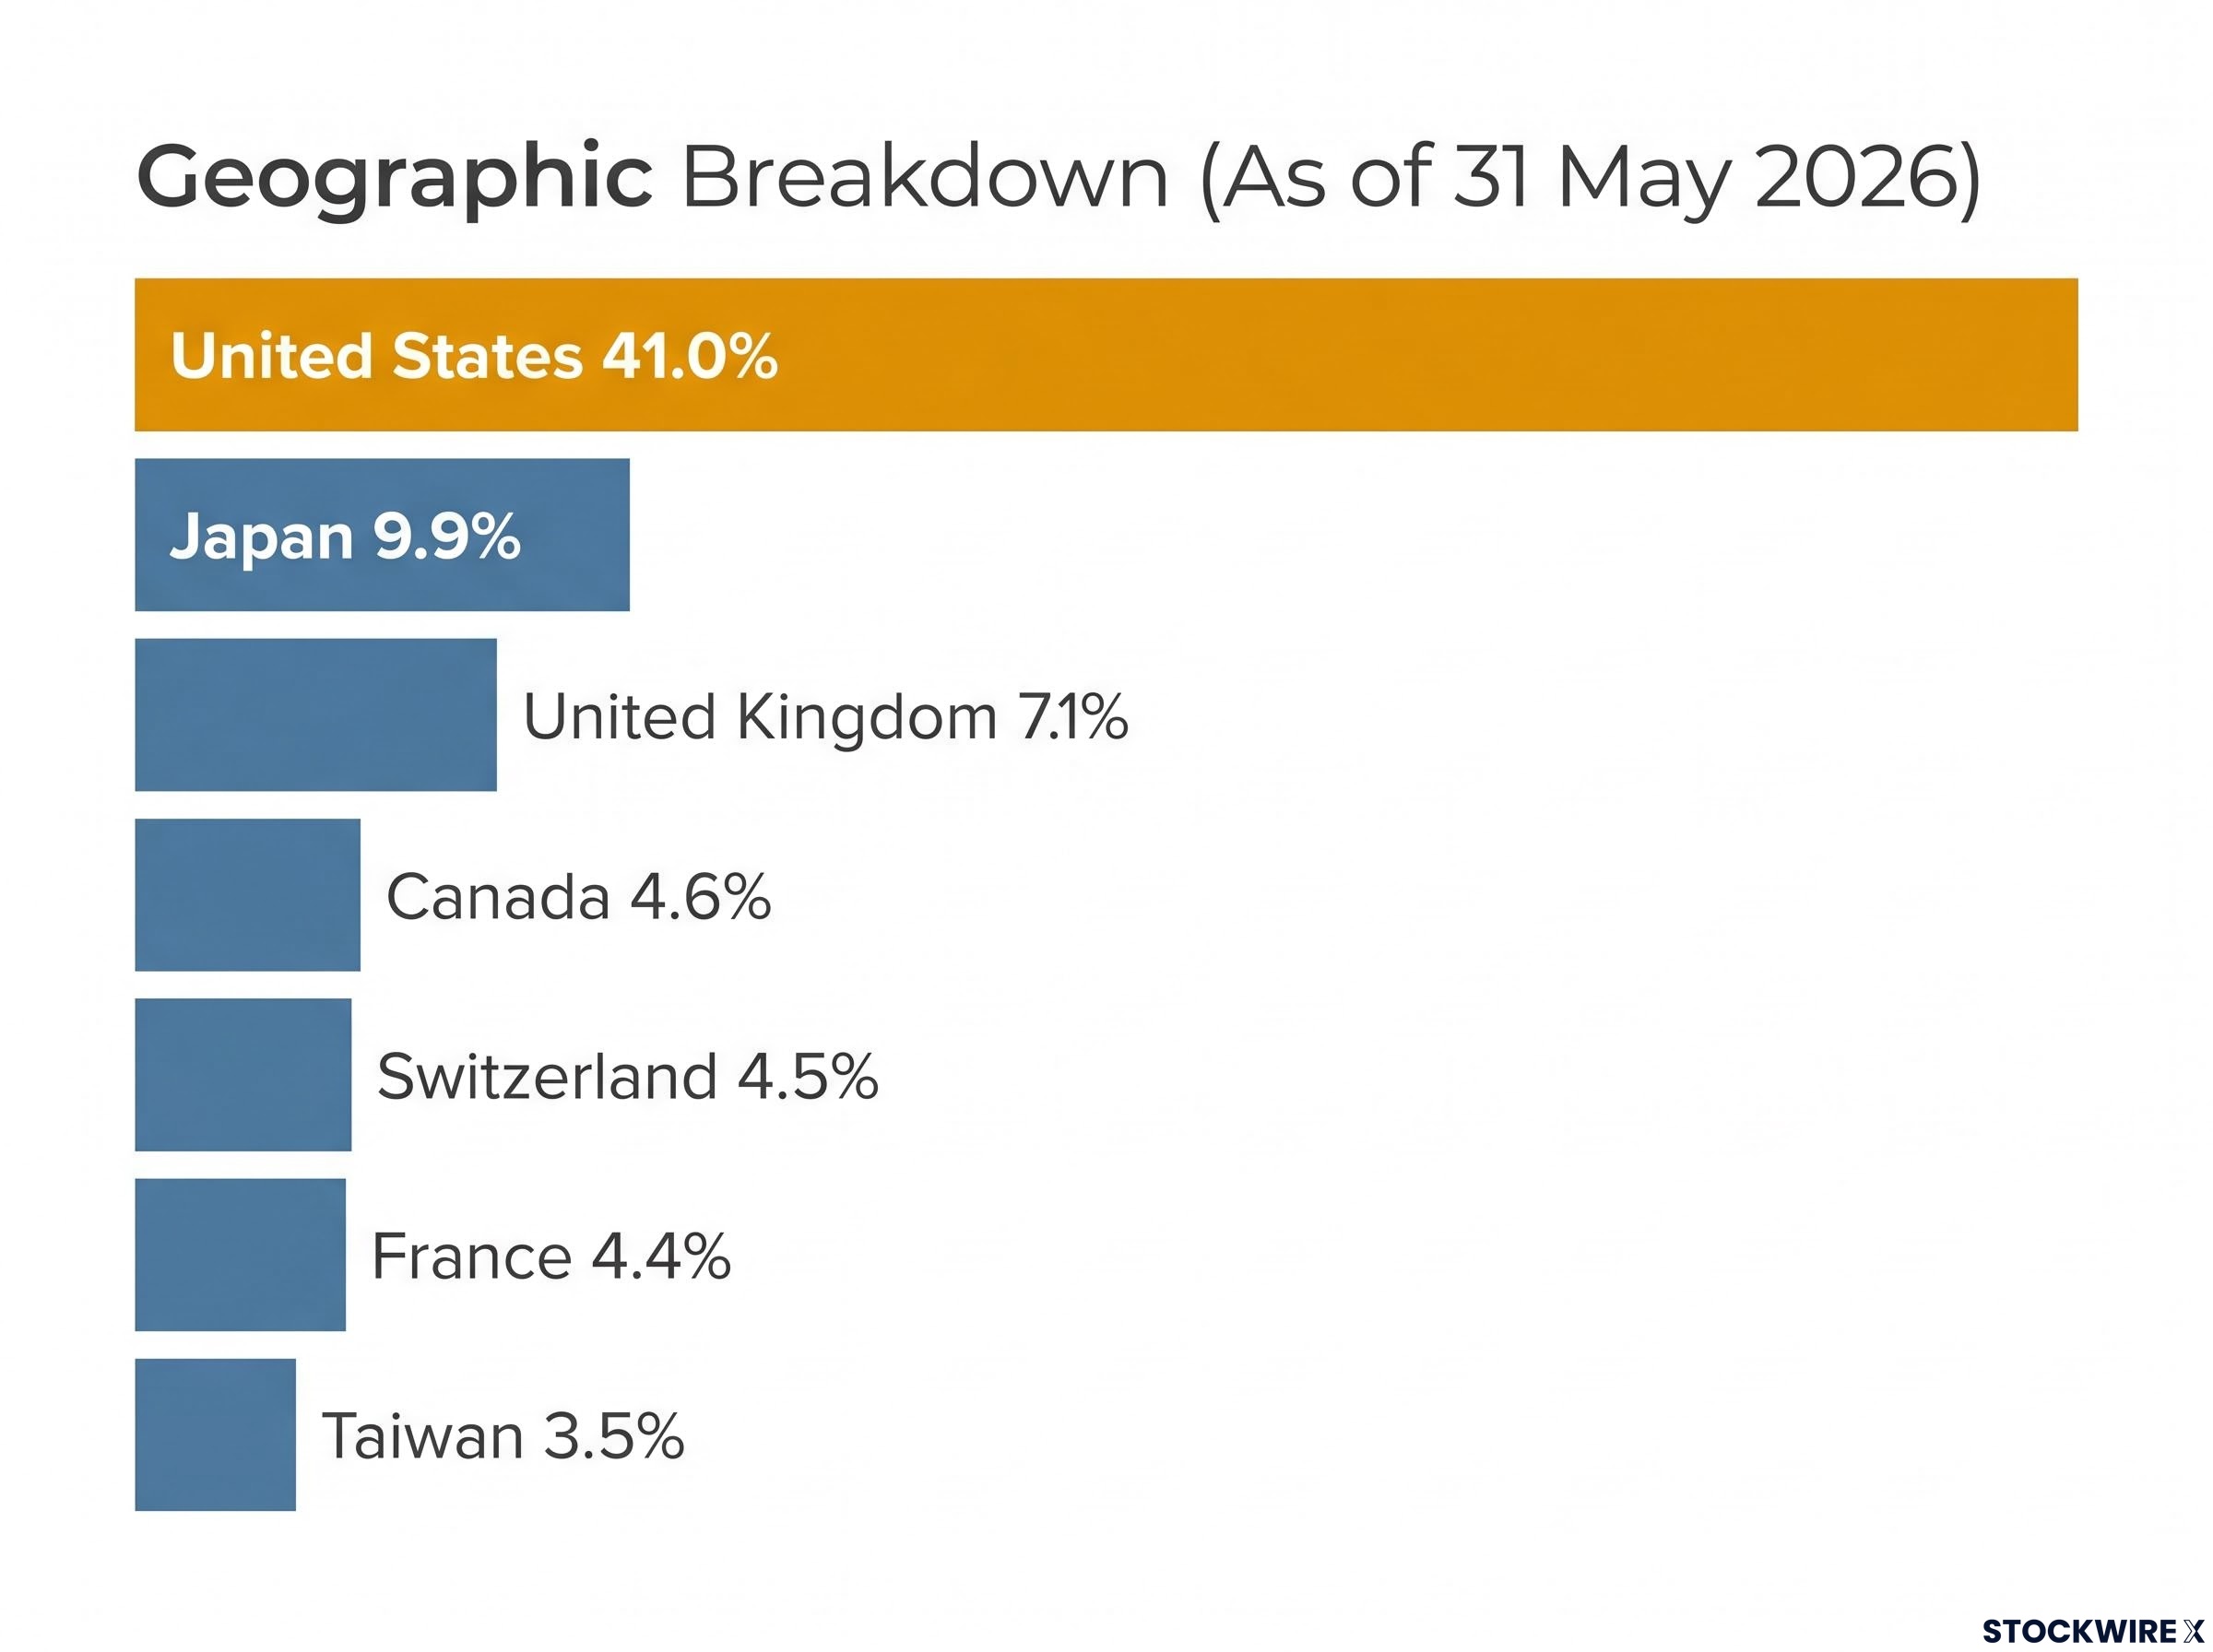
| Country | Weight (%) |
|---|---|
| United States | 41.0% |
| Japan | 9.9% |
| United Kingdom | 7.1% |
| Canada | 4.6% |
| Switzerland | 4.5% |
| France | 4.4% |
| Taiwan | 3.5% |
| Other | Remainder |
Japan, the United Kingdom, Canada, Switzerland, and France round out the top six, providing meaningful developed-market diversification beyond the U.S. That said, a 41% U.S. weighting is large enough to warrant scrutiny.
For investors already holding VGS or IVV, the 41% US weighting in VIHY creates the kind of overlapping ETF exposures that can quietly double a portfolio’s concentration in US equities while appearing as separate line items across two different fund mandates.
Key concentration signal: If you already hold VGS, IVV, or similar global ETFs, VIHY amplifies rather than offsets your U.S. equity exposure. Map this against your existing portfolio before sizing a position.
The number itself is straightforward. VIHY declared 49.49 cents per unit, with a record date of approximately 1 July 2026 and a payment date of 16 July 2026. Scaling that single quarterly figure across four periods produces an annualised total of $1.98 per unit. Dividing that by the unit price of $54.68 puts the implied annualised yield at approximately 3.62%.
Vanguard ETF distributions in FY26 reveal that the 16 July 2026 payment date VIHY shares with VAS and VGS reflects a coordinated Vanguard distribution cycle, with VAS paying approximately 48.99 cents and VGS paying approximately 81.54 cents per unit in the same payment round, giving investors a useful cross-fund benchmark for assessing VIHY’s 49.49-cent first payment.
Preliminary yield estimate: The 3.62% annualised figure is based on a single distribution and should be treated as a starting point for calibration, not a reliable income forecast.
That number deserves to be held at arm’s length. Four specific factors will cause quarterly payments to vary from here:
If you plan cash flow around 3.62% as a steady-state number, you are building an income model on a single data point. The figure could prove to be a floor, a ceiling, or a midpoint; the next two to three distributions will tell you which.
The most immediate risk is currency. VIHY is unhedged, which means both your capital value and your distributions move with the Australian dollar’s exchange rate against the USD, JPY, GBP, CAD, CHF, EUR, and TWD. If the AUD strengthens, your distributions shrink in AUD terms even if the underlying companies pay stable dividends in their local currencies. If the AUD weakens, you get a tailwind.
For retirees drawing income regularly, this creates cash-flow unpredictability that most domestic dividend ETFs do not introduce. It is the price of international diversification, and it is worth understanding before you buy rather than after your first unexpectedly low payment arrives.
VIHY’s distributions carry no franking credits, because all of its holdings are offshore companies. For tax-sensitive investors, this changes the maths considerably. A franked yield of 3.5-4.0% from a domestic ETF like VHY may outperform an unfranked 3.6% after tax, depending on your marginal tax rate. The comparison is not universal; it depends on your individual tax position.
Grossed-up yield comparisons rather than cash yield figures are the correct basis for that calculation, and for pension-phase SMSF members the gap between a fully franked domestic ETF and an unfranked international fund like VIHY is wider than any headline yield table suggests.
The four risk categories to weigh together are:
The combination of no franking, no currency hedging, and no track record means VIHY requires a higher tolerance for income variability than most domestic dividend ETFs. If you are in or near retirement, weigh that honestly against the diversification benefit.
VIHY is not a replacement for domestic franked-income ETFs. It occupies a different niche entirely.
Positioning: VIHY is a global income satellite designed to complement domestic core holdings, not substitute for them.
| Fund | ASX Code | Geographic Focus | Franking | Fee |
|---|---|---|---|---|
| Vanguard International High Yield | VIHY | Global ex-Australia | No | 0.30% p.a. |
| Vanguard Australian High Yield | VHY | Australia | Yes | 0.25% p.a. |
| BetaShares Australian High Yield | HYLD | Australia | Yes | Check provider |
| SPDR S&P Global Dividend | WDIV | Global | No | Check provider |
VHY and HYLD deliver franked Australian income. They are complements to VIHY, not competitors. WDIV is the closest structural peer, offering global dividend exposure through a single ASX-listed vehicle. Where VIHY may differentiate is in its index methodology: a forecast-yield focus, explicit REIT exclusion, and explicit Australia exclusion, all of which give it a cleaner separation from domestic holdings.
VHY turnover and tax drag data add a further dimension to that comparison: VHY’s annual portfolio turnover of approximately 21.5% generates recurring capital gains distributions that compound meaningfully against investors holding the fund outside superannuation, a cost the headline yield figure does not capture.
For investors already using VHY for domestic franked income, VIHY is the logical international extension under the same manager. The real question is not whether to choose between them but how much global income diversification your portfolio needs.
The structural design is coherent: low cost, forecast-yield methodology, REIT exclusion, Australia exclusion. The track record limitation is a timing issue, not a structural deficiency. If you understand that distinction, you can make a more calibrated decision about position sizing rather than treating VIHY as either all-in or off-limits.
Four signals will tell you more about VIHY’s income profile over the next 12-24 months, ordered by when each becomes available:
Key timing benchmark: A reliable 12-month yield figure will not be available until approximately mid-2027. Any annualised yield projection before then is a single-distribution estimate.
At a unit price of $54.68 and a first distribution of 49.49 cents, you have a baseline for tracking whether future payments confirm, exceed, or fall short of the 3.62% annualised estimate. Revisit your domestic-versus-international income allocation as that data builds, rather than treating your current split as permanent.
VIHY’s design logic is sound and its cost position is competitive. The question is not whether the fund is well constructed. It is whether you have enough evidence to size it with confidence, and that evidence is still accumulating.
This article is for informational purposes only and should not be considered financial advice. Investors should conduct their own research and consult with financial professionals before making investment decisions. Past performance does not guarantee future results.
VIHY is Vanguard's internationally focused high-dividend ETF listed on the ASX, launched in March 2026. It tracks the FTSE All-World ex Australia High Dividend Yield Net Tax Index, holding approximately 1,600 stocks across developed and emerging markets while excluding Australian shares and REITs entirely.
VIHY declared its first distribution of 49.49 cents per unit, with a payment date of 16 July 2026. Scaling that single quarterly figure to an annual basis and dividing by the unit price of $54.68 produces an implied annualised yield of approximately 3.62%, though this figure is based on one payment and should be treated as a starting estimate rather than a reliable income forecast.
No, VIHY pays no franking credits because all of its holdings are offshore companies. For tax-sensitive investors, a fully franked domestic ETF yielding 3.5-4.0% may outperform VIHY's unfranked 3.62% yield in after-tax terms, depending on marginal tax rate.
VHY focuses on Australian high-dividend shares and delivers franked income at a management fee of 0.25% per annum, while VIHY targets global ex-Australia dividend payers at 0.30% per annum with no franking and unhedged currency exposure. The two funds complement each other rather than compete, with VHY covering domestic franked income and VIHY extending that income base internationally.
The four key risks are unhedged currency exposure across USD, JPY, GBP, and other major currencies, which makes distributions unpredictable in AUD terms; no franking credits on any distributions; dividend and capital volatility across global markets in downturns; and a limited track record given VIHY only launched in March 2026 with a single distribution on record.