How to Protect Your Retirement From Sequence of Returns Risk
2 hrs ago
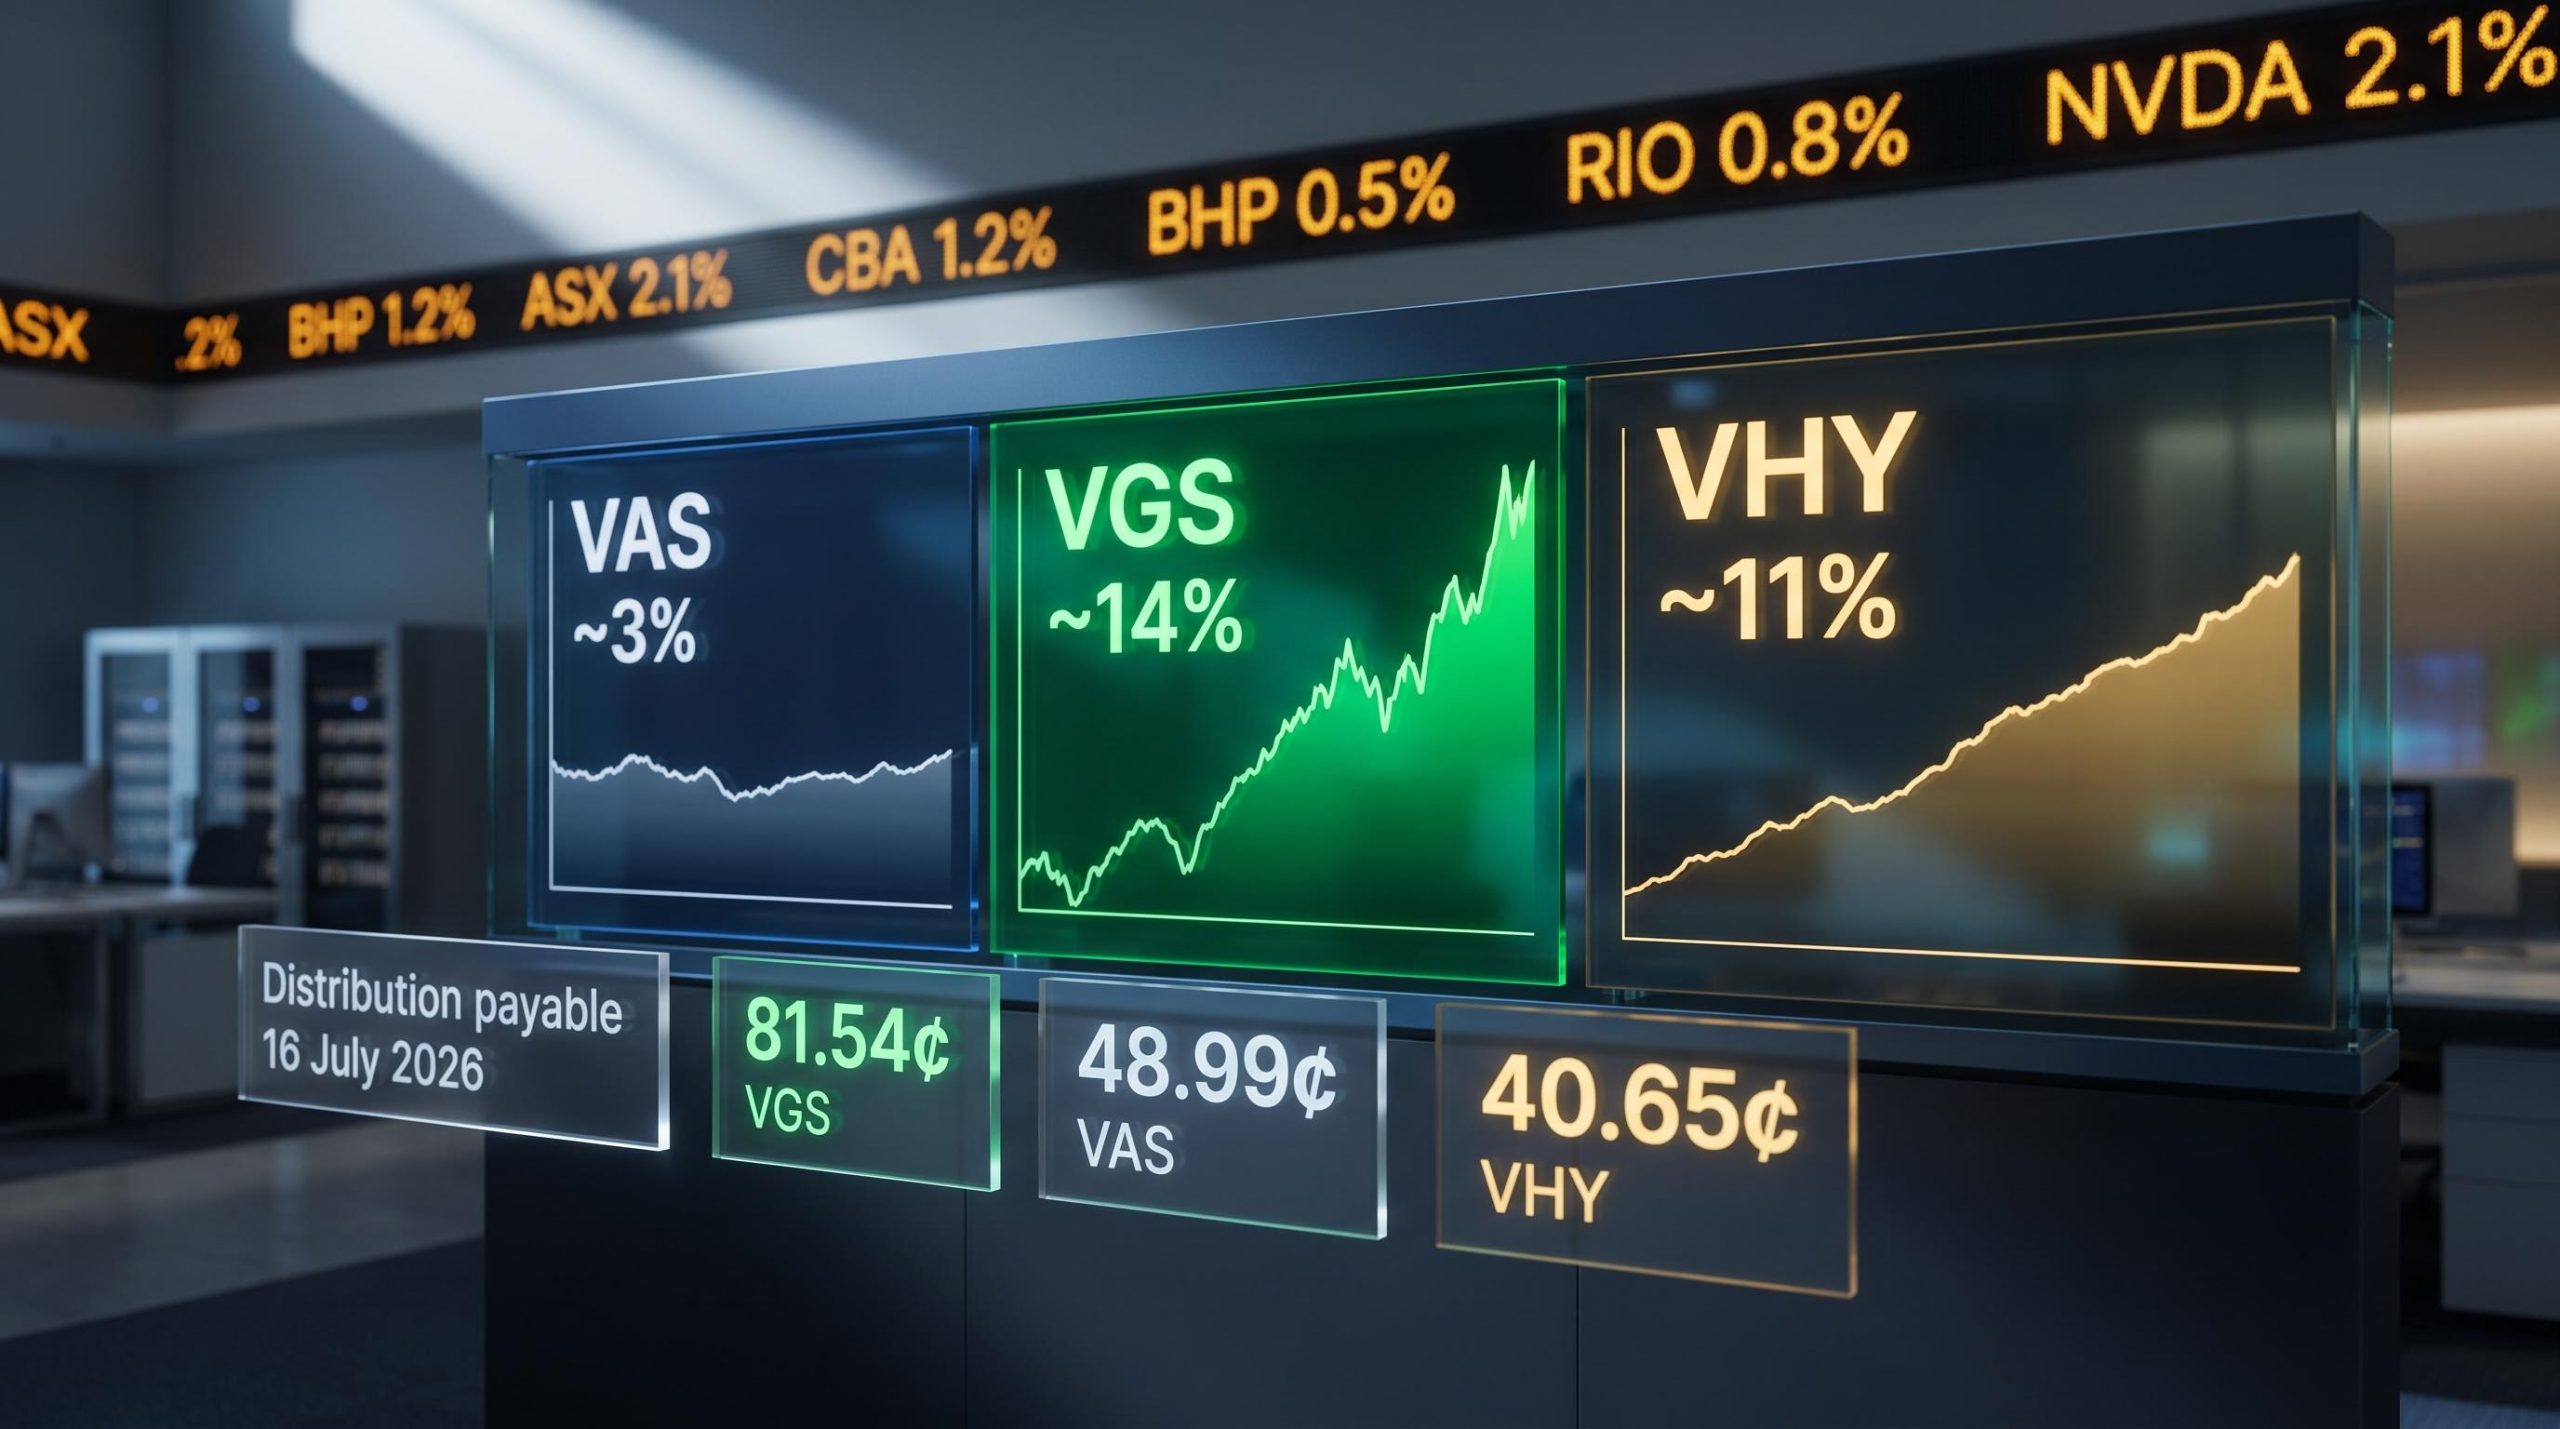
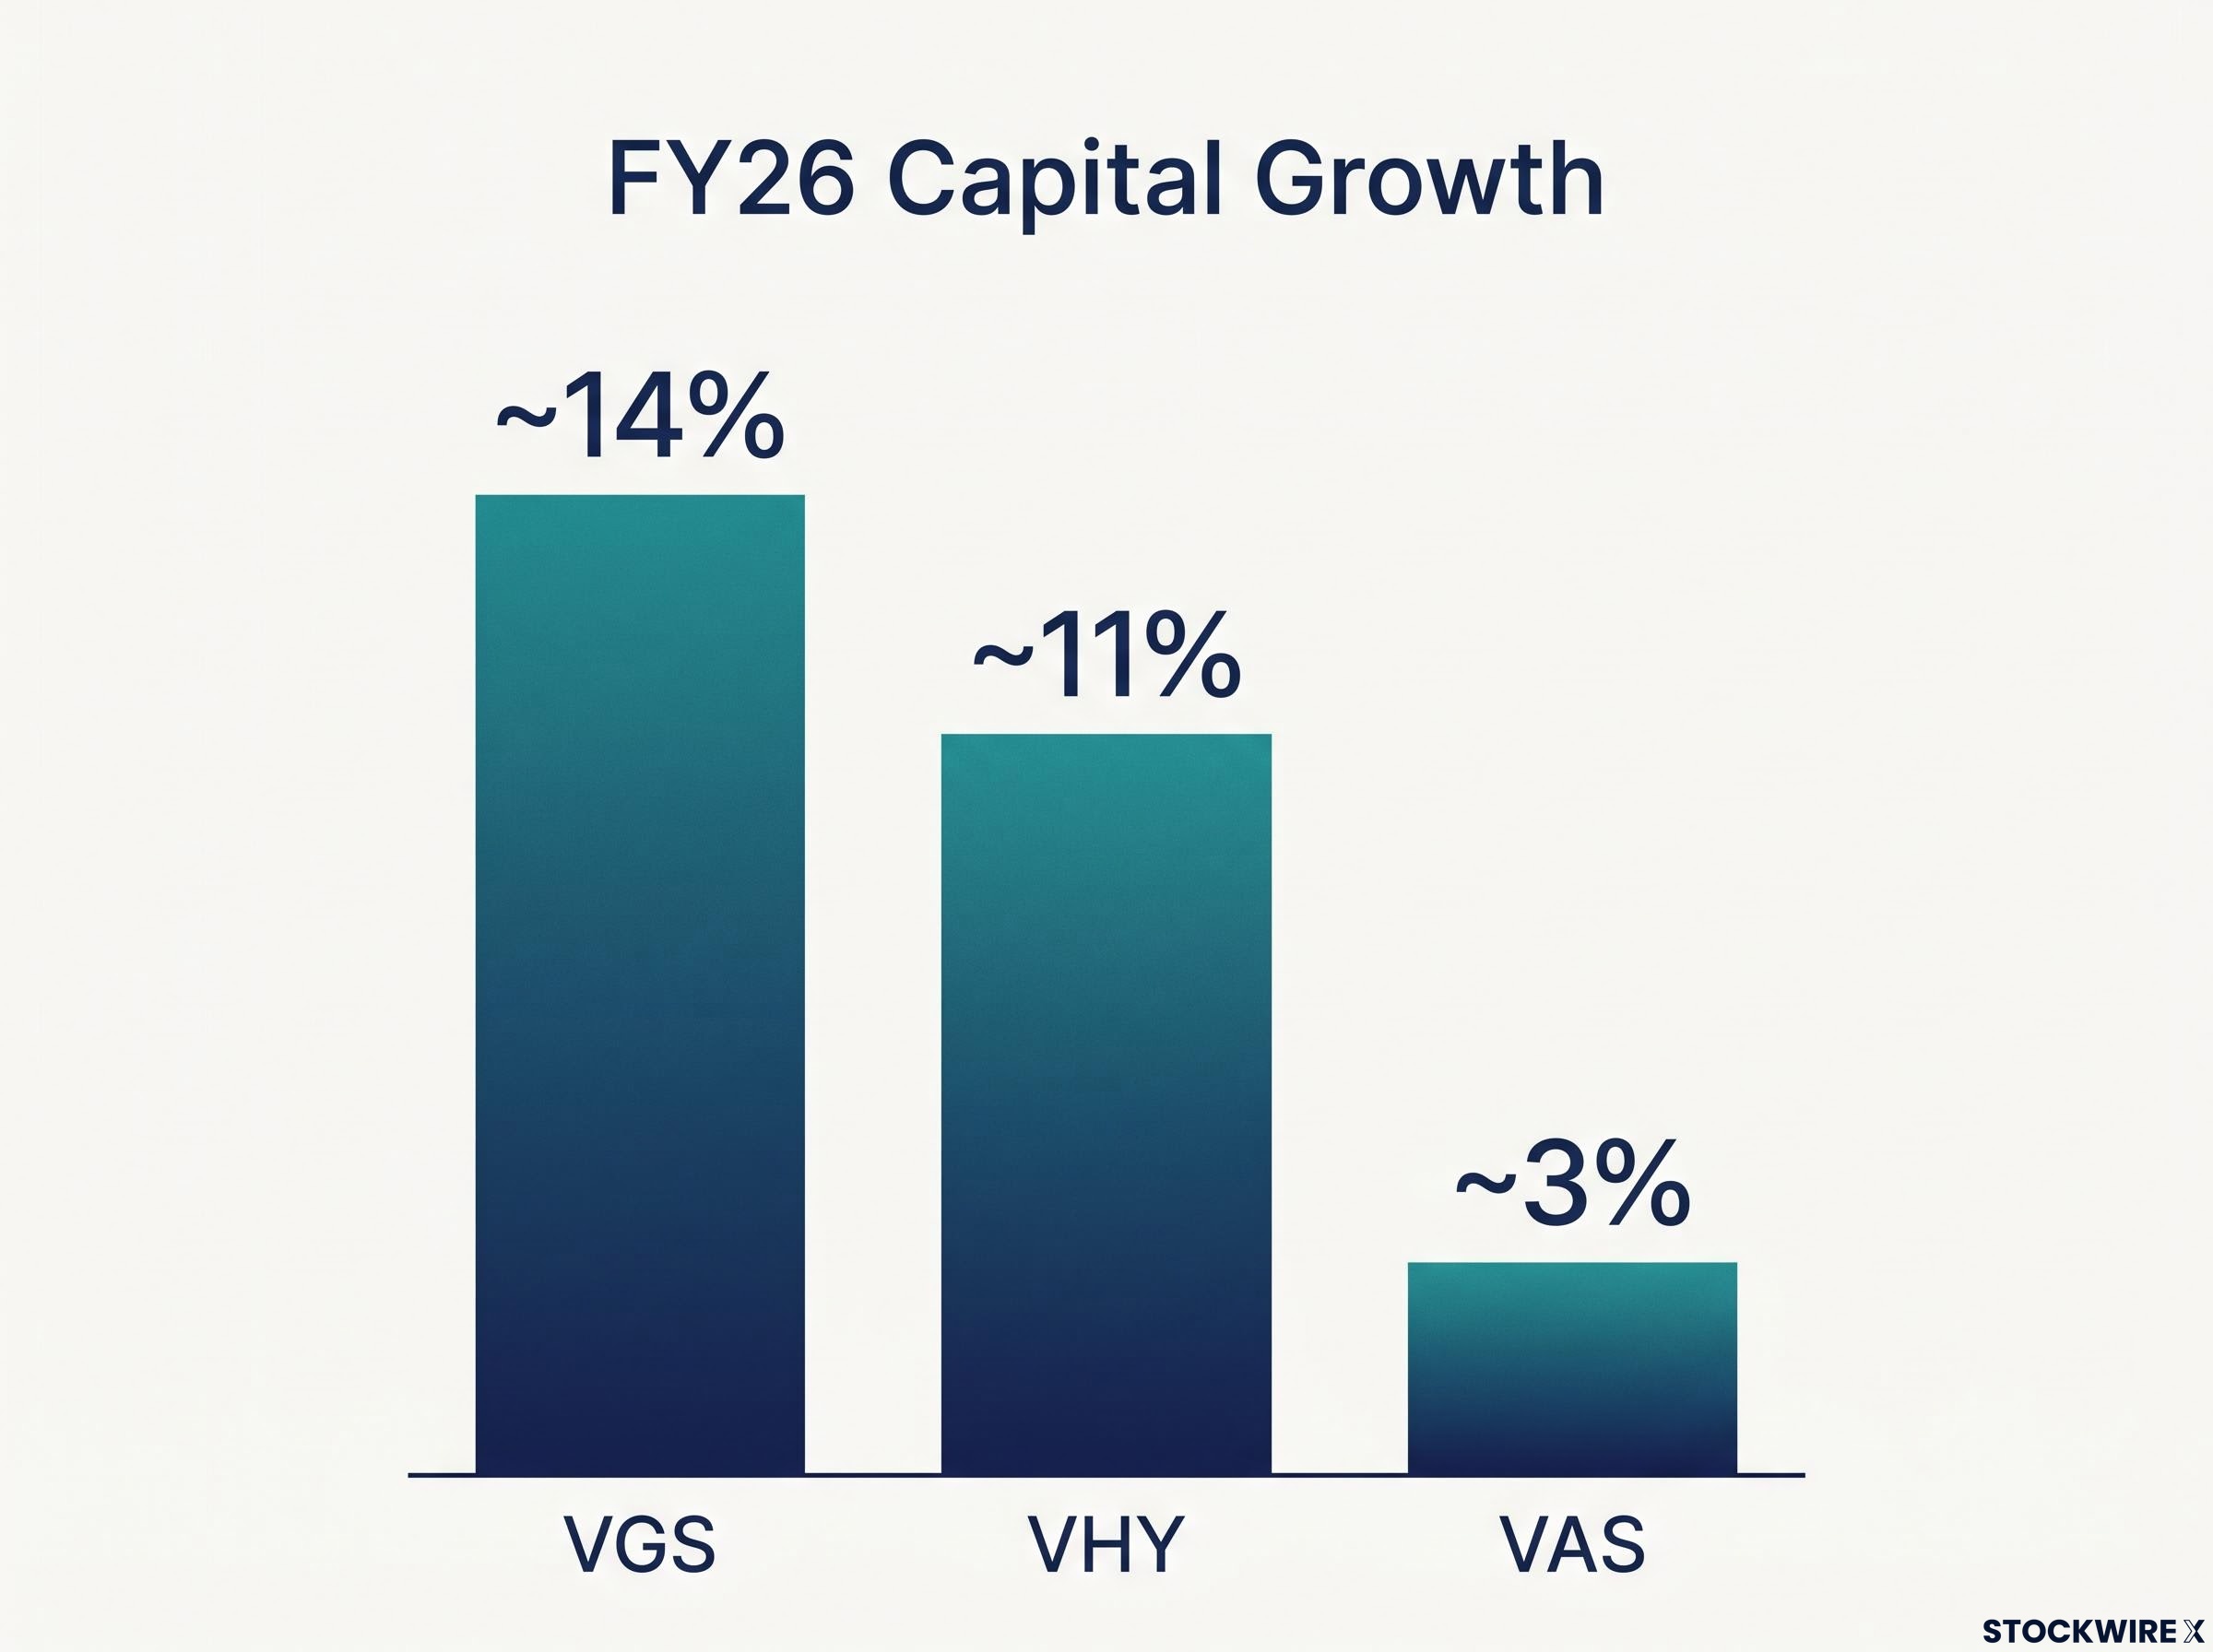
Three Vanguard ETFs finished FY26 in positive territory, but the gap between them tells a sharper story than the headline. VGS delivered approximately 14% capital growth. VHY returned roughly 11%. VAS managed around 3%. All three posted gains, yet the spread between best and worst was more than four to one.
That divergence matters right now because all three funds have distributions scheduled for payment on 16 July 2026. Before that cash lands in your account or reinvests through a DRP, you need to understand what each fund actually delivered and why.
Here is what the FY26 numbers tell you about which fund belongs in your portfolio, whether you are chasing growth, drawing income, or building a long-term blend of both.
Of the three flagship Vanguard ETFs listed on the ASX, VGS produced the strongest capital result in FY26, gaining approximately ~14%.
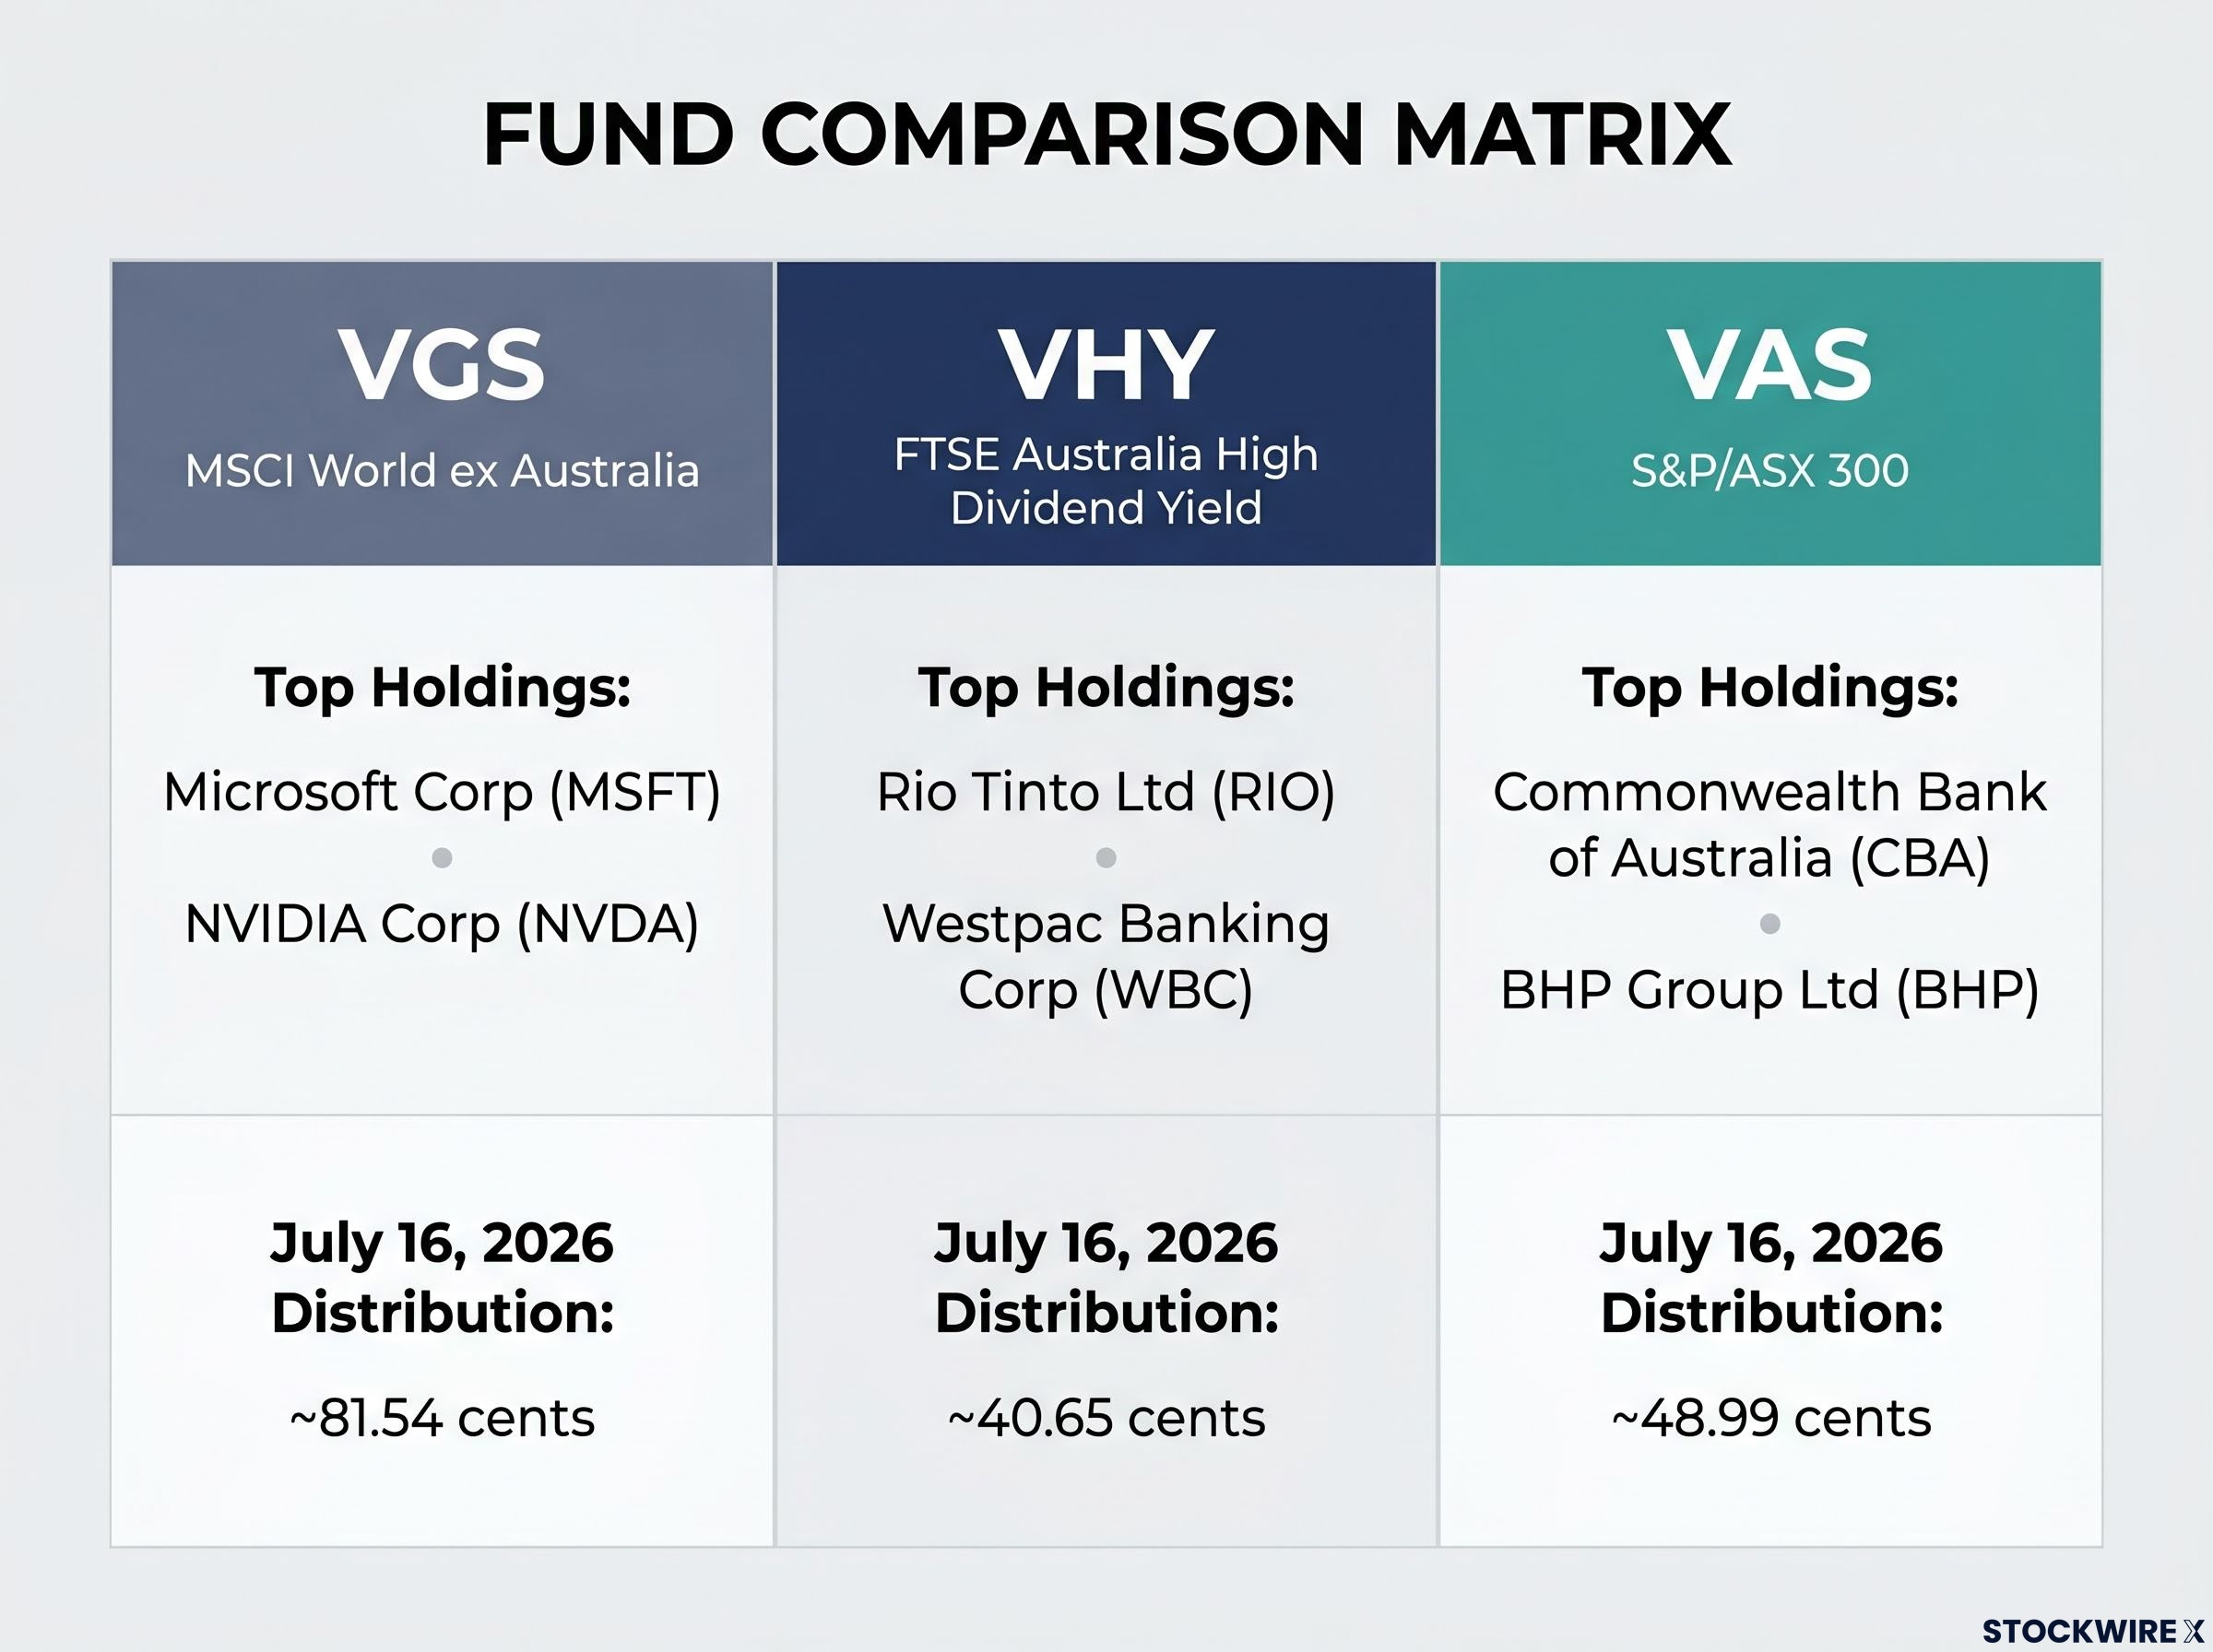
That figure was not an accident. VGS tracks the MSCI World ex Australia Index, a benchmark covering more than 1,300 large and mid-cap developed-market companies in countries other than Australia. Among its leading positions are Microsoft Corp (NASDAQ: MSFT) and NVIDIA Corp (NASDAQ: NVDA), two of the stocks most directly linked to sustained investor demand for artificial intelligence infrastructure and applications.
The AI-driven rally in global technology names gave VGS a tailwind that neither of its domestically focused stablemates could match. The fund’s distribution for FY26 is approximately 81.54 cents per unit (some sources report 80.11 cents per unit; investors should verify the confirmed figure directly with Vanguard), payable 16 July 2026.
For Australian investors whose portfolios lean heavily toward domestic equities, VGS’s result makes the cost of that home bias visible: holding no international exposure in FY26 meant leaving the majority of this cycle’s equity growth on the table. That positions VGS as a portfolio diversifier, not a satellite bet.
VGS leads the peer group on combined cost and liquidity among global ETF options on the ASX, recording average daily traded values above $27 million and a bid-ask spread below 0.05%, metrics that matter in practical terms for investors dollar-cost averaging or managing positions above $100,000.
Income-first ETFs carry a reputation for modest capital returns. The logic sounds reasonable: a fund screening for high-dividend payers is presumably buying mature, slower-growing businesses. VHY spent FY26 dismantling that assumption.
The fund returned approximately 11% in capital growth, a result that would look strong for any equity ETF, let alone one whose primary mandate is yield.
VHY’s FY26 distribution is approximately 40.65 cents per unit (some sources report 40.82 cents per unit; confirm with Vanguard before relying on the figure), payable 16 July 2026.
Income-focused investors who stayed in VHY through FY26 did not have to sacrifice growth for yield. They got both. That directly challenges the trade-off framing many investors apply to income ETFs, and it makes VHY’s quarterly distribution schedule a genuine dual-purpose tool for retirees and others drawing regular cash flow.
A 3% capital return sits well below what VGS and VHY delivered. Read in isolation, that number looks like underperformance. Read in context, it tells a different story.
VAS follows the S&P/ASX 300, giving investors broad exposure across roughly 300 of Australia’s biggest listed companies, with significant weight in the financial and resources sectors. The fund’s largest positions include Commonwealth Bank of Australia (ASX: CBA) and BHP Group Ltd (ASX: BHP). The Australian market simply did not keep pace with global peers in FY26, and VAS’s result reflects that market-level dynamic rather than a fund-level failure.
Franking credits on Australian-sourced income are the feature that neither VGS nor VHY can fully replicate for Australian tax residents. This makes VAS’s after-tax total return materially better than the headline capital growth figure suggests.
Franking credit calculations follow the standard 30/70 formula applied to the corporate tax already paid by the distributing company, meaning a $1,000 fully franked distribution is worth $1,428.57 to an SMSF in pension phase or an eligible low-income retiree once the ATO refunds the attached credit as cash.
The fund’s FY26 distribution is approximately 48.99 cents per unit (some sources report 48.83 cents per unit; verify with Vanguard), payable 16 July 2026.
Comparing VAS to VGS on capital return alone misses a significant part of the picture. VAS functions as the domestic foundation of a diversified ETF portfolio, and its combination of broad market exposure, reliable distributions, and franking credit eligibility ensures it retains a role that the other two funds cannot fill.
The FY26 performance gap between these three funds is not a verdict on quality. It is a reflection of three different mandates responding to three different market conditions.
Each fund tracks a different index, holds different companies, and serves a different purpose in your portfolio. VAS gives you broad domestic exposure across roughly 300 Australian companies. VGS gives you international reach across more than 1,300 developed-market companies outside Australia. VHY screens specifically for Australian companies projected to pay above-average dividends, which means its holdings differ meaningfully from the broader domestic market that VAS tracks.
That structural difference is exactly what produced the divergence: VGS ~14%, VHY ~11%, VAS ~3%. The ranking does not mean VAS failed or that VGS is always the better fund. It tells you which underlying markets and sectors drove returns in this particular year.
| Fund | Index tracked | FY26 capital return | Primary role | Distribution (July 2026) |
|---|---|---|---|---|
| VAS | S&P/ASX 300 | ~3% | Domestic broad market, income and franking | ~48.99 cents per unit |
| VGS | MSCI World ex Australia | ~14% | International growth and diversification | ~81.54 cents per unit |
| VHY | FTSE Australia High Dividend Yield | ~11% | High-yield Australian equities, income focus | ~40.65 cents per unit |
Holding all three creates a blended exposure spanning domestic, international, and income dimensions. Your allocation decision should be anchored in your own goals rather than trailing performance from any single year.
The three-fund comparison sorts naturally into three investor profiles:
The grossed-up yield advantage of Australian equity income extends furthest for retirees and SMSFs in pension phase, where a 6% fully franked distribution can equate to approximately 8.5% on a grossed-up basis, a spread that comfortably exceeds current term deposit rates and compounds the case for holding VAS and VHY through income-drawing phases.
The most widely cited starting point for portfolio allocation across VAS and VGS is a 40/40/20 split with a technology-focused international ETF, a structure that pairs the domestic income and franking advantages of VAS with the international growth exposure that VGS’s FY26 result made visible.
Before the 16 July 2026 payment date, confirm these practical details:
This article is for informational purposes only and should not be considered financial advice. Investors should conduct their own research and consult with financial professionals before making investment decisions. Past performance does not guarantee future results.
VGS is the Vanguard MSCI World ex Australia ETF, tracking more than 1,300 large and mid-cap developed-market companies outside Australia. It outperformed VAS and VHY in FY26 with approximately 14% capital growth because its largest holdings, including Microsoft and NVIDIA, were direct beneficiaries of the AI-driven global technology rally.
All three funds have distributions scheduled for payment on 16 July 2026: VAS is approximately 48.99 cents per unit, VGS is approximately 81.54 cents per unit, and VHY is approximately 40.65 cents per unit. Investors should verify final confirmed figures directly with Vanguard before making decisions.
VAS holds Australian companies that pay fully franked dividends, meaning the ATO refunds corporate tax already paid by those companies to eligible investors. For an SMSF in pension phase, a fully franked distribution worth $1,000 can deliver $1,428.57 in after-tax value once the franking credit is refunded, which materially improves VAS's total return beyond the headline 3% capital growth figure.
VAS tracks the S&P/ASX 300 and provides broad domestic exposure with franking credit eligibility, paying distributions that include a wide cross-section of Australian companies. VHY specifically screens for Australian stocks projected to pay above-average dividends and pays quarterly, making it a more targeted income tool; in FY26 it also delivered approximately 11% capital growth alongside its yield mandate.
The most widely cited starting framework pairs VAS for domestic income and franking, VGS for international growth, and a technology-focused ETF in a 40/40/20 split. Adding VHY to this structure provides a quarterly income tilt; the right blend depends on whether your priority is growth, regular cash flow, or a combination of both.