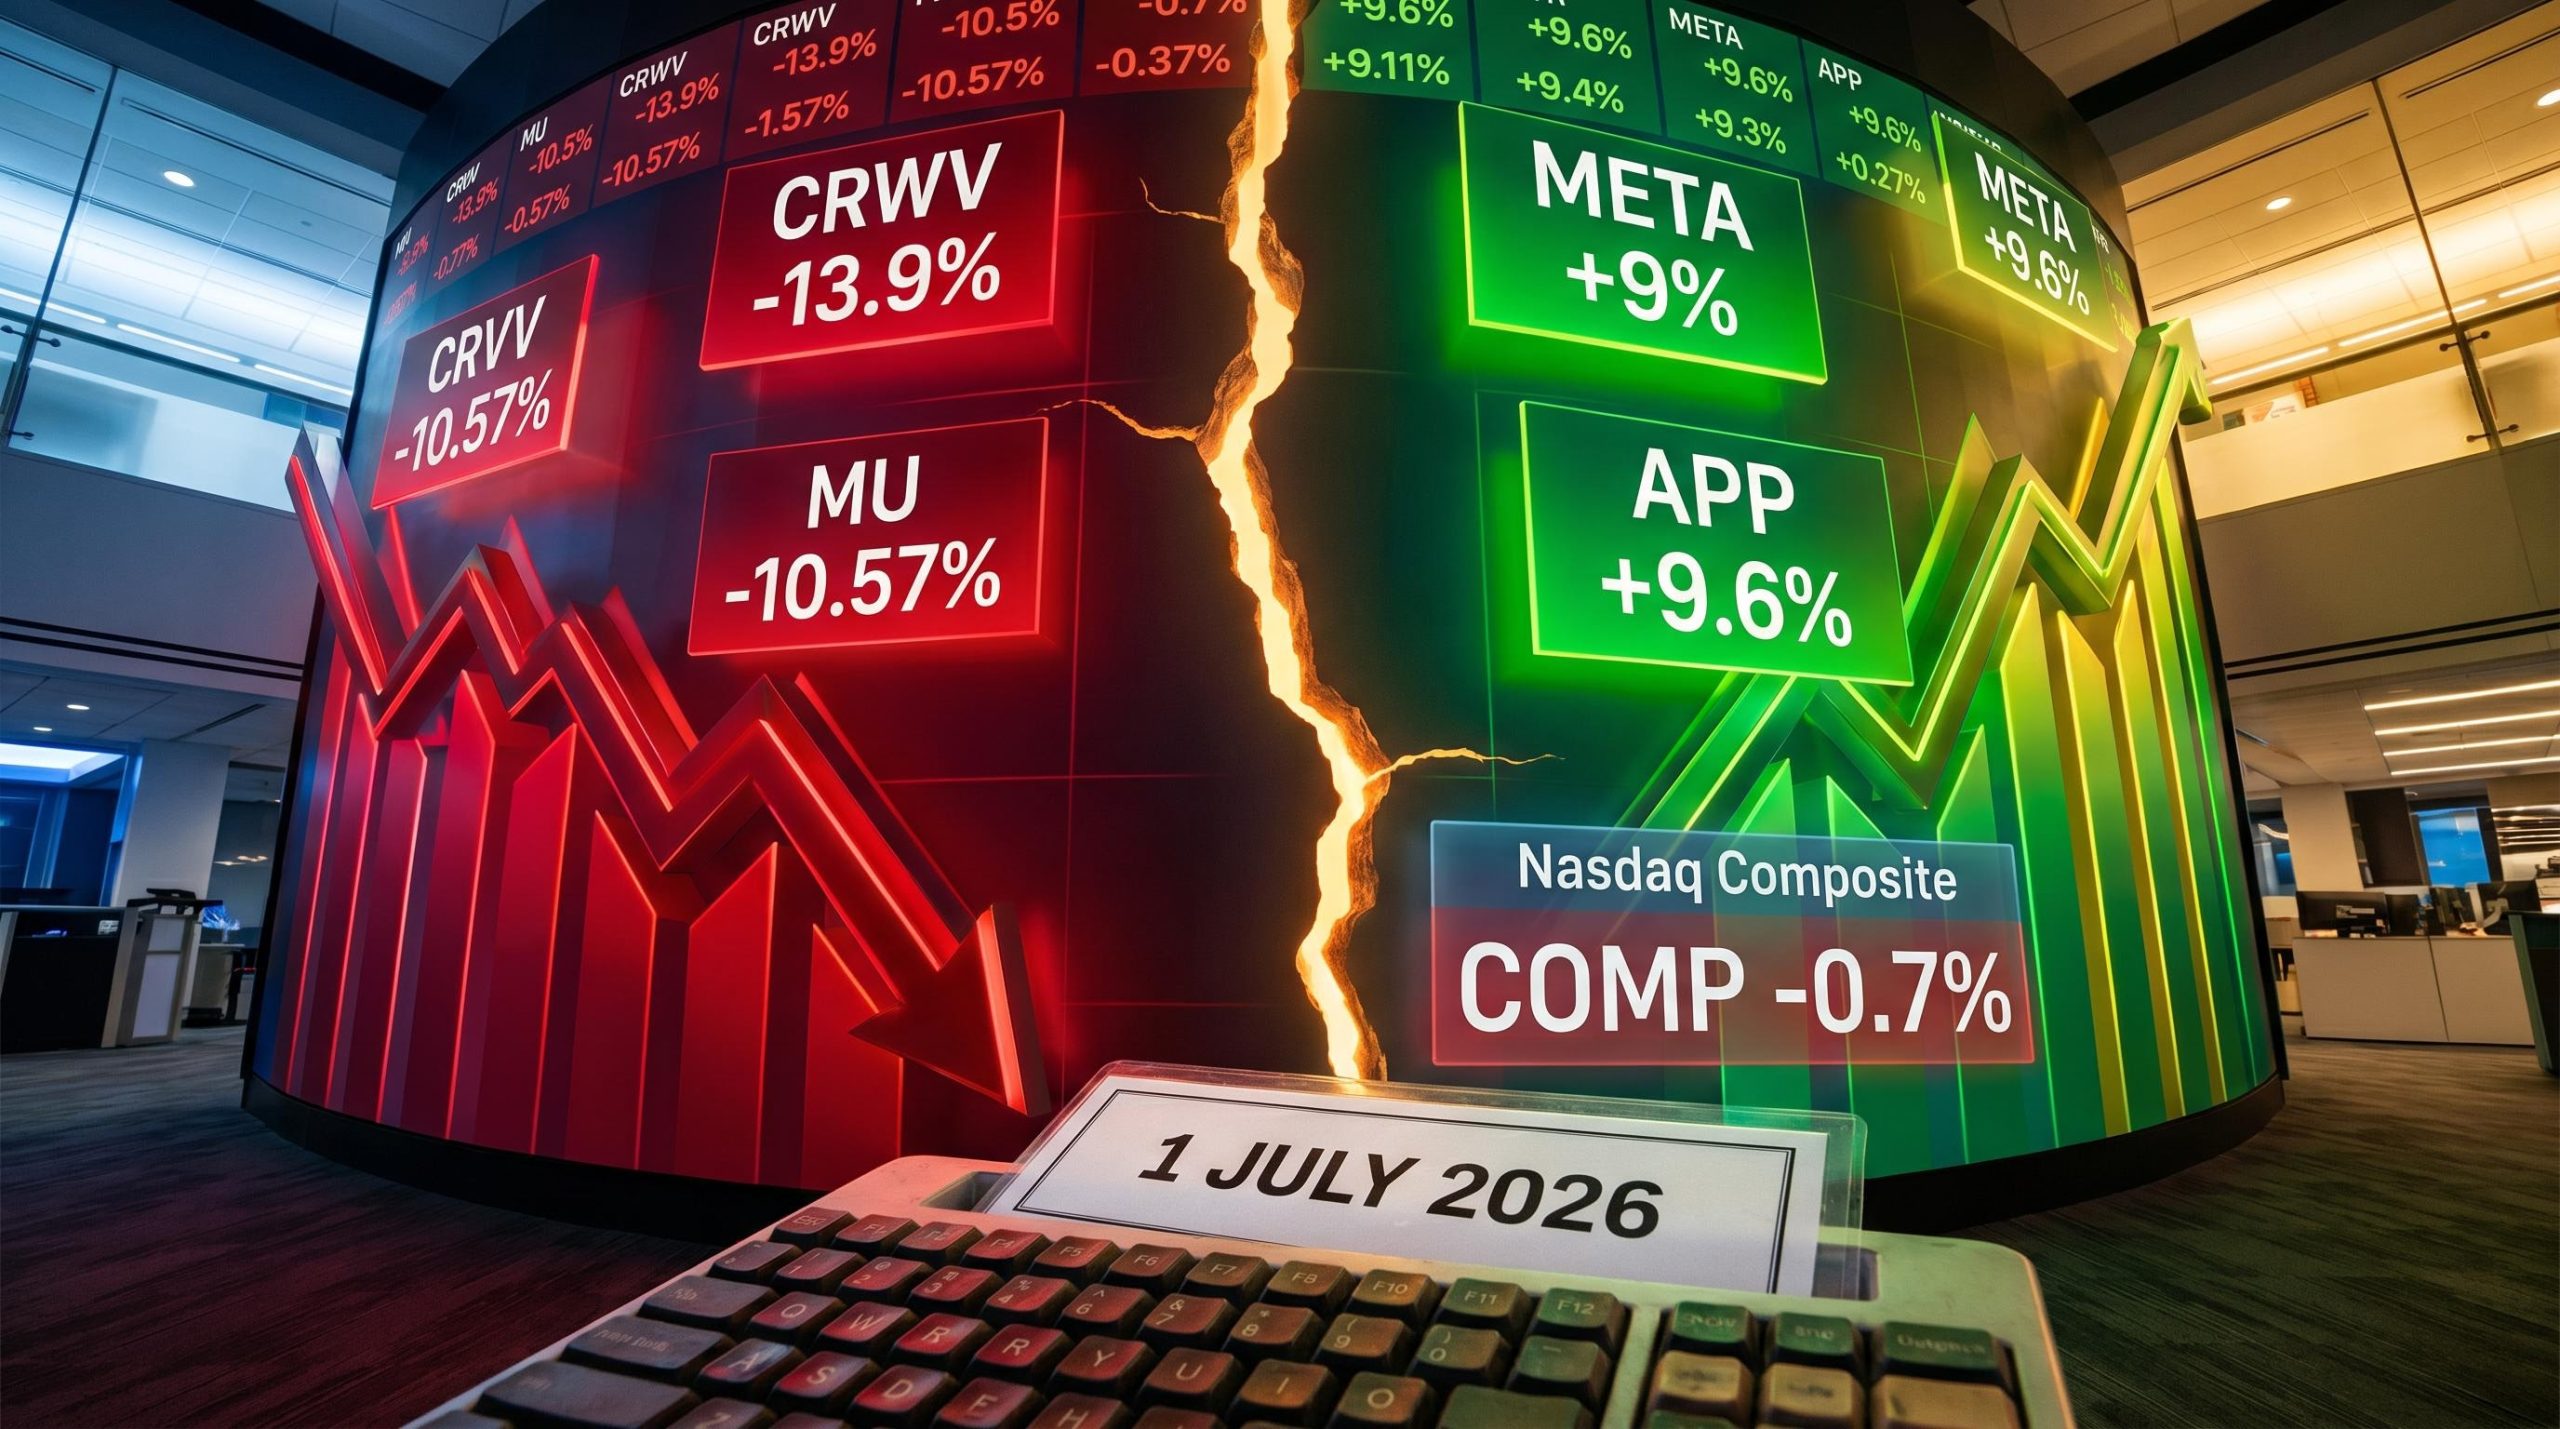
AI Stocks Split in Two as CoreWeave Falls 14% and Meta Surges 9%
25 mins ago
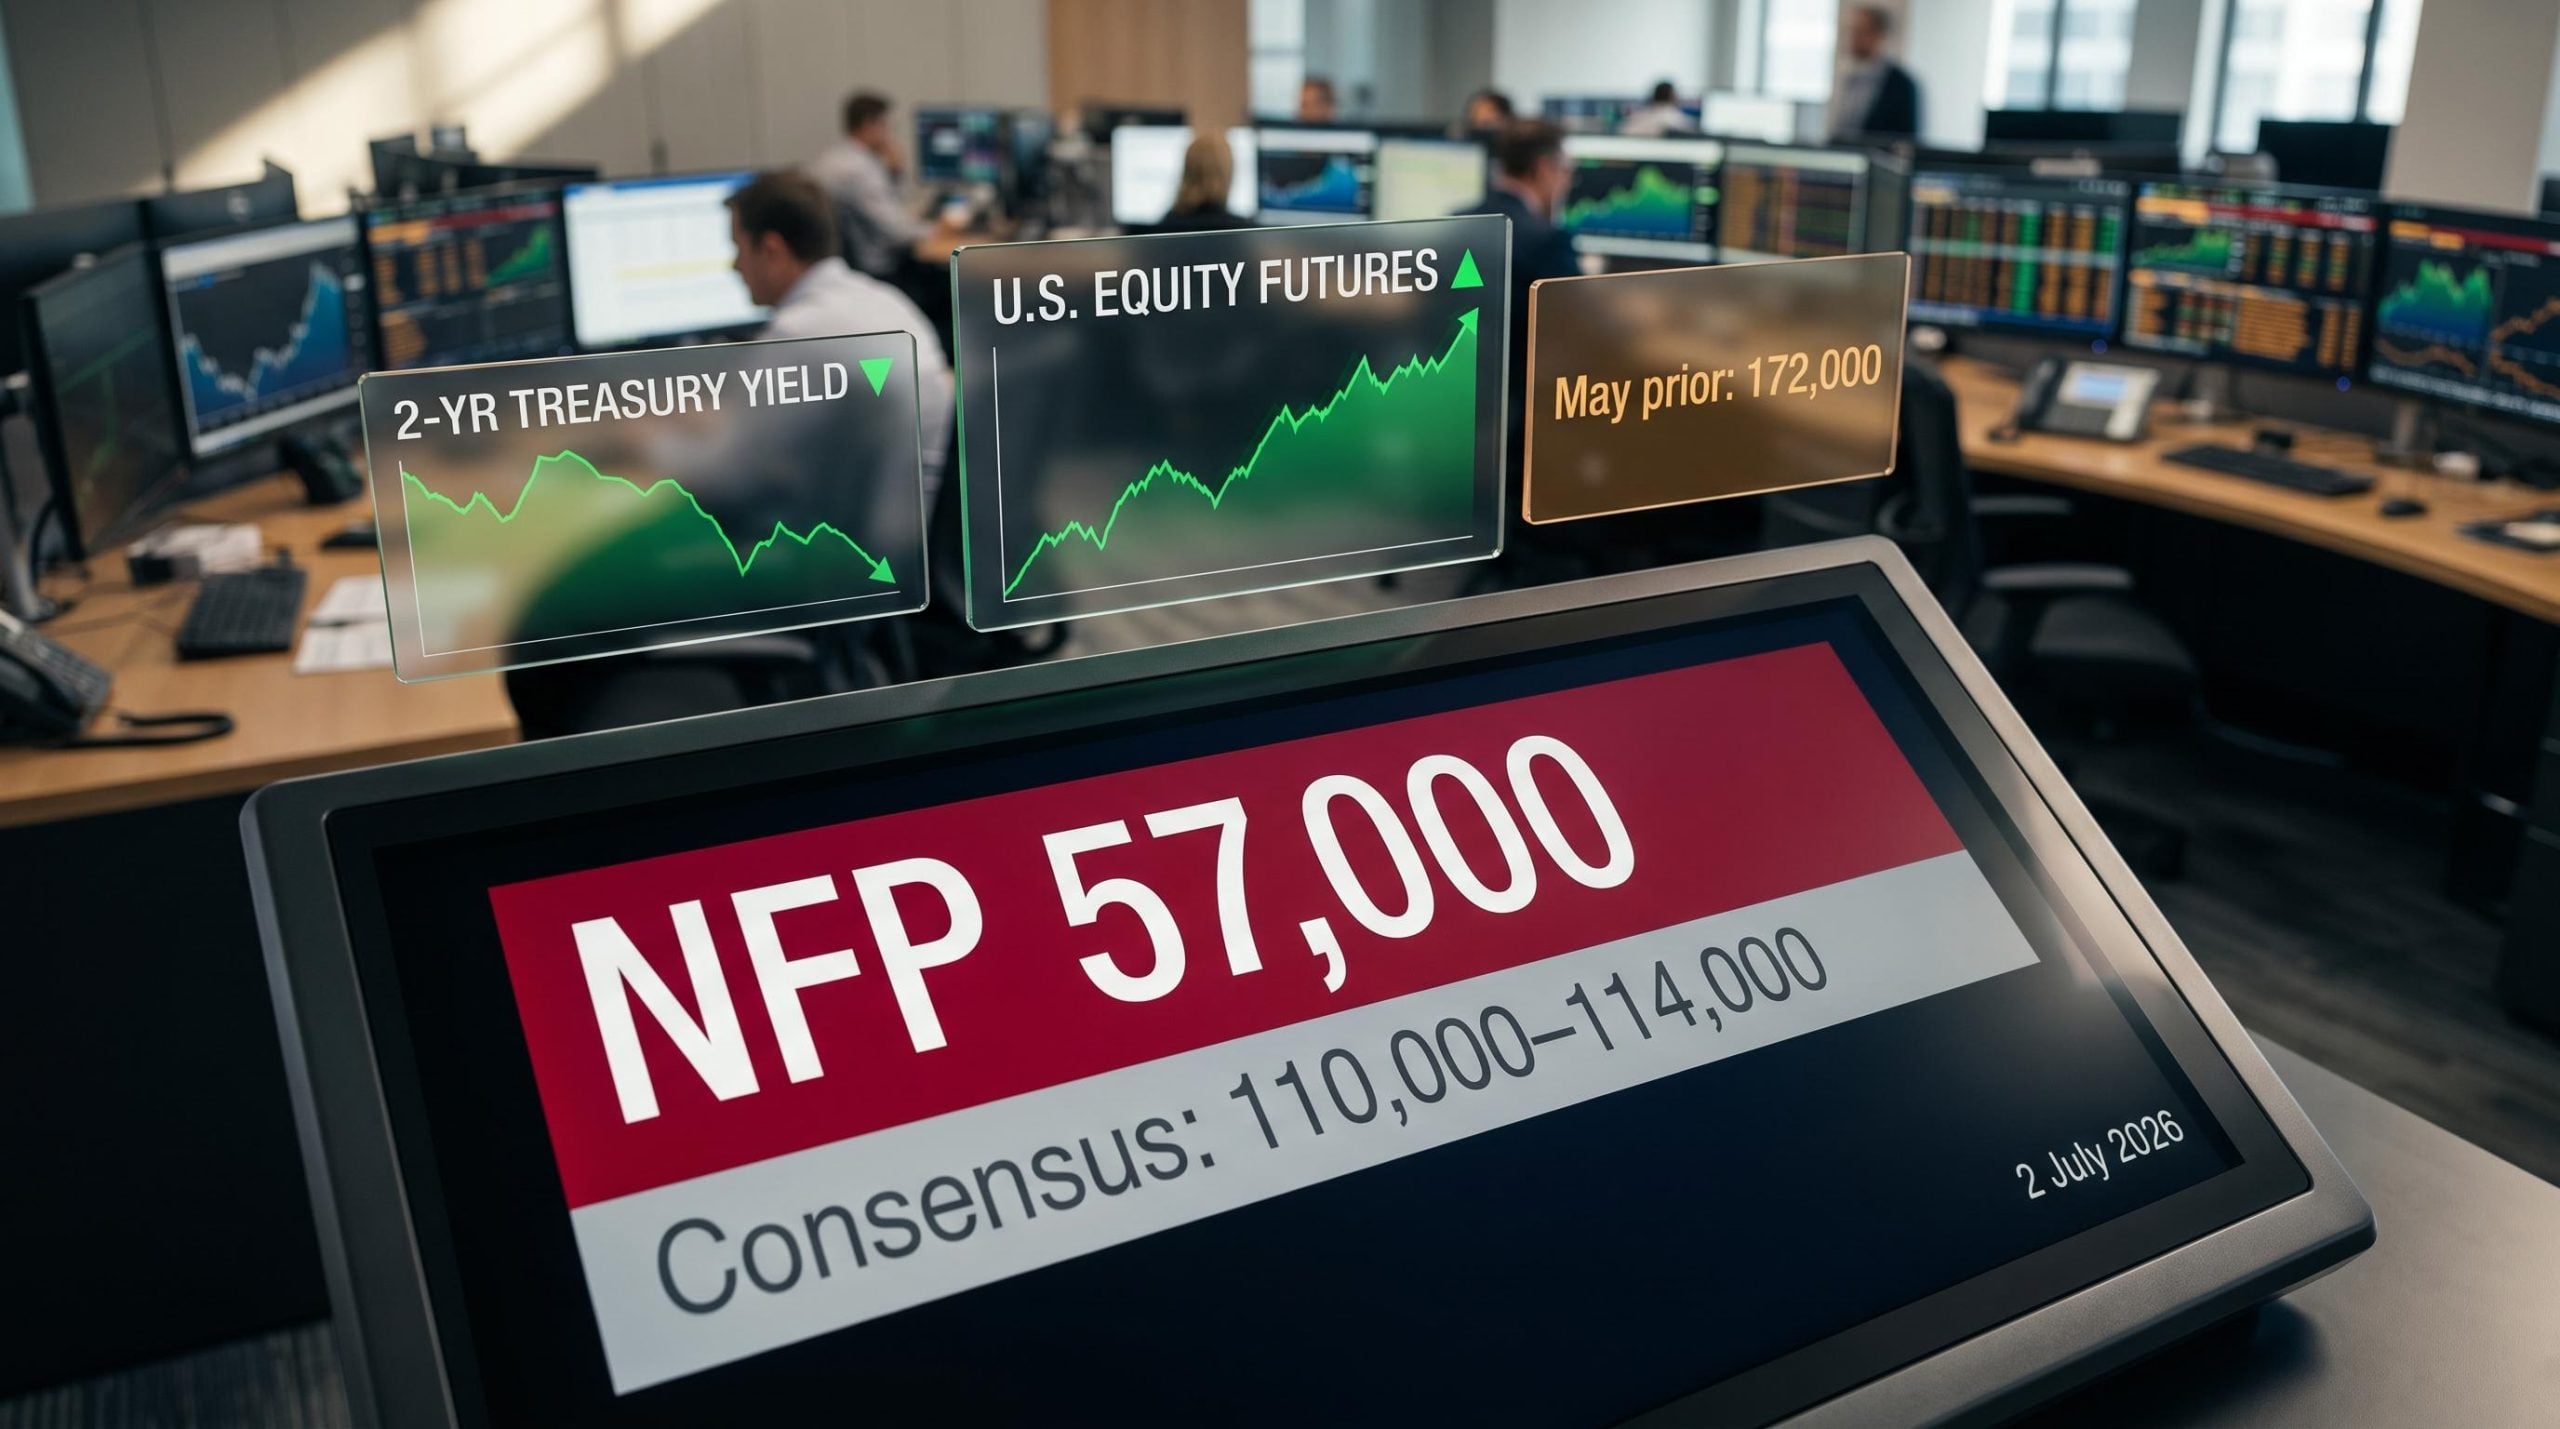
June’s BLS figures showed the U.S. economy generated just 57,000 jobs, a result that landed well below the consensus forecast of around 110,000 to 114,000, according to data published today, 2 July 2026. The gap between those two numbers is not a rounding error. It is the kind of miss that forces a real-time reassessment of where the Federal Reserve goes next.
Equity futures climbed. Treasury yields fell. Oil prices dropped. None of those moves happened in isolation. Each one is a link in a mechanical chain that starts with today’s payrolls number and ends at the discount rate embedded in every stock price on your screen.
Here is the full chain, mapped link by link: from the data itself, through the Fed repricing, into the bond and equity mechanics, and out to the sectors and assets where today’s move lands hardest. Once you see how these links connect, you can read any future nonfarm payrolls (NFP) release and know immediately which direction markets should move, and why.
57,000 jobs. That is all the U.S. economy produced in June, less than half of the lowest consensus estimate.
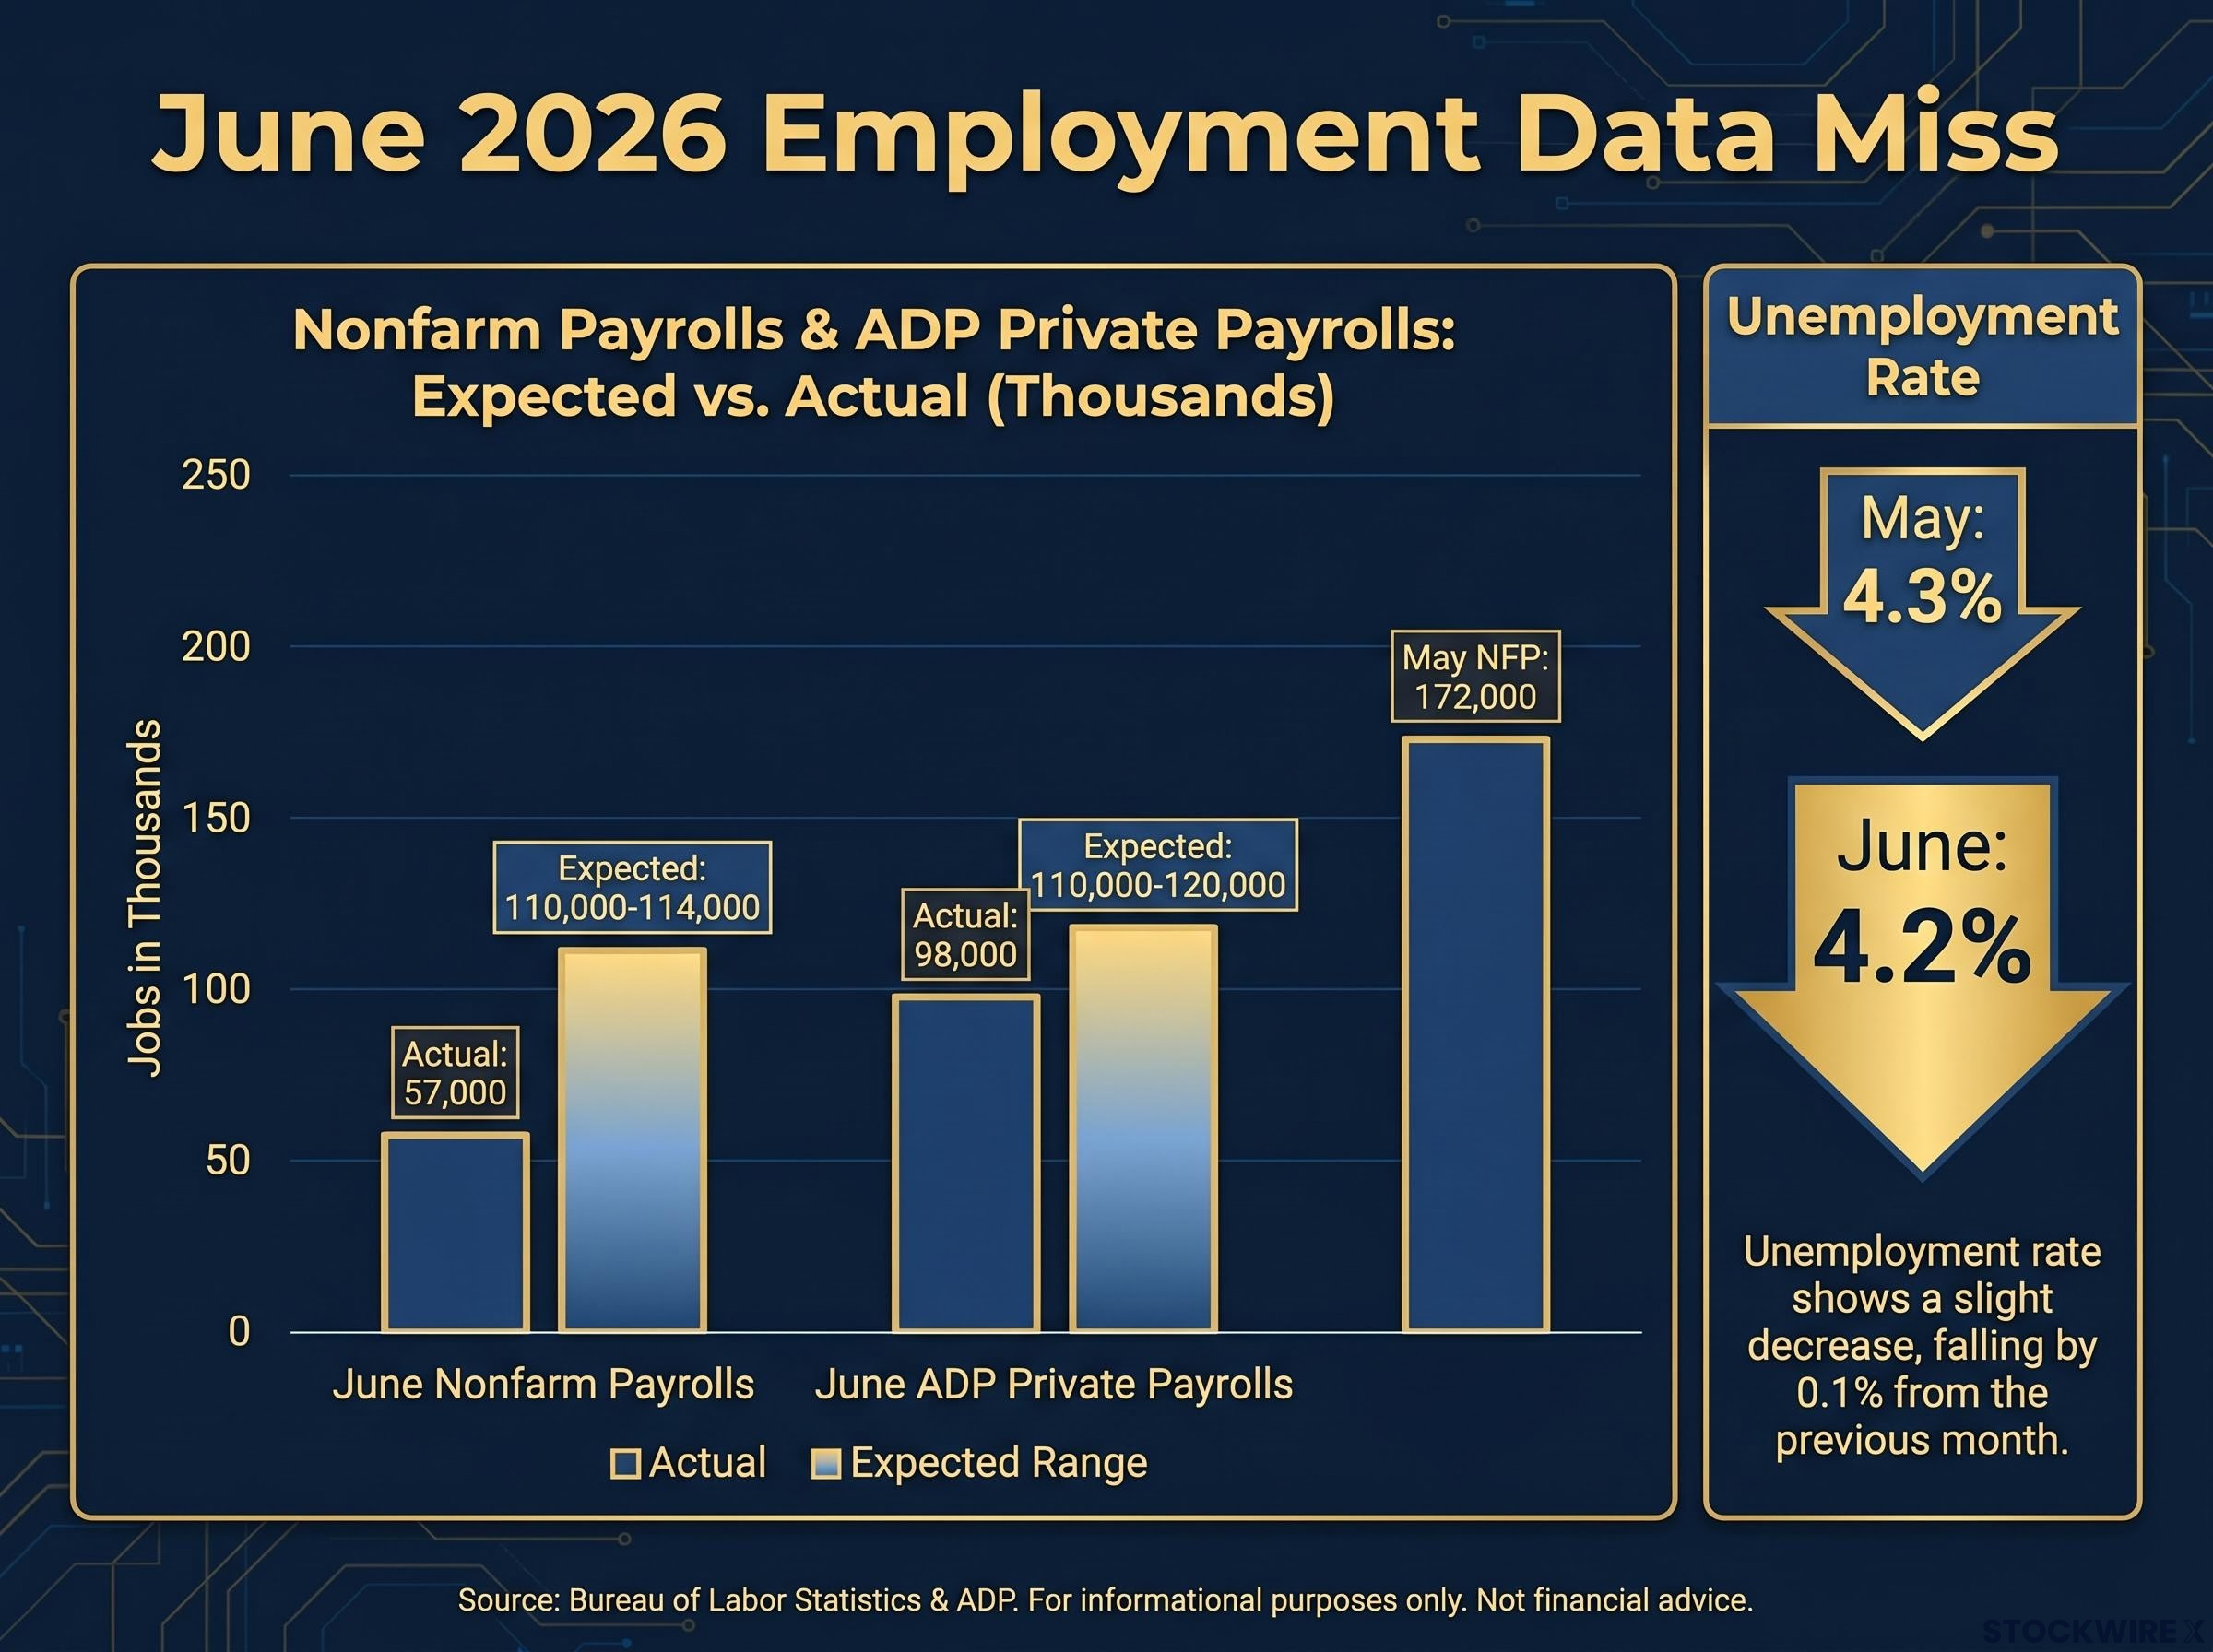
The scale of the miss matters. May’s print came in at 172,000, a healthy number that kept the Federal Reserve comfortable with its tightening bias. The ADP private-sector report for June, released earlier this week, had already signalled softness at 98,000 versus an expected 110,000 to 120,000. So the direction of travel was partially telegraphed. The magnitude was not.
The May 2026 jobs report, which came in at nearly double the 85,000 consensus at 172,000, had reinforced the Fed’s comfort with its tightening bias and lifted rate-hike expectations to the one-to-two-hike range that today’s data is now dismantling.
| Metric | Consensus / Expected | Actual | Prior Month (May 2026) |
|---|---|---|---|
| Nonfarm Payrolls | 110,000-114,000 | 57,000 | 172,000 |
| ADP Private Payrolls | 110,000-120,000 | 98,000 | N/A |
| Unemployment Rate | ~4.3% | 4.2% | 4.3% |
One detail complicates a clean reading. The unemployment rate actually ticked down to 4.2% from 4.3% in May. The household survey (which produces the unemployment rate) and the establishment survey (which produces the payrolls figure) measure different things and can diverge in any given month. A falling unemployment rate alongside a sharp payrolls miss does not give the Fed a tidy narrative in either direction, and that ambiguity is part of what makes the next few weeks so consequential. But the payrolls miss itself is large enough to shift the policy conversation on its own.
The setup going into today was straightforward. Strong payrolls through March to May had given the Fed room to consider further tightening. The logic runs in a straight line:
Before today’s release, market pricing had positioned for one to two further rate increases across 2026, a view supported by analysts at Vital Knowledge.
Then 57,000 arrived and broke the first link in the chain. According to Vital Knowledge, the figure has caused traders to scale back their tightening expectations to somewhere between zero and one hike for the year, a notable step down from where consensus stood before the print. That repricing happened in minutes, not days. Futures markets and short-maturity Treasuries moved immediately, well ahead of any formal Fed communication.
The speed of today’s repricing reflects a structural shift in how markets process economic data: with Fed forward guidance formally abandoned under Chair Warsh since June 17, each incoming data release now carries the full interpretive weight that official commentary once distributed across weeks of speeches, minutes, and press conferences.
The distinction between market pricing and Fed policy is worth holding firmly. The Fed operates under a dual mandate: stable prices and maximum employment. Officials typically require sustained evidence of cooling across both inflation and employment before adjusting their stated path. One weak payrolls print opens a door. It does not walk through it.
The Fed’s dual mandate requires policymakers to weigh maximum employment and stable prices simultaneously, meaning a single weak payrolls print only shifts the calculus if inflation data moves in the same direction.
Futures markets often front-run the Fed by weeks or months. That creates a gap between what traders are pricing and what policymakers are saying, and investors who confuse the two risk positioning for a pivot that may not arrive. The upcoming FOMC minutes, member speeches, and the July and August payrolls reports will determine whether today’s dovish repricing holds or gets walked back.
If you hold rate-sensitive assets, today’s data suggests the cost-of-capital headwind may be peaking. Acting on that assumption before inflation data confirms it carries real risk.
This is the section that explains why equity futures rallied on bad economic data. The answer is not sentiment. It is arithmetic.
The transmission chain has four steps:
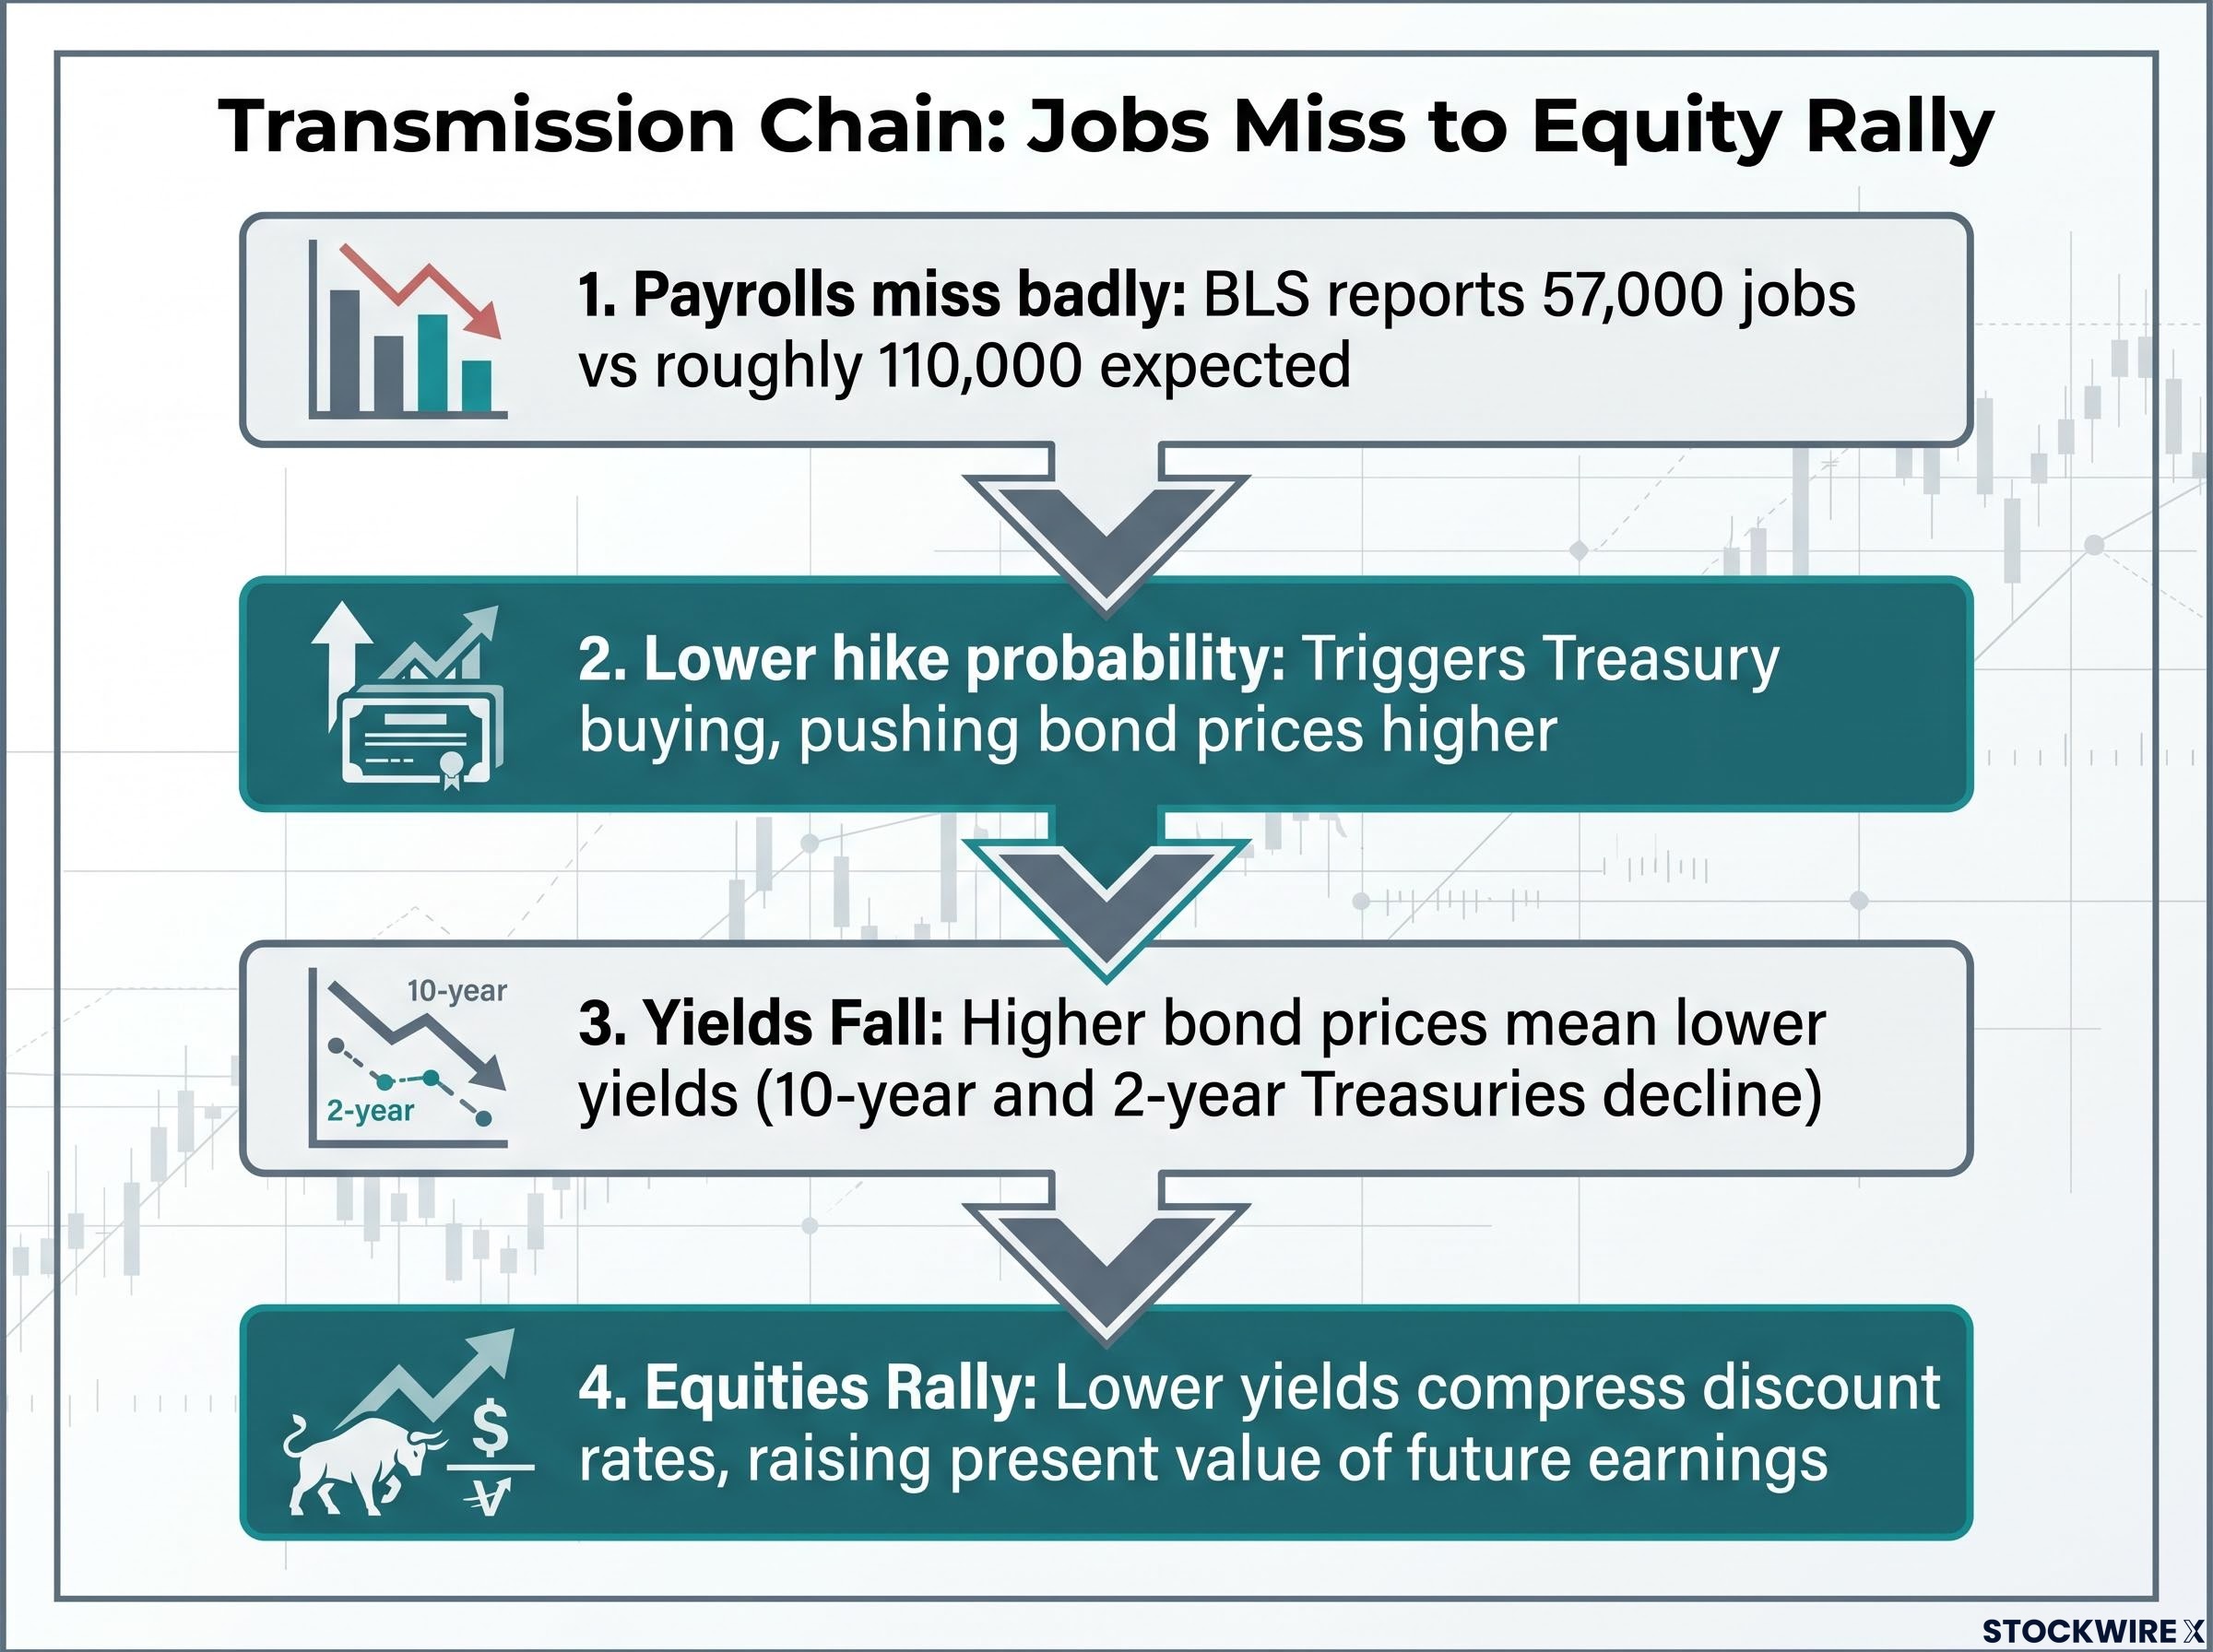
Bond yield mechanics are purely mathematical: because coupon payments are fixed at issuance, any rise in the purchase price of an existing bond automatically compresses the yield, which is why a wave of buying triggered by falling hike expectations translates directly and immediately into the lower Treasury yields visible on screens today.
The 2-year Treasury yield moved more sharply than the 10-year because it is the maturity most sensitive to near-term Fed policy expectations. When traders reprice the next 12-24 months of rate decisions, the 2-year is where that repricing shows up first.
| Asset | Direction (2 July) | Mechanism |
|---|---|---|
| 2-Year Treasury Yield | Down | Near-term Fed hike expectations repriced lower |
| 10-Year Treasury Yield | Down | Broader rate outlook softened |
| U.S. Equity Futures | Up | Lower discount rates raised present value of future earnings |
The effect is most pronounced for growth and technology stocks. These companies derive a larger share of their valuation from earnings expected years into the future, making them more sensitive to changes in the discount rate. Lower yields also shift the relative attractiveness of equities versus bonds, encouraging asset-allocation flows out of fixed income and into stocks.
Today’s equity rally is not a bet that the economy is doing well. It is a bet that the cost of capital is heading lower. Those are two very different things, and the distinction determines which sectors benefit most.
The payrolls miss was not the only disinflationary signal on 2 July. Oil prices fell on the same day, delivering a second, independent source of inflation relief.
Lower oil reduces input costs across the economy and eases headline inflation, measured by the Consumer Price Index (CPI), which is the broadest gauge of price changes for goods and services. That removes pressure from the Fed to keep rates elevated, independent of what the labour market is doing.
Each signal on its own would have softened the rate outlook. Together, they represent a doubly disinflationary impulse that gives the Fed materially more flexibility.
Analysts at Vital Knowledge flagged the combination of subdued labour conditions and a notable decline in oil prices as the source of yield relief for equities on 2 July 2026.
Oil had been elevated earlier in 2026 on geopolitical tensions, so today’s decline represents a meaningful shift from recent conditions, not just noise. When two independent disinflationary signals arrive on the same day, the market amplification tends to be larger than either factor alone would produce. Today’s yield moves may reflect that compounding effect.
June inflation data published on 30 June already contains a structurally important signal: gasoline prices fell roughly 11.5% from their May peak, meaning the energy spike that drove headline CPI to 4.2% has partially reversed ahead of the next print, which tilts the probability of a cooling headline reading before the Fed’s next decision.
The repricing does not land evenly across the market. It concentrates in the places where interest rate sensitivity is highest.
| Sector / Asset | Why Rate-Sensitive | Direction of Effect (Lower Yields) |
|---|---|---|
| REITs | High leverage; valuations tied to borrowing costs | Positive |
| Utilities | Bond-proxy equities; dividend yields compete with Treasuries | Positive |
| Housing-linked equities | Mortgage rates track Treasury yields; demand rises as rates fall | Positive |
| Growth / Tech stocks | Long-duration cash flows; most sensitive to discount rate changes | Positive |
| U.S. dollar | Fewer hikes reduce relative yield advantage of dollar assets | Downward pressure |
The same characteristics that made REITs, utilities, and long-duration growth stocks underperformers in a rate-hiking environment are precisely what make them outperformers now that the hiking path is repricing lower. If you have been underweight these sectors because of rate headwinds, today’s data is the signal to reassess whether that positioning still fits.
The 2-year Treasury yield is the real-time barometer to watch. A sustained drift lower in the 2-year over the coming weeks would confirm that markets genuinely see fewer hikes ahead, not just a one-day reaction.
Fewer expected hikes reduce the relative yield advantage of dollar-denominated assets, typically putting downward pressure on the U.S. dollar. A weaker dollar is a secondary amplifier for U.S. equity markets and for commodities priced in dollars, because it reduces the cost of dollar-priced assets for international buyers. This dynamic is not guaranteed, but it is the typical directional pattern when hike expectations compress.
Today’s data opened a door. The next four to six weeks will determine whether the Fed walks through it. Here are the releases that matter, in order of timing and importance:
If inflation cools alongside the labour market, the case for the Fed being at or very near its terminal rate solidifies. If inflation stays elevated while jobs soften, the Fed faces its dual mandate trade-off head on, and the path forward becomes genuinely uncertain.
A reader who repositions based on today’s repricing without tracking the CPI and the next two payrolls prints is acting on incomplete information. The jobs data shifted the balance of probabilities. Inflation data will determine whether the Fed follows.
The full chain is now visible. A 57,000 NFP print, less than half of consensus, shifted rate-hike expectations from one to two hikes to zero to one. Treasury yields fell, led by the policy-sensitive 2-year. Equity futures rallied on compressed discount rates. Falling oil prices compounded the disinflationary signal and amplified the yield relief. Rate-sensitive sectors, from REITs to growth stocks, stand to benefit most if the repricing holds.
One data print shifted the balance of probabilities. It did not resolve the question. The distinction matters for any positioning decision you make from here.
The binary that resolves it is straightforward:
June CPI and July payrolls are the two data points that will confirm or reverse today’s pricing. That makes the next four to six weeks a genuine inflection window for second-half 2026 positioning. You do not need to have a settled view today. You need to know exactly which numbers will settle it for you.
This article is for informational purposes only and should not be considered financial advice. Investors should conduct their own research and consult with financial professionals before making investment decisions. Past performance does not guarantee future results. Financial projections are subject to market conditions and various risk factors.
Equity futures rallied because a weak payrolls number reduces the likelihood of further Federal Reserve rate hikes, which lowers the discount rate used to value future corporate earnings and mechanically raises stock prices, particularly for growth and technology companies.
The chain runs in four steps: a weak jobs print lowers expected Fed hikes, which triggers Treasury buying, which pushes bond prices up and yields down, which compresses equity discount rates and raises the present value of future earnings, sending stock prices higher.
June 2026 nonfarm payrolls came in at 57,000, less than half the consensus forecast of 110,000-114,000 and a sharp drop from May's 172,000 print, making it one of the largest single-month misses of the year.
REITs, utilities, housing-linked equities, and long-duration growth and technology stocks are the most rate-sensitive and benefit most from falling yields, as lower borrowing costs and compressed discount rates directly improve their valuations.
June CPI, PCE inflation data, the July payrolls report, and FOMC communications are the four key releases to watch; if inflation stays elevated despite the payrolls miss, the Fed retains justification to hike again and today's market rally faces a direct challenge.