The U.S. economy added 172,000 jobs in May 2026, nearly double the 85,000 analyst consensus, delivering the clearest signal yet that the labour market is running considerably hotter than most forecasters had built into their models. The Bureau of Labor Statistics (BLS) Employment Situation Summary, released 5 June 2026, landed amid persistent uncertainty about the pace of U.S. economic growth this year. A beat of this magnitude, paired with a substantial upward revision to April’s figures, reframes the conversation about where the economy stands heading into the second half of 2026. What follows breaks down the headline result, the sectors behind it, the revision that quietly strengthened the picture further, and what the combined data tells investors about labour market health at mid-year.
A jobs blowout: 172,000 payrolls nearly double the forecast
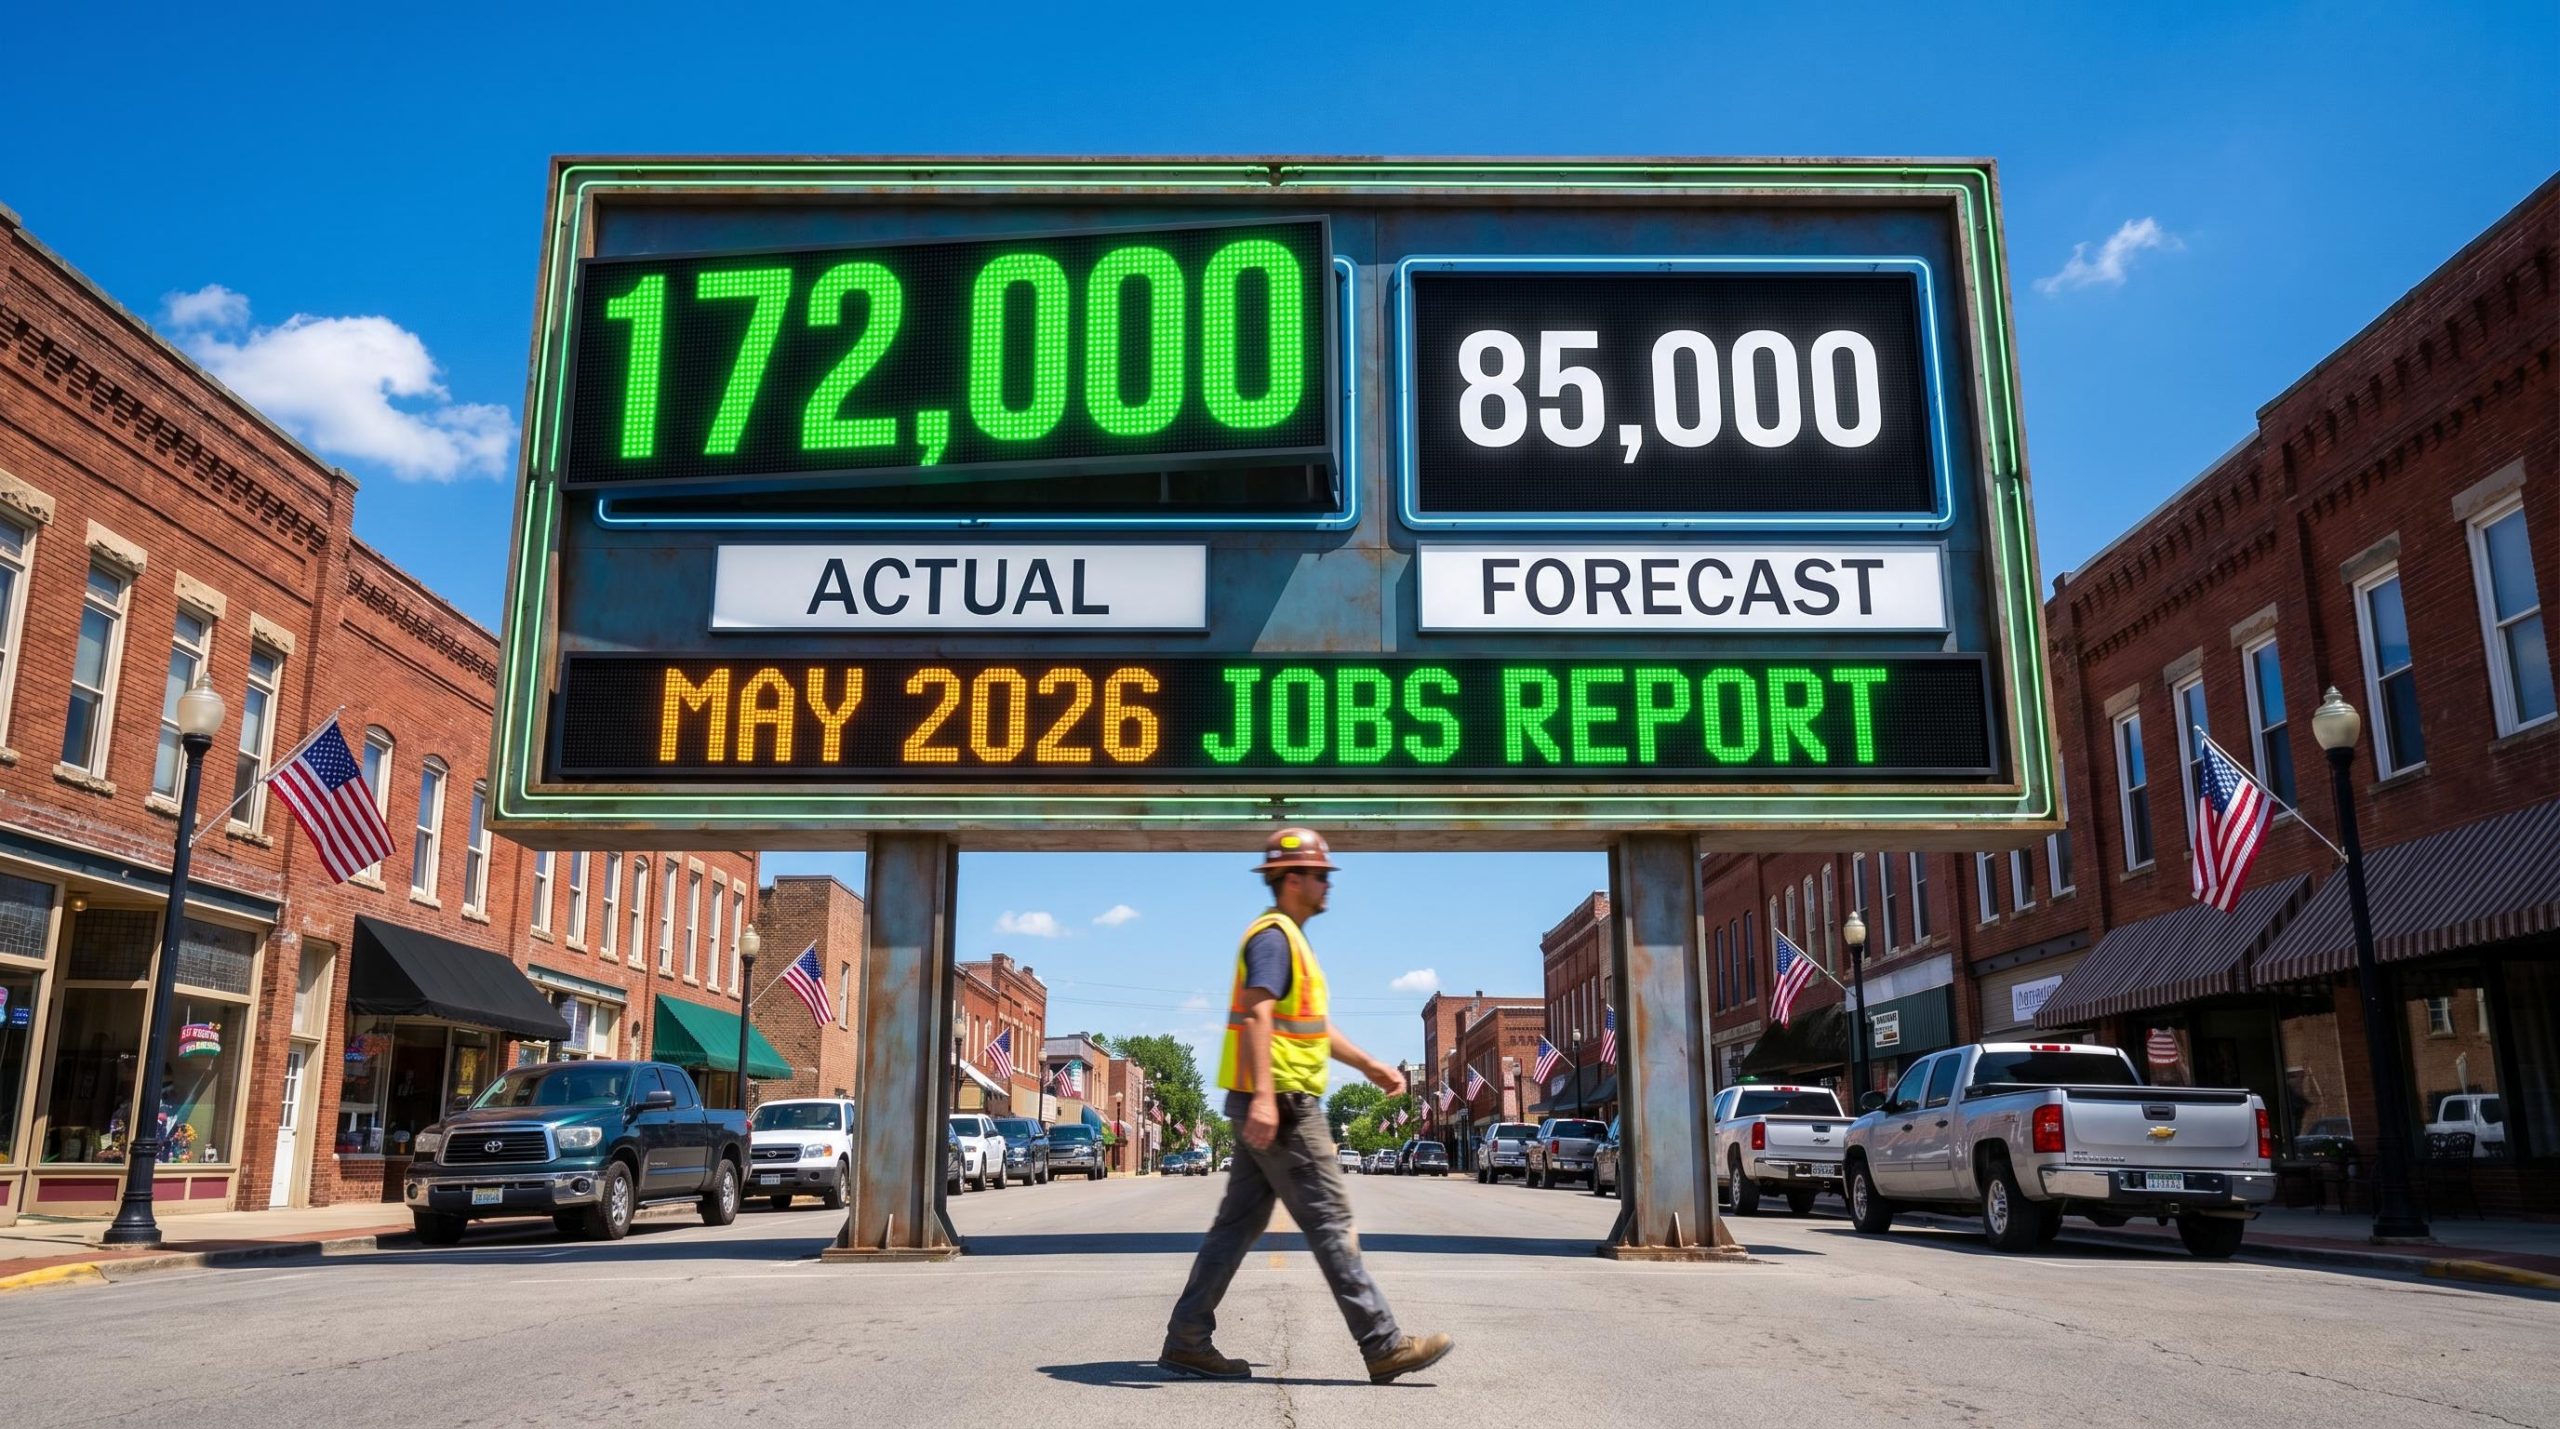
The gap between expectation and reality was stark. Forecasters had set the bar at 85,000 nonfarm payrolls for May. The BLS reported 172,000, a result approximately 102% above consensus.
172,000 jobs added in May 2026 versus a consensus forecast of 85,000.
That distance is not simply a miss by Wall Street models. It is evidence that the U.S. labour market is absorbing economic pressures, from trade policy uncertainty to tighter financial conditions, better than prevailing assumptions allowed for. May’s result extends a pattern that has held since March 2026: three consecutive months in which payrolls have exceeded expectations.
| Metric | Figure |
|---|---|
| May 2026 nonfarm payrolls (actual) | 172,000 |
| May 2026 consensus estimate | 85,000 |
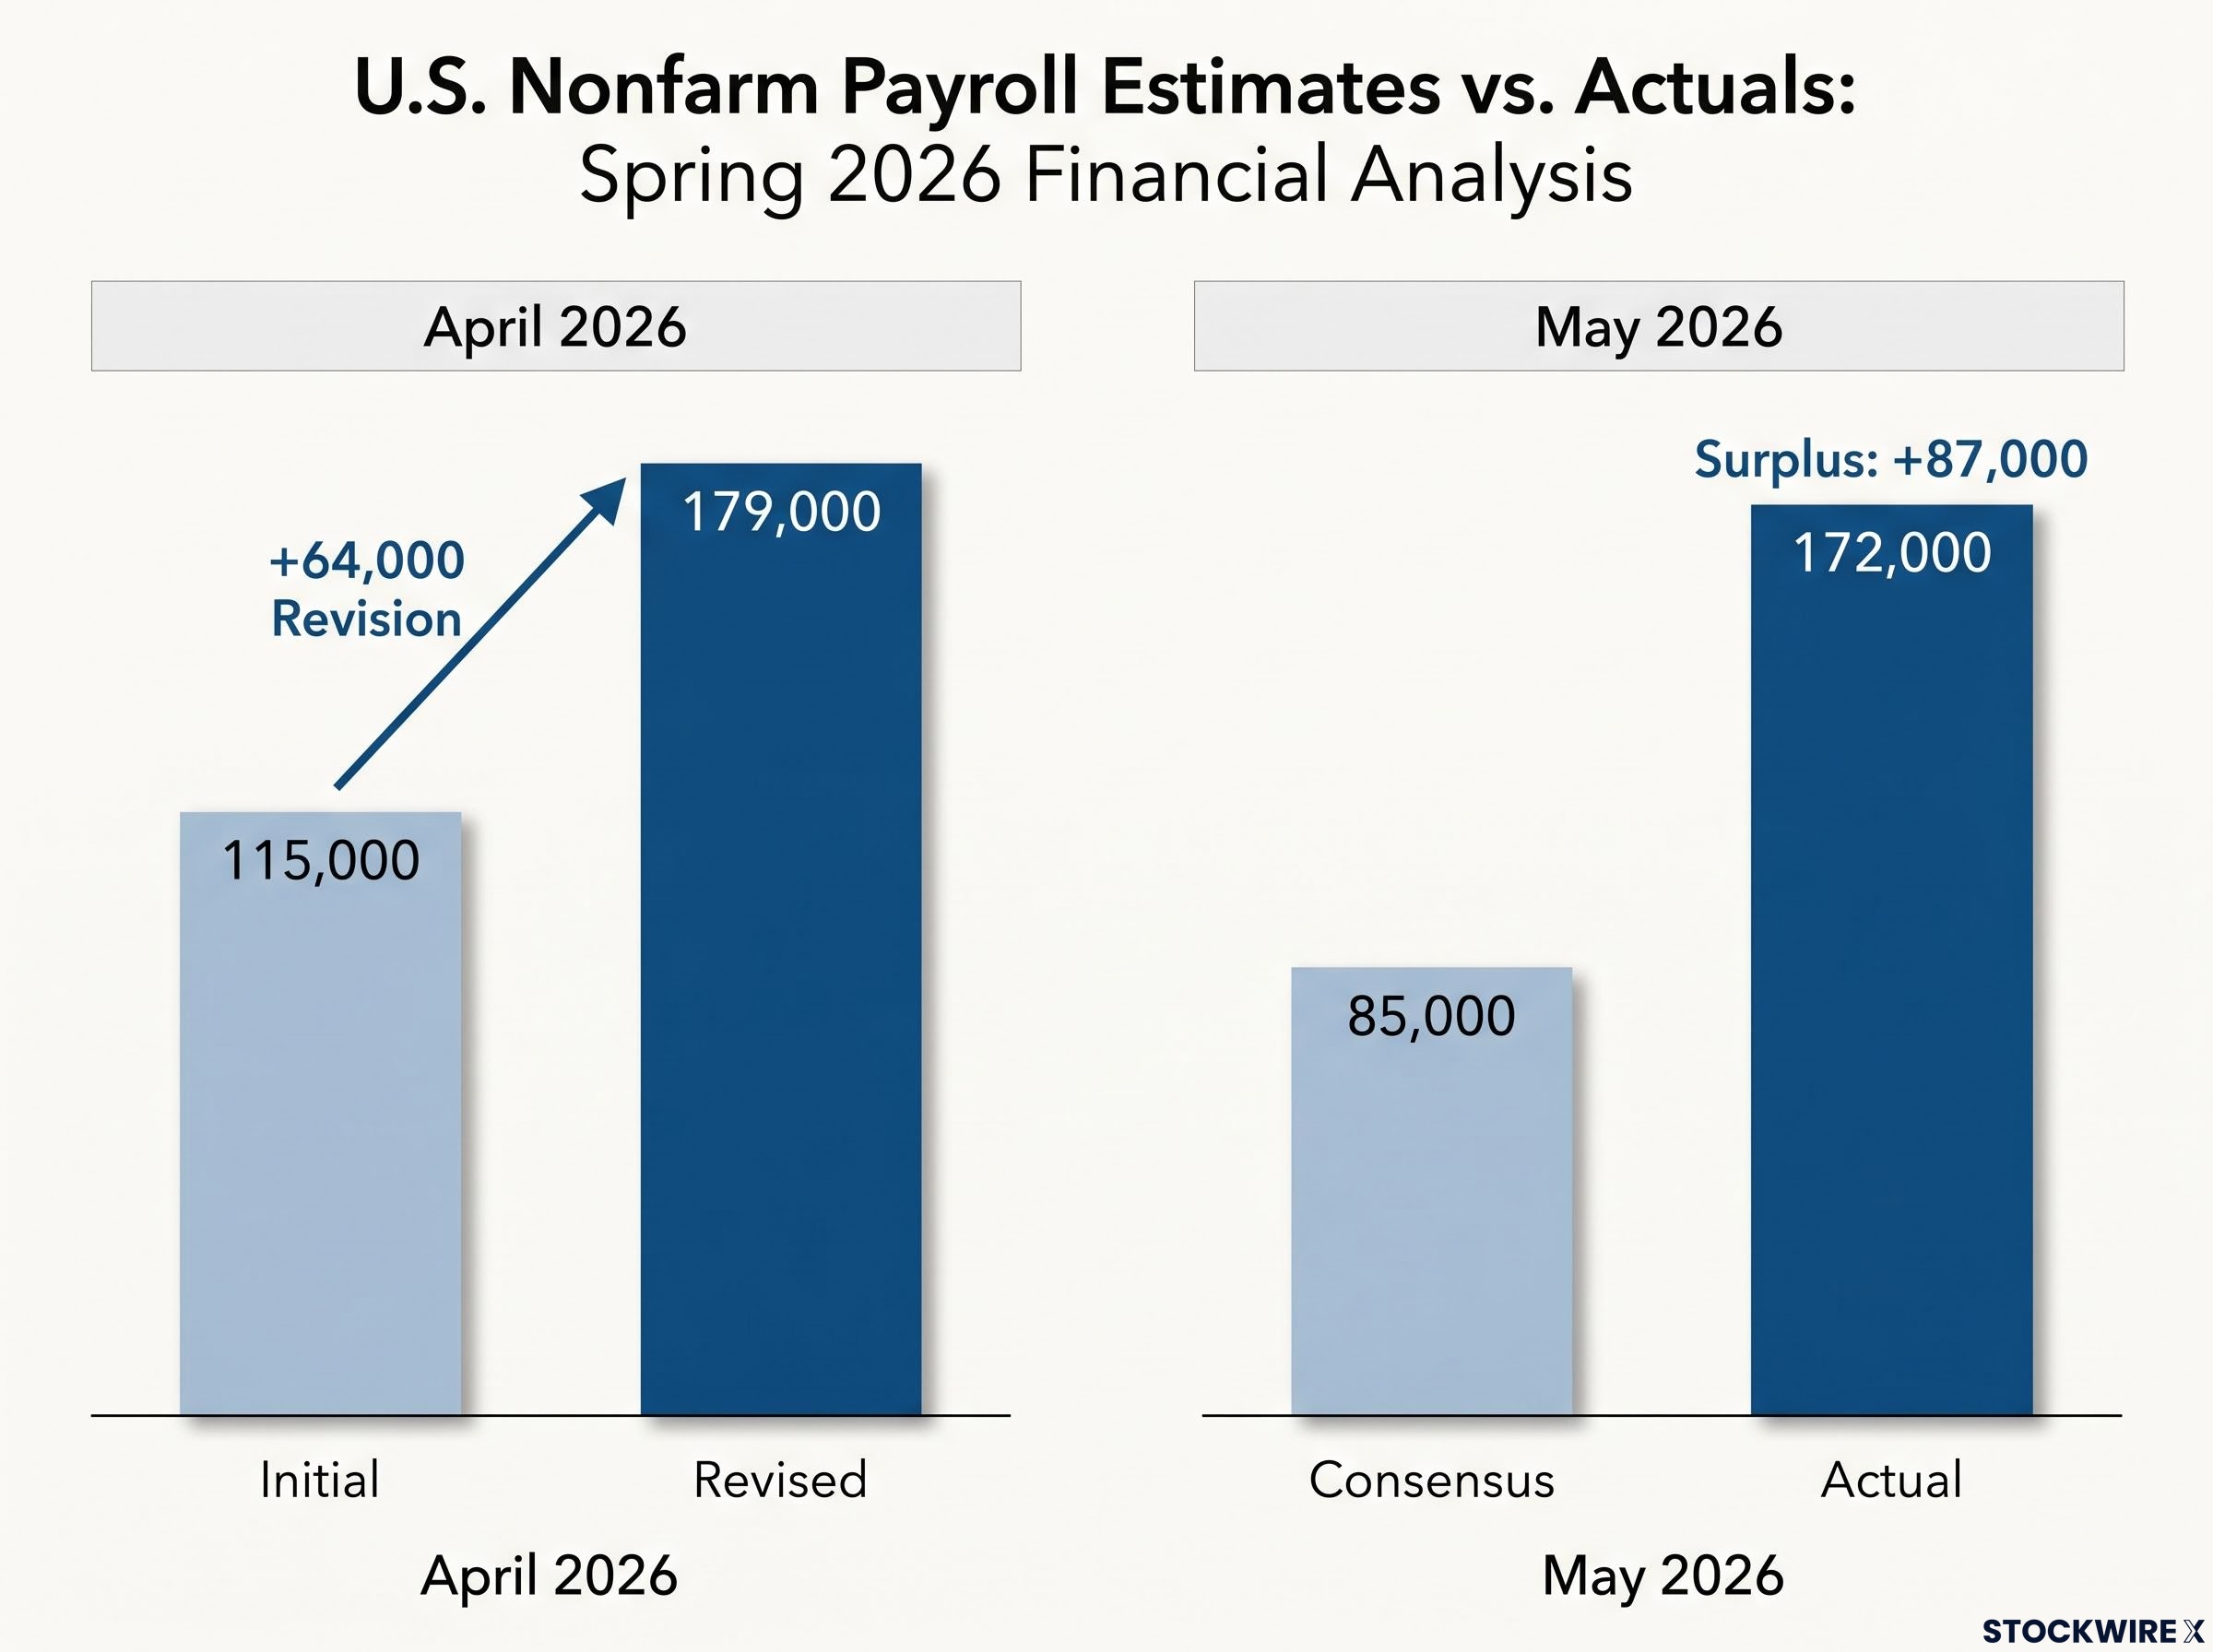
| Surplus above forecast | +87,000 |
A single strong month can be noise. Three in a row begins to look like a trend that consensus has been slow to price in.
When big ASX news breaks, our subscribers know first
Which sectors drove the gain, and which fell behind
The headline would mean less if the jobs were concentrated in a single volatile category. They were not. Three distinct sectors drove the May gain, while one notable exception broke the pattern.
Where hiring strengthened
- Leisure and hospitality continued to add positions, consistent with sustained consumer spending on services
- Local government payrolls expanded, reflecting public-sector hiring that operates on budget cycles partly independent of private-sector momentum
- Health care contributed to growth, extending a sector trend that has been among the most durable sources of U.S. job creation in recent years
The mix matters. Leisure and hospitality carries cyclical sensitivity, but local government and health care hiring tends to be stickier, less prone to rapid reversal if broader conditions soften. That combination lends more durability to the headline figure than a single-sector surge would.
Where jobs were lost
- Financial activities recorded a decline in employment during May, the primary counterpoint in an otherwise broad-based report
The full BLS sector breakdown across all industries will provide additional granularity, but the available data points to a report where strength was distributed rather than concentrated.
What the April revision reveals about underlying momentum
Buried inside the May release was a number that deserves its own reading. April 2026 payrolls were revised upward from an initial 115,000 to 179,000, a swing of +64,000.
April revised from 115,000 to 179,000, a swing of +64,000.
That is not a rounding adjustment. A revision of that magnitude means the labour market in April was nearly 56% stronger than the first print suggested. It also resets the baseline: May’s 172,000 is no longer an isolated spike following a tepid April. It is the second consecutive month above 170,000.
BLS revisions routinely reshape the picture weeks after initial release, and the April swing from 115,000 to 179,000 is a textbook case of why treating the first print as the final word on labour market conditions can mislead investors tracking the economic cycle.
| Month | Initial figure | Revised figure |
|---|---|---|
| April 2026 | 115,000 | 179,000 |
| May 2026 | 172,000 | Preliminary (subject to revision) |
Monthly revisions are routinely treated as footnotes. In this case, the revision fundamentally alters the spring 2026 narrative. Two consecutive months of understated first prints suggest the labour market may have been running ahead of the prevailing consensus for longer than a single report indicated.
Understanding what nonfarm payrolls actually measure
The nonfarm payrolls figure, published by the BLS on the first Friday of each month as part of the Employment Situation Summary, counts the total number of paid workers on U.S. business and government payrolls. It excludes several categories:
- Farm workers
- Private household employees
- Nonprofit organisation employees
That scope makes nonfarm payrolls the broadest and most timely monthly snapshot of U.S. labour market activity, which is why it carries more market-moving weight than virtually any other single economic indicator.
Nonfarm payroll composition across manufacturing, construction, utilities, and services reflects very different economic drivers and cyclical sensitivities, which is why the sectoral breakdown within any monthly BLS release carries as much analytical weight as the headline count for investors assessing where labour demand is actually concentrated.
When forecasters set the May consensus at 85,000, they were calibrating against signals including slower business confidence surveys and trade policy headwinds. A result of 172,000 against that backdrop indicates the real economy is generating employment at a pace those signals did not capture. The companion unemployment rate, reported at 4.3% in May (measuring the share of workers actively seeking but unable to find employment), provides the demand-side counterpart to the supply-side payrolls count.
Steady unemployment, accelerating wages, and what the full picture signals
| Indicator | May 2026 | April 2026 | Consensus |
|---|---|---|---|
| Nonfarm payrolls | 172,000 | 179,000 (revised) | 85,000 |
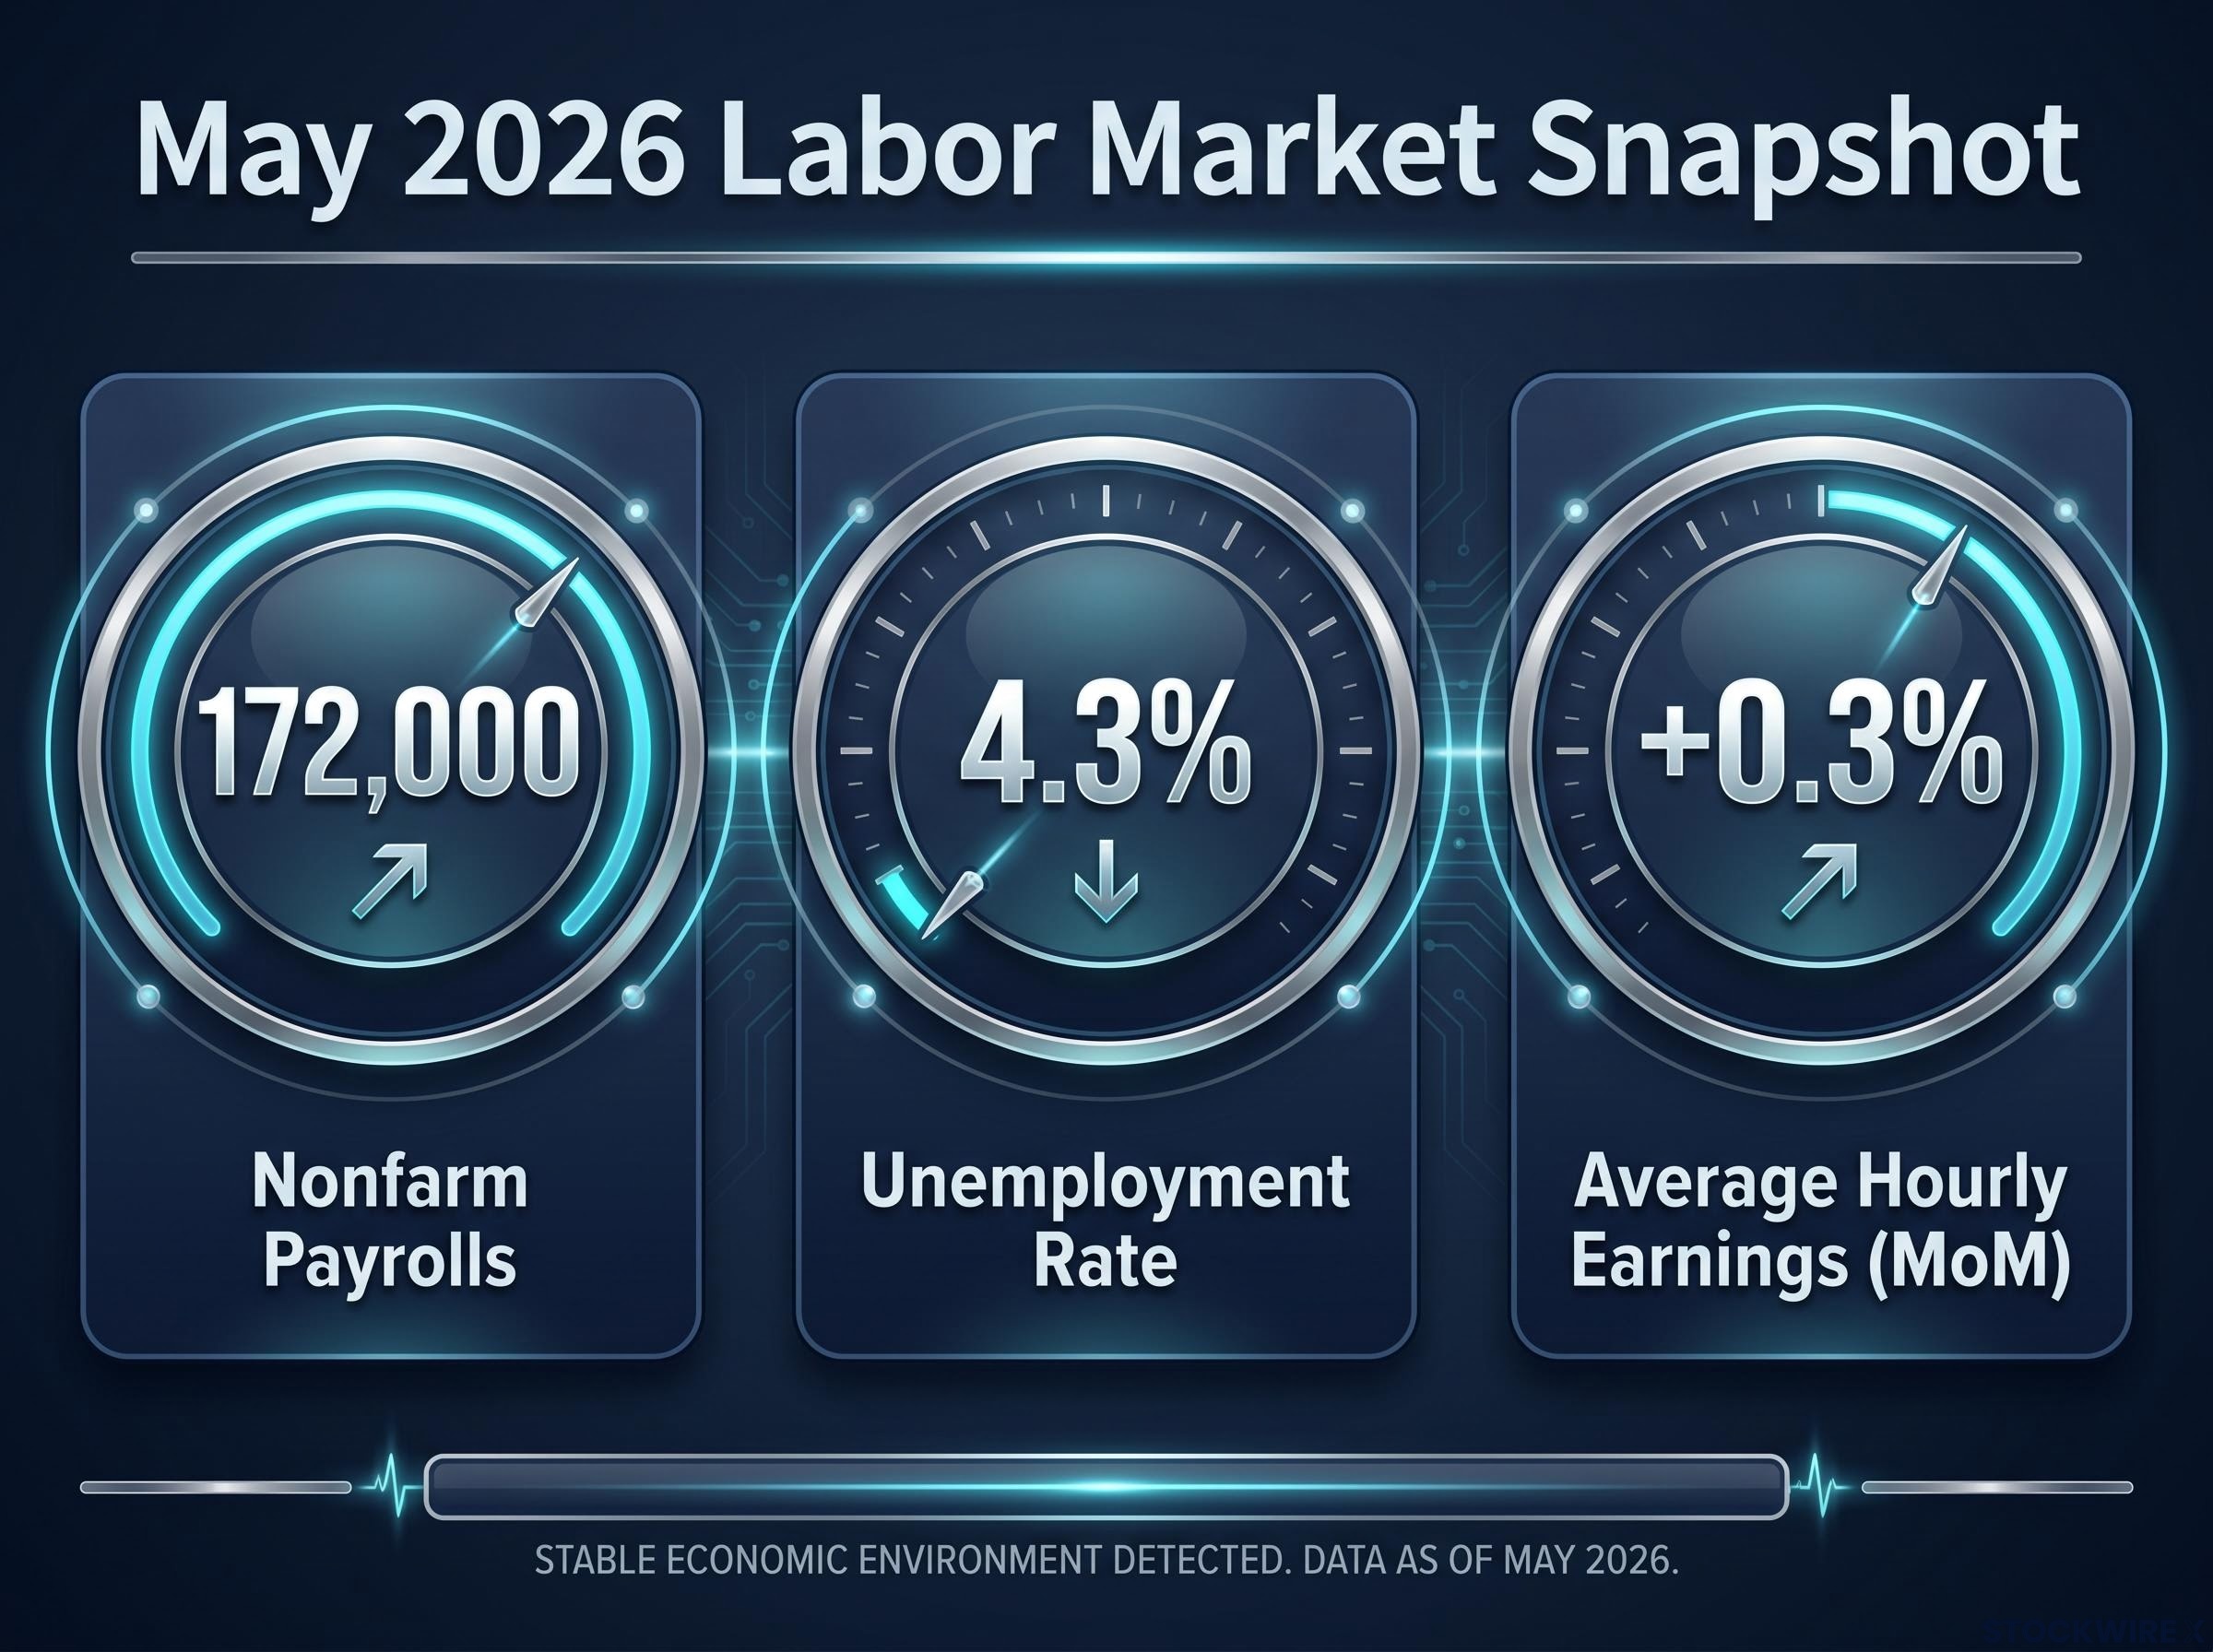
| Unemployment rate | 4.3% | 4.3% | 4.3% |
| Average hourly earnings (MoM) | +0.3% | +0.2% | +0.3% |
Unemployment holds at 4.3%
The unemployment rate came in at 4.3% for May, unchanged from the prior month and matching economist projections. Stability at this level, rather than a move higher, reinforces the view that strong payroll gains are being absorbed without a corresponding rise in joblessness. It is a reading that points to a labour market in equilibrium rather than one under stress.
Wage growth ticks higher
Average hourly earnings rose +0.3% month-over-month in May, up from +0.2% in April and in line with consensus expectations. The acceleration is modest, but directionally significant: wages are growing faster than last month without overshooting forecasts. That combination, stronger payrolls paired with steady unemployment and contained wage growth, describes a labour market that is firm without showing the overheating signals that would typically raise inflationary concern.
No verified Federal Reserve commentary or named economist analysis connecting the May report to the second-half 2026 rate path was available as of publication. That context will be worth monitoring closely as policymakers respond to the data.
The Fed rate path heading into the second half of 2026 remains constrained by PCE inflation running at 3.5%, well above the 2% target, meaning that even a labour market running decisively above consensus may not shift the FOMC’s calculus unless wage growth begins to accelerate beyond current levels.
A labour market running ahead of the script entering H2 2026
The May 2026 jobs report delivered a result that challenges the prevailing assumption of a cooling U.S. economy. Three headline takeaways stand out:
- 172,000 nonfarm payrolls, nearly double the 85,000 consensus, extending a multi-month streak of above-expectation readings
- April’s upward revision to 179,000 from 115,000, confirming that spring 2026 labour market strength was systematically underestimated at first release
- Unemployment steady at 4.3% and wage growth ticking to +0.3% month-over-month, a combination consistent with durable expansion rather than overheating
Full BLS sector breakdowns, Federal Reserve commentary, and market reaction data remain unconfirmed as of publication and will warrant follow-up coverage. For anyone tracking the trajectory of U.S. economic conditions into the second half of 2026, this report represents a meaningful recalibration of the baseline.
Labour market quality metrics, including the composition of full-time versus involuntary part-time positions and the trajectory of ISM employment sub-indexes, can diverge sharply from headline payroll counts, which is why a single strong monthly print does not necessarily resolve questions about where labour demand is heading.
This article is for informational purposes only and should not be considered financial advice. Investors should conduct their own research and consult with financial professionals before making investment decisions.