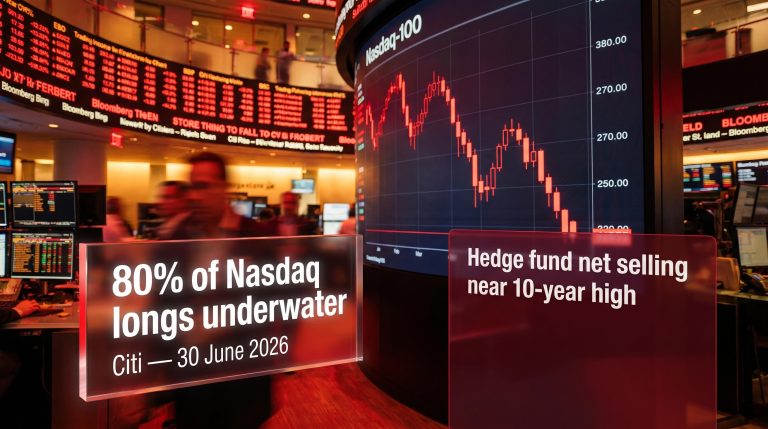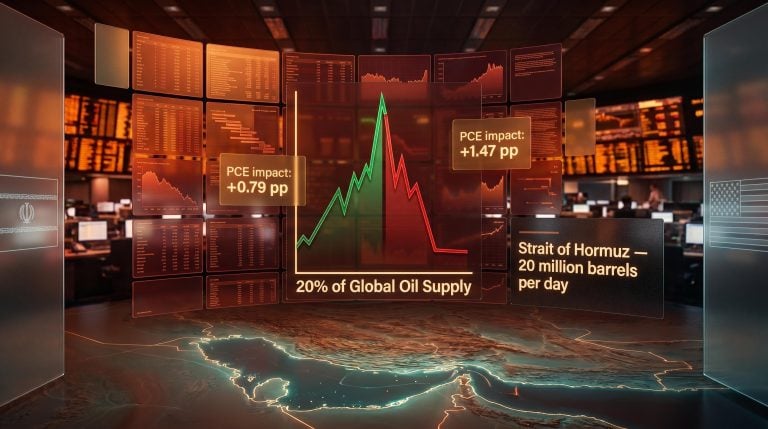
Hormuz Prices Have Normalised. Geopolitical Inflation Risk Has Not.
1 hr ago
The most dangerous trade in global equities right now is not the one everyone is betting against. It is the one everyone agrees on.
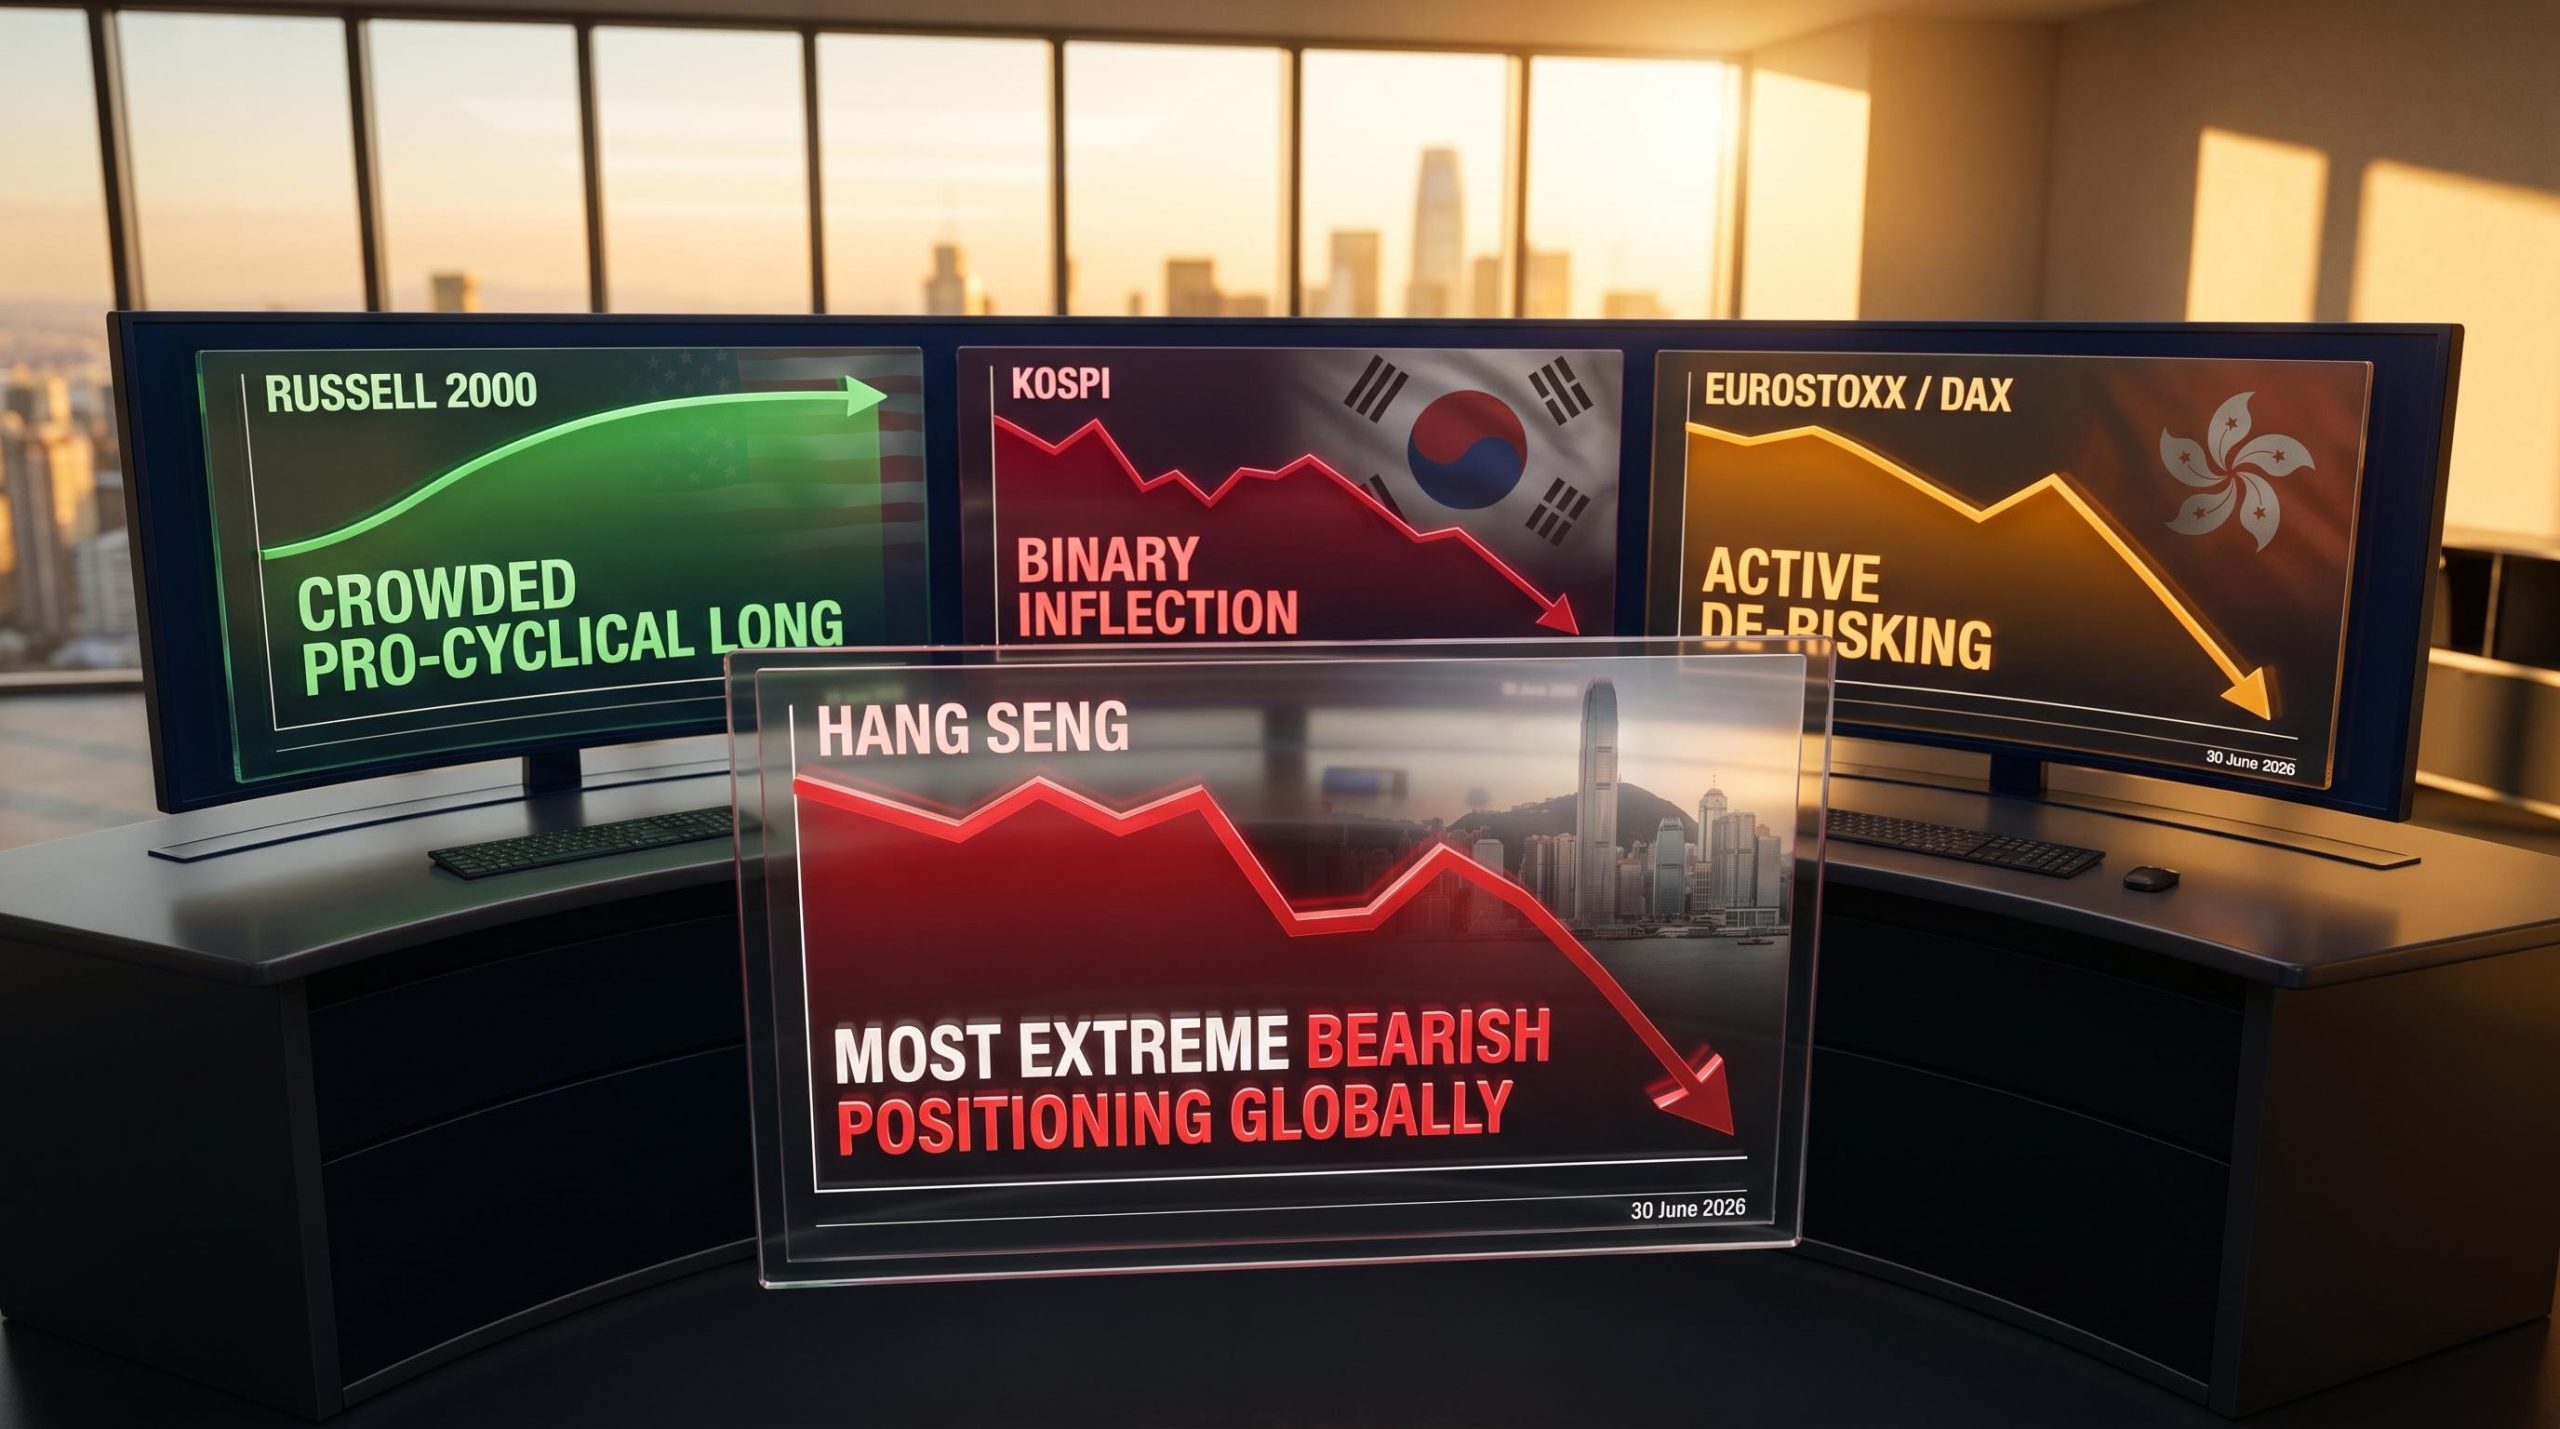
In concrete terms, that means the consensus long in U.S. small-caps, the crowded short in Hong Kong, and the stretched bullish positioning in South Korea are all trades where the next narrative shift will not produce an orderly repricing. It will produce a violent one.
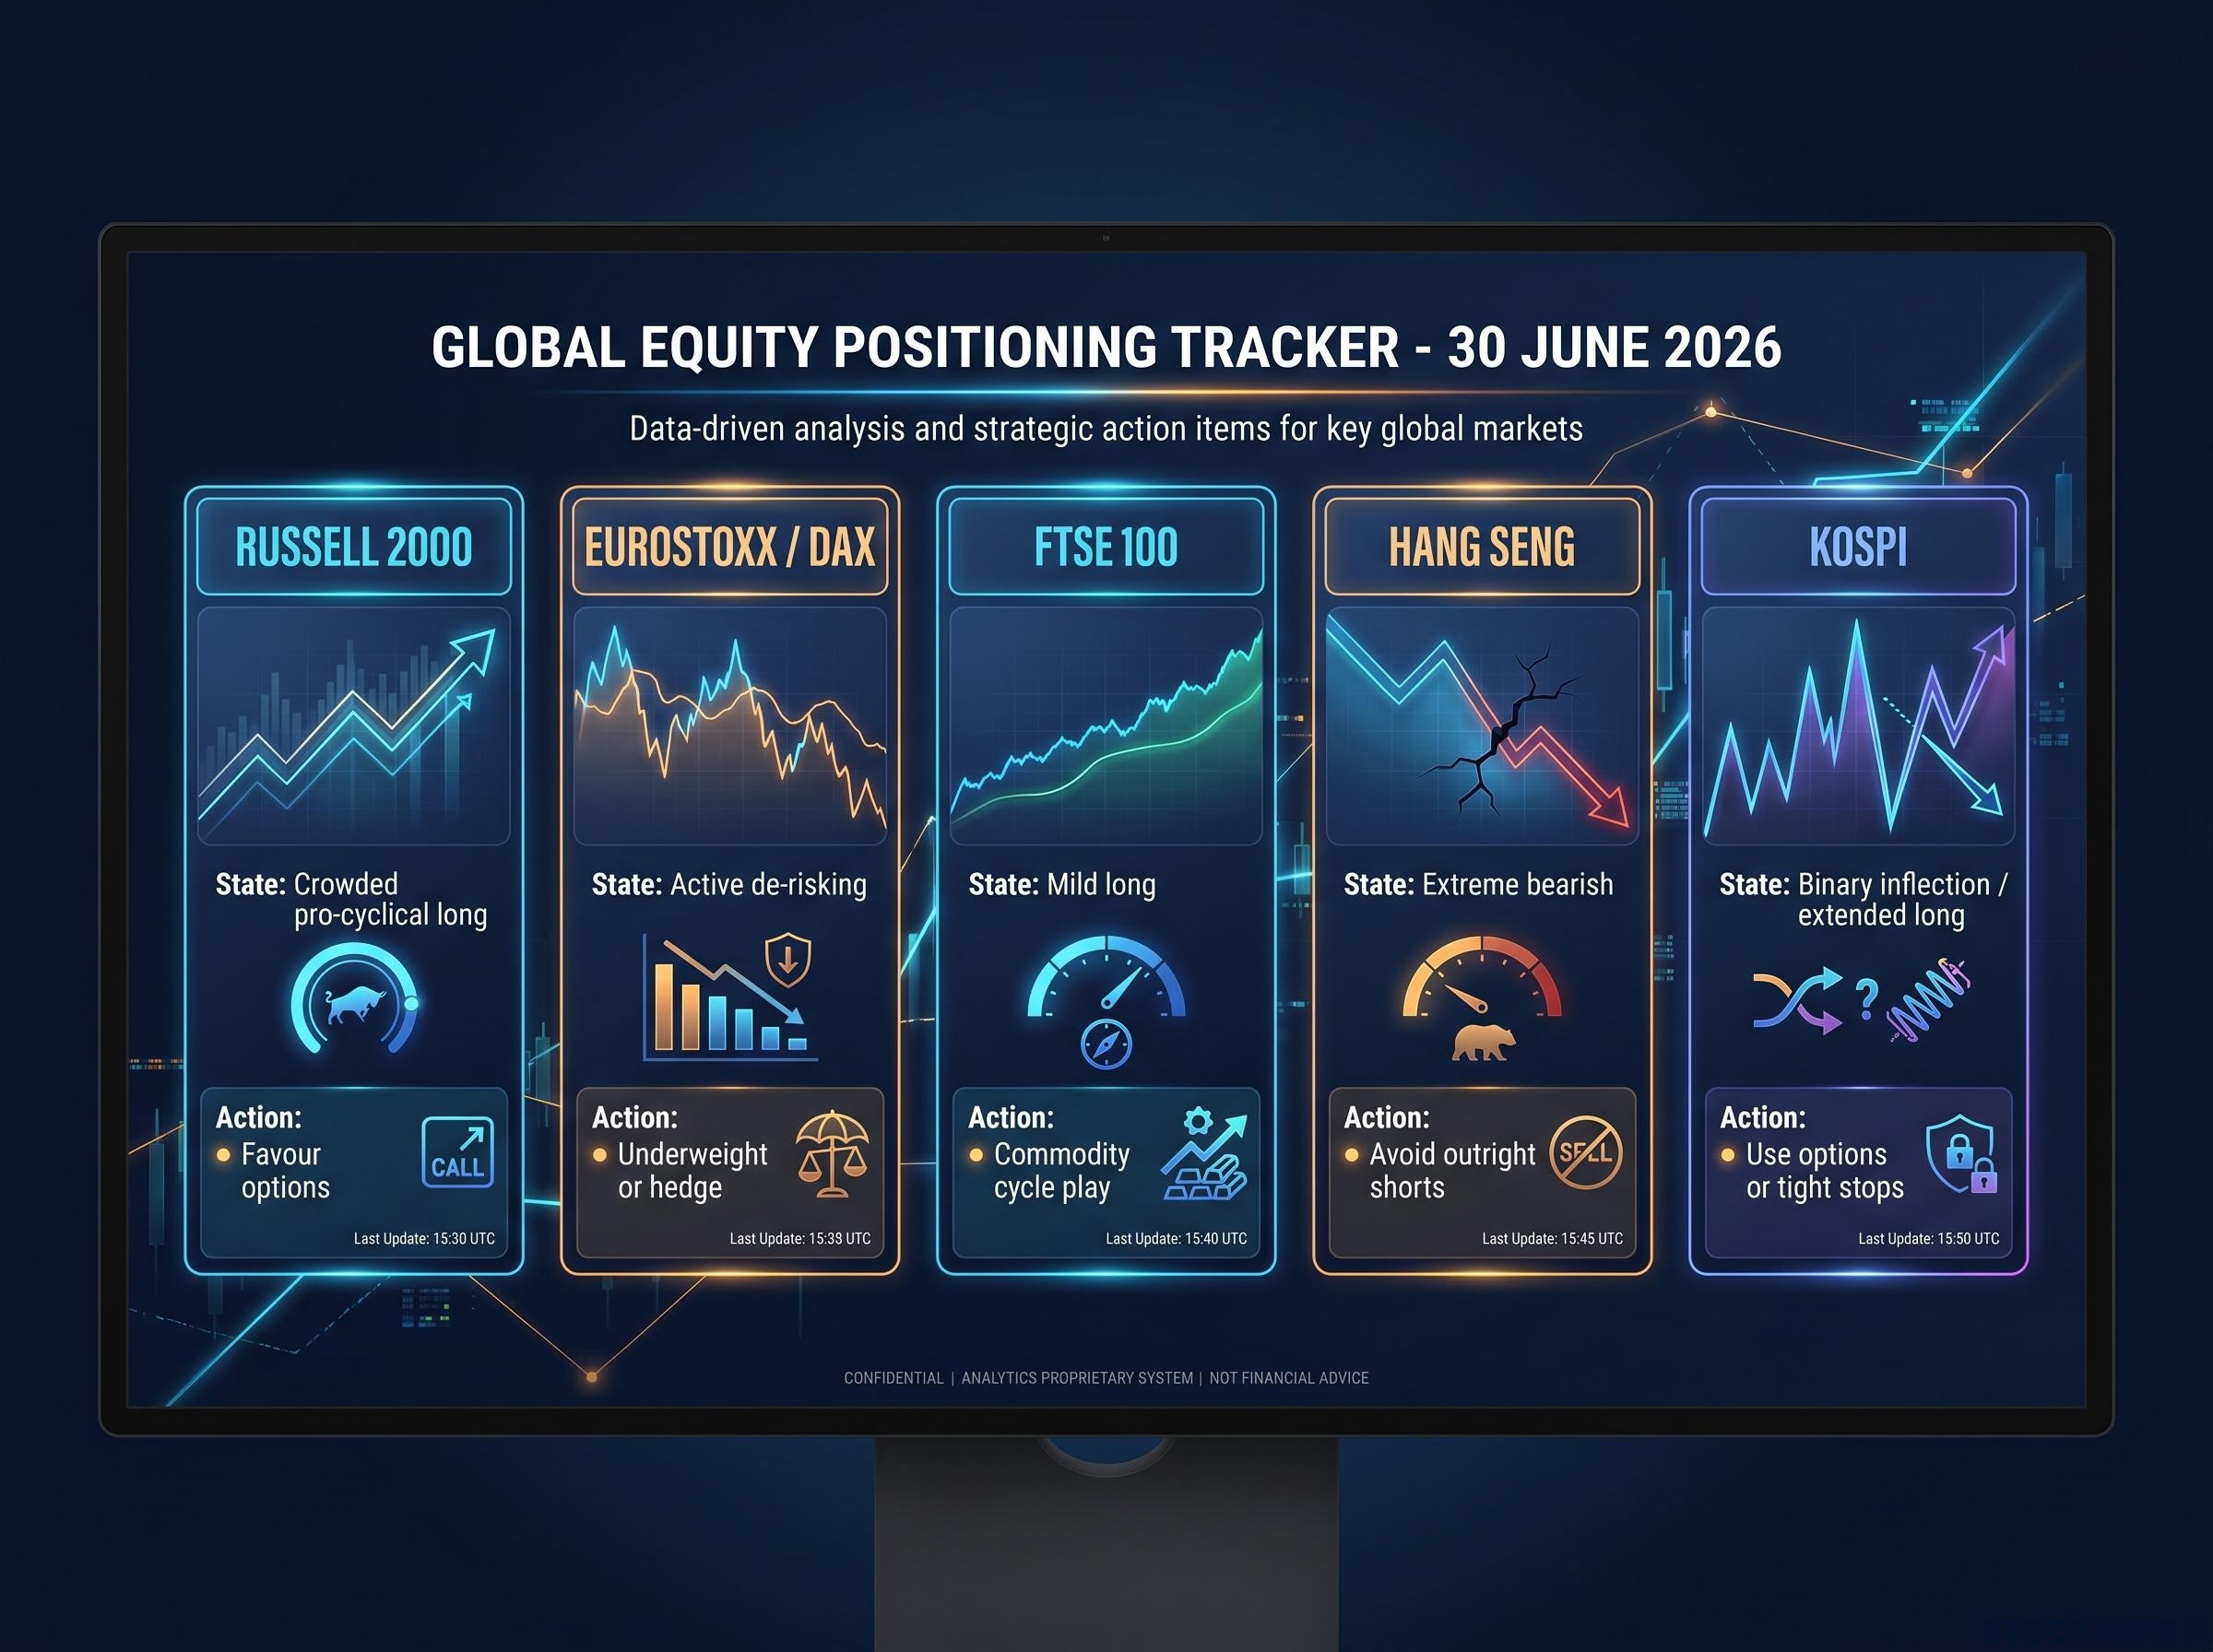
Citi’s research note published on 30 June 2026 maps global equity positioning not as a set of directional calls but as a risk audit: where the crowd has gathered, where their profits sit, and where the exits are narrowest. Positioning data does not tell you where markets go next. It tells you where the price moves will be unusually violent when the story changes. Here is what the data actually tells you about where the next unexpected moves are most likely to originate, and how to position around them before they arrive.
Most investors treat positioning data as a directional signal. If everyone is long, sell. If everyone is short, buy. That instinct is not wrong at extremes, but it is dangerously incomplete everywhere else.
Positioning functions as a contrarian signal only when it reaches extremes, and even then it identifies the magnitude of potential price moves rather than their direction or timing. The distinction matters. Knowing that a trade is crowded tells you the next surprise will be amplified. It does not tell you when the surprise arrives or which way it cuts.
The June 2026 BofA Global Fund Manager Survey documented institutional crowding signals reaching all-time extremes in semiconductor and AI names, with 80% of managers identifying the same consensus long at precisely the moment their collective exposure made a disorderly unwind most likely.
Citi’s note frames the global equity map through three distinct positioning states, each creating a different vulnerability profile.
| Positioning State | Primary Vulnerability |
|---|---|
| Very long with large profits | Fast profit-taking and air pockets on bad news |
| Very short with large profits | Sharp squeezes on even mildly positive surprises |
| Neutral positioning | Price action tracks fundamentals; flow shocks minimal |
The applied framework is straightforward: fundamentals and macro analysis determine direction. Positioning determines how you size, how you hedge, and where your tail risks are concentrated. Most investors misuse positioning data as a prediction tool. Its real power is as a risk calibration tool, and understanding that distinction changes how you act on every regional signal that follows.
A trade becomes crowded in stages, and the Russell 2000 long has moved through each one. First came the rotation: capital flowing out of U.S. large-caps into small-caps as investors chased the pro-cyclical thesis. Then came the short covering, which is when bearish traders buy back shares they had borrowed and sold, adding a second layer of mechanical buying pressure on top of fresh directional inflows.
These two engines running simultaneously drove Russell 2000 bullish positioning to extended, consensus levels. Citi noted that profit levels embedded in those positions remain modest, which contains the immediate positioning risk but leaves holders exposed to any macro disappointment.
The profit profile complicates the picture in both directions:
What this tells you is that the easy upside from short-covering mechanics has already run. What remains is a position that requires the macro thesis to be correct, not just continued momentum, to pay off. If you hold small-cap exposure, you are no longer riding a fresh opportunity. You are carrying a consensus bet with elevated sensitivity to any growth or rate disappointment.
Continental European equities are not simply out of favour. They are being actively abandoned.
Across EuroStoxx and DAX, fresh short positions are being built at the same time as existing longs are being unwound. That is not a market where investors have paused to reassess. It is a market where institutional capital is expressing a conviction that conditions deteriorate further. The distinction between passive weakness and active de-risking matters enormously for how you interpret any rally you see on a European index screen.
The implication is direct: rallies in continental Europe are more likely to be sold into than chased. Until flow data demonstrably and sustainably turns, buying dips in the DAX or EuroStoxx means positioning yourself against an institutional consensus that is actively building against you.
The FTSE 100 tells a structurally different story. Its heavy tilt toward global sectors and commodities means it moves to a different rhythm than the DAX or EuroStoxx. Citi’s data points to a moderate build in long positioning, reflecting the index’s character as a global cyclicals and resources vehicle rather than a bet on the domestic European economy.
| Dimension | EuroStoxx / DAX | FTSE 100 |
|---|---|---|
| Positioning trend | Active de-risking (long unwind + new shorts) | Mild long increase |
| Profit profile | Fragile; conviction deteriorating | Thin; limited cushion |
| Primary risk vector | Positioning-driven selling into rallies | Commodity and macro cycle shifts |
Thin profit levels in FTSE longs mean there is limited forced-selling risk, but also no embedded cushion. The risk is external, driven by commodity prices and the macro cycle, rather than internal positioning dynamics. If you are treating European indices as a single allocation decision, you are conflating two fundamentally different risk profiles. The DAX and FTSE 100 require different sizing and different hedges right now.
According to Citi’s dataset, no major global index carries bearish positioning as extreme as that currently concentrated in the Hang Seng.
That sentence lands with real weight. The short book is not just crowded; it is crowded with positions sitting on substantial gains, which creates a structurally asymmetric setup that every investor with China or Hong Kong equity exposure needs to understand.
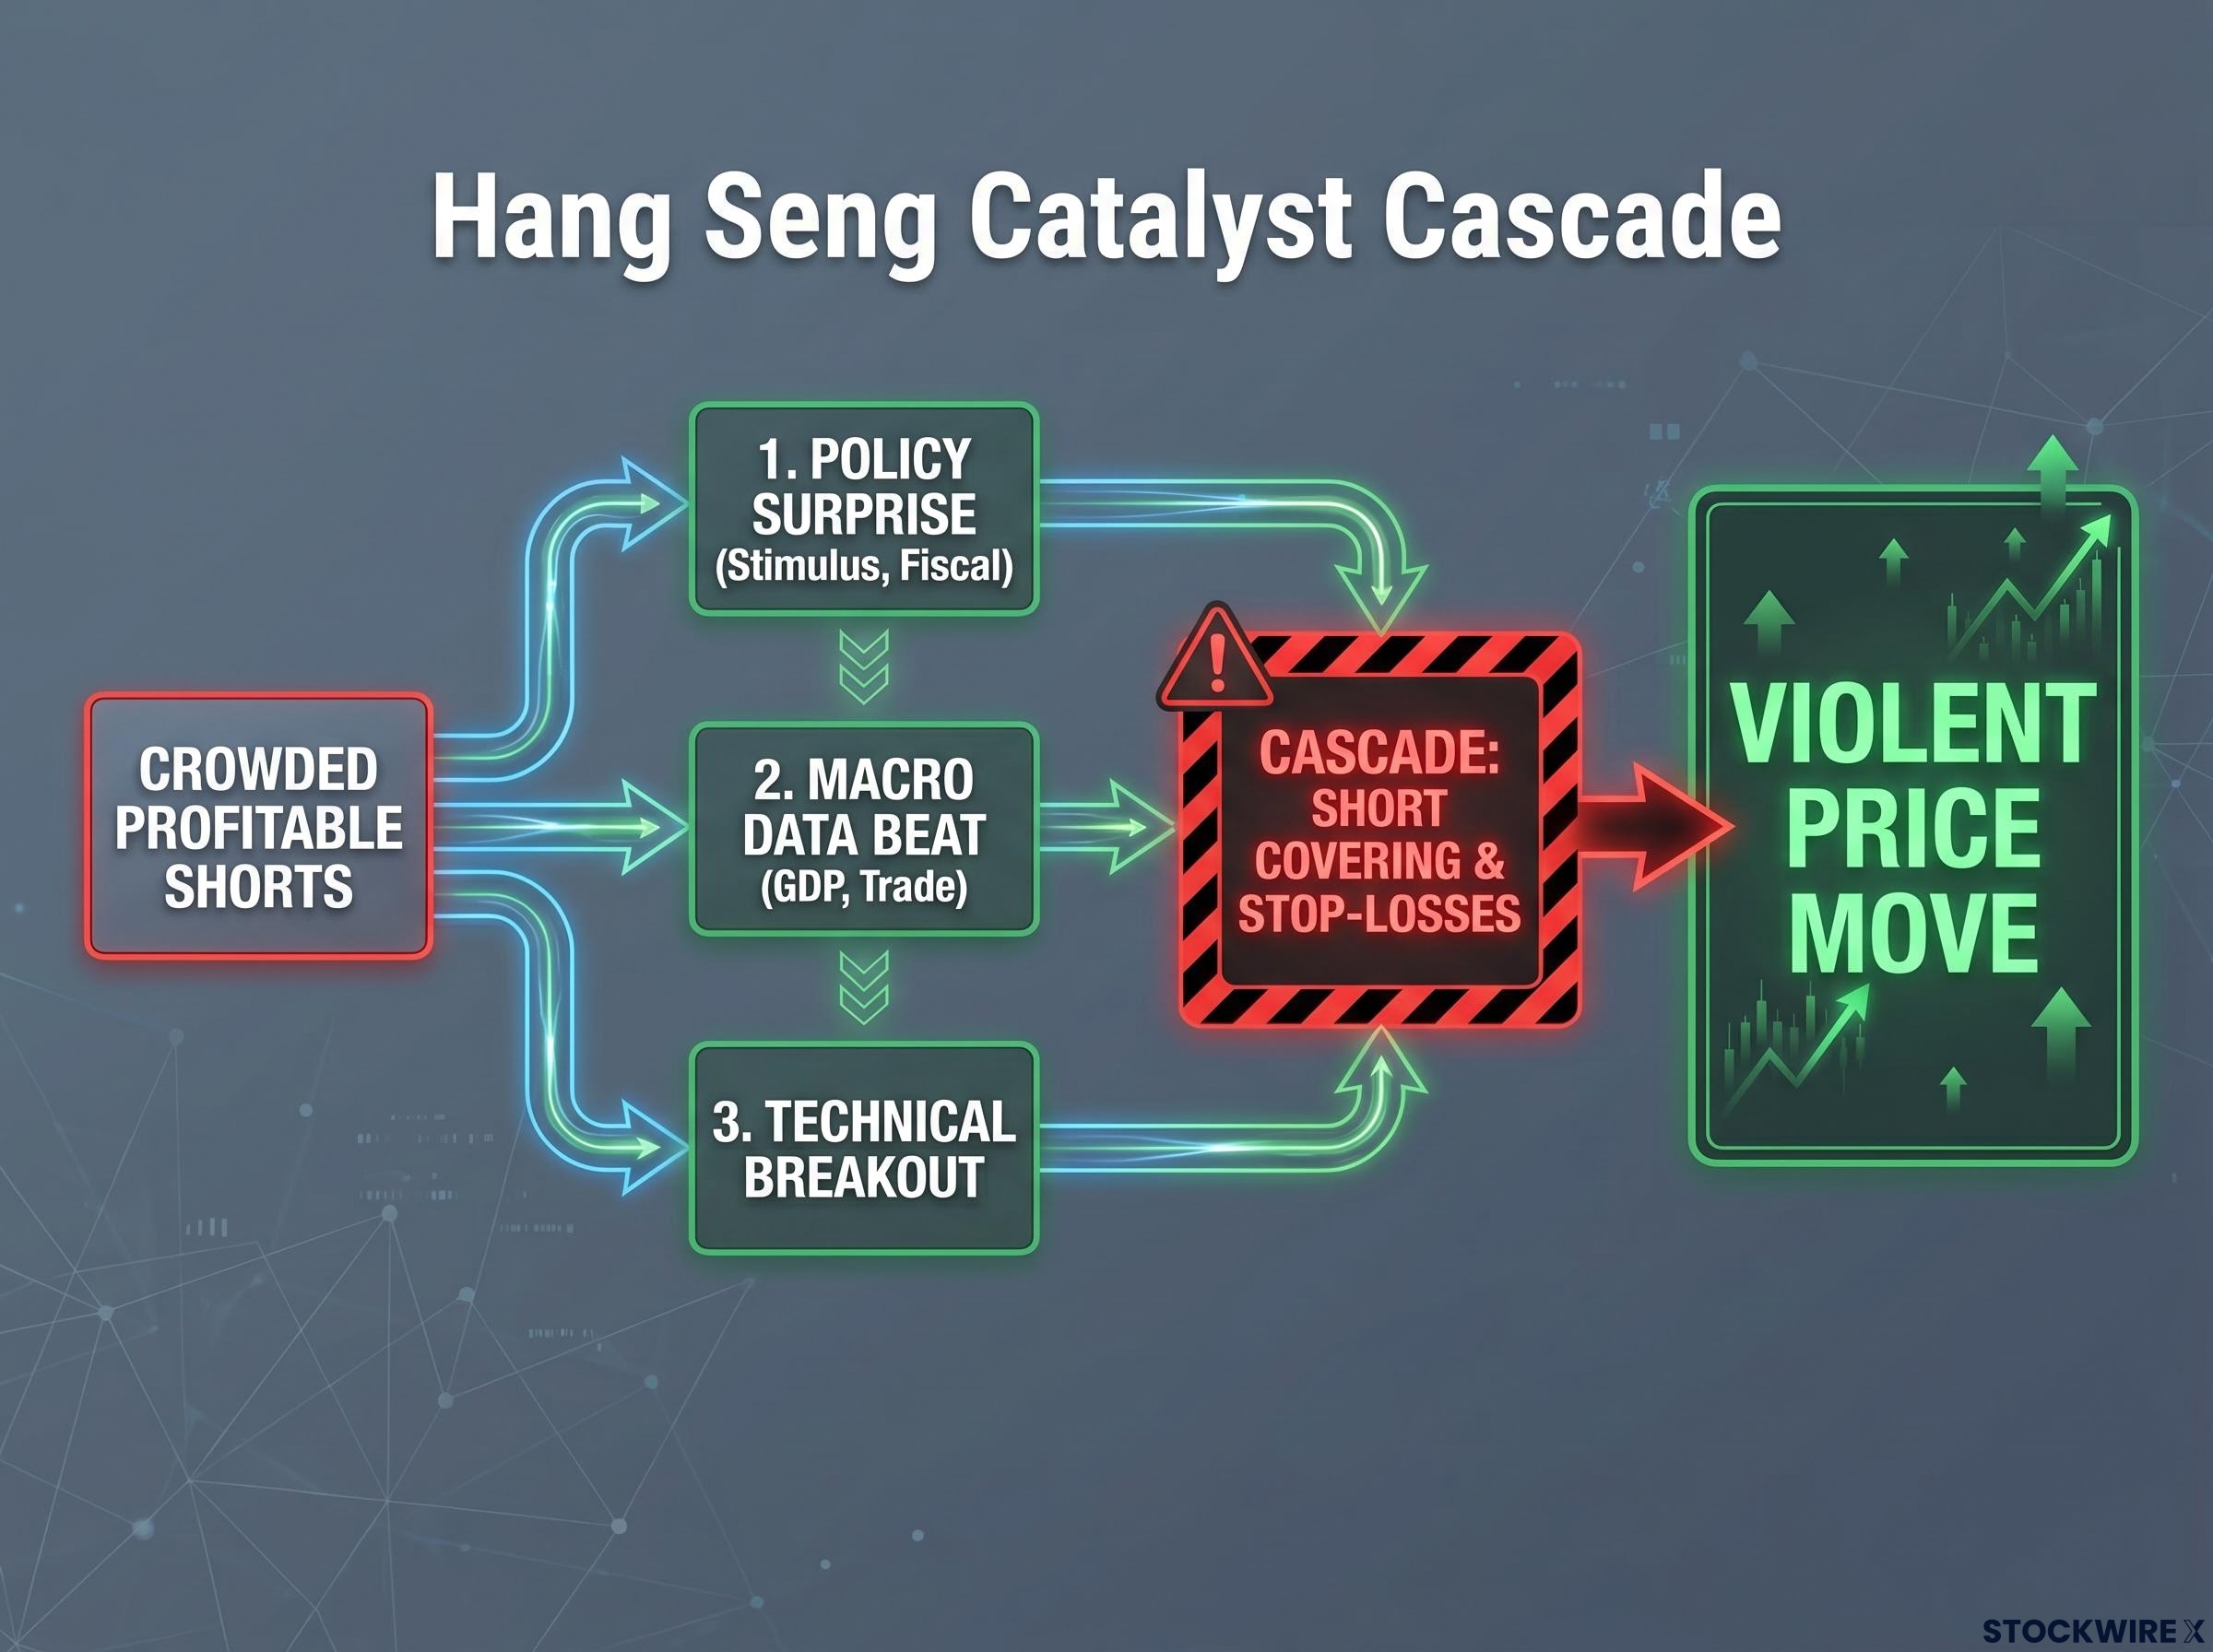
Here is why initiating new shorts at this extreme is structurally unattractive. When profitable shorts crowd into the same trade, any catalyst that pushes prices higher triggers a cascade:
The most extreme bearish positioning in the global dataset does not mean the Hang Seng is about to rally. It means that if anything goes right for China or Hong Kong, the size of the short book transforms a modest positive catalyst into a violent price move that runs well beyond what fundamentals alone would justify.
For existing short holders, the question is whether to lock in profits. For anyone considering new bearish positions, the risk-reward is stark: limited incremental downside reward, outsized risk of being caught in a squeeze that cascades.
For investors considering new Hang Seng shorts, our full explainer on short selling risks covers the borrow fees, squeeze mechanics, and timing costs that make crowded short positions structurally expensive even with a correct directional thesis.
The KOSPI presents a different kind of danger. Long positioning has remained at elevated, extended levels even as the market has weakened in recent sessions, opening a growing disconnect between investor positioning and what prices are actually doing.
This divergence must resolve. There is no neutral outcome available.
If the bulls are right, price rebounds to validate the extended long positioning, and flow amplification (the mechanical effect of additional buying triggered by rising prices) accelerates the move higher. If they are wrong, longs capitulate, turning into forced selling that mechanically accelerates the downside. The combination of stretched positioning and deteriorating price action makes this one of the higher-convexity setups in the current global equity map.
Goldman Sachs quantified the algorithmic selling cascades that make this mechanical effect concrete: $93 billion in net long global equity exposure held by trend-following funds creates a projected $100 billion-plus in rule-driven selling if price trends reverse, with no discretionary override available to slow the process.
What this tells you is that whoever is long here is betting the recent weakness is noise rather than signal. If they are wrong, the exit is crowded, the losses are amplified, and the selling is mechanical rather than fundamental.
Passive buy-and-hold positioning is structurally inappropriate in a higher-convexity environment like this. Three risk management responses apply:
Sitting on the fence is itself a risk management decision here, and one that requires justification.
The four regional stories above share a single framework: direction comes from fundamentals and macro; sizing and hedge calibration come from positioning extremes. Citi’s full positioning map implies specific actions across each market:
Wolfe Research mapped overlapping H2 2026 tail risks in a parallel framework published the same month, identifying yen carry trade unwind, AI capex disappointment, private credit stress, and bond vigilante dynamics as compounding pressures that could accelerate any positioning-driven unwind.
The consensus is most likely to break first in two places: the Russell 2000 on negative macro data, and the Hang Seng on any positive China or Hong Kong catalyst. The markets where you thought the risk was manageable are where the positioning data says to be more conservative, and the market that looks like a clear short is the one where the crowded trade creates the most dangerous surprise risk.
For investors who are not active traders, the practical takeaway is not a list of trades. Positioning data earns its place in portfolio management through risk sizing and hedge structure decisions. Use it to calibrate how much you hold and how you protect it, not to generate new directional bets.
This article is for informational purposes only and should not be considered financial advice. Investors should conduct their own research and consult with financial professionals before making investment decisions. These statements are speculative and subject to change based on market developments and company performance.
—
Global equity positioning measures how much capital institutional investors have committed to long or short bets across markets. It matters because crowded positions amplify price moves when the narrative shifts, turning an ordinary surprise into a violent repricing.
The Hang Seng carries the most extreme bearish positioning of any major global index, and those short positions are sitting on substantial profits. Any positive catalyst from China, whether a stimulus announcement, a data beat, or a technical breakout, could trigger a cascade of short covering that drives prices far beyond what fundamentals alone would justify.
The easy gains from short-covering mechanics have already run, and profit levels in existing long positions remain modest, meaning holders have little cushion if a negative rate or growth surprise arrives. Holding small-cap exposure now requires the macro thesis to be correct, not just continued momentum.
Positioning data is most useful as a risk calibration tool, not a directional prediction tool. It tells you where to tighten stops, reduce sizing, or add hedge overlays, rather than when to enter or exit a trade outright.
The FTSE 100 is dominated by global sectors and commodities, so its risk is driven by commodity prices and the macro cycle rather than the domestic European economy. The DAX and EuroStoxx are currently seeing active institutional de-risking, with longs being unwound and new shorts being built simultaneously, which is a fundamentally different and more fragile positioning profile.