U.S. equity positioning has reached its most crowded levels since late 2021, and Wolfe Research analyst Chris Senyek argues the current rally has entered a phase where even minor negative catalysts could trigger outsized unwinds. Published on 19 May 2026, Wolfe’s warning draws not from theoretical modelling but from recurring themes across recent investor meetings, giving it a real-time diagnostic quality. The stock market risks Senyek identified span five distinct vectors: yen carry trade exposure, AI capital expenditure disappointment, private credit stress, persistent inflation, and bond vigilante dynamics. Each carries independent weight. Together, against a backdrop of historically extended long positioning, they form a risk map that demands attention heading into the second half of 2026. What follows is a detailed breakdown of all five tail risks, enriched with the latest market data, so readers can stress-test their own portfolio exposures against each one.
Why crowded equity positioning makes this rally unusually fragile
Most investors read the rally as a sign of conviction. The positioning data tell a different story: it is a sign of uniformity, and uniformity is where fragility lives.
Crowded positioning amplifies downside velocity because unwinding happens simultaneously across overlapping trade books, not gradually. When nearly everyone holds the same names at the same weight, the exit door narrows precisely when it matters most. Momentum-driven rallies carry a specific vulnerability here. They do not require bad news to reverse. They only require the absence of continued good news.
Three independent data sources confirm the crowding:
- Bank of America Global Fund Manager Survey (early May 2026): Net equity allocation at its highest since late 2021; cash levels near 4.0%, the lowest since 2021. “Long Magnificent 7/AI” flagged as the most crowded trade for the 9th consecutive month.
- Goldman Sachs composite positioning indicator (CNBC, 13 May 2026): Near the most extended long reading since late 2021, combining futures, options, and fund flows.
- CFTC Commitments of Traders (as of 12 May 2026): Net long E-mini S&P 500 futures in the top decile of observations over the past five years.
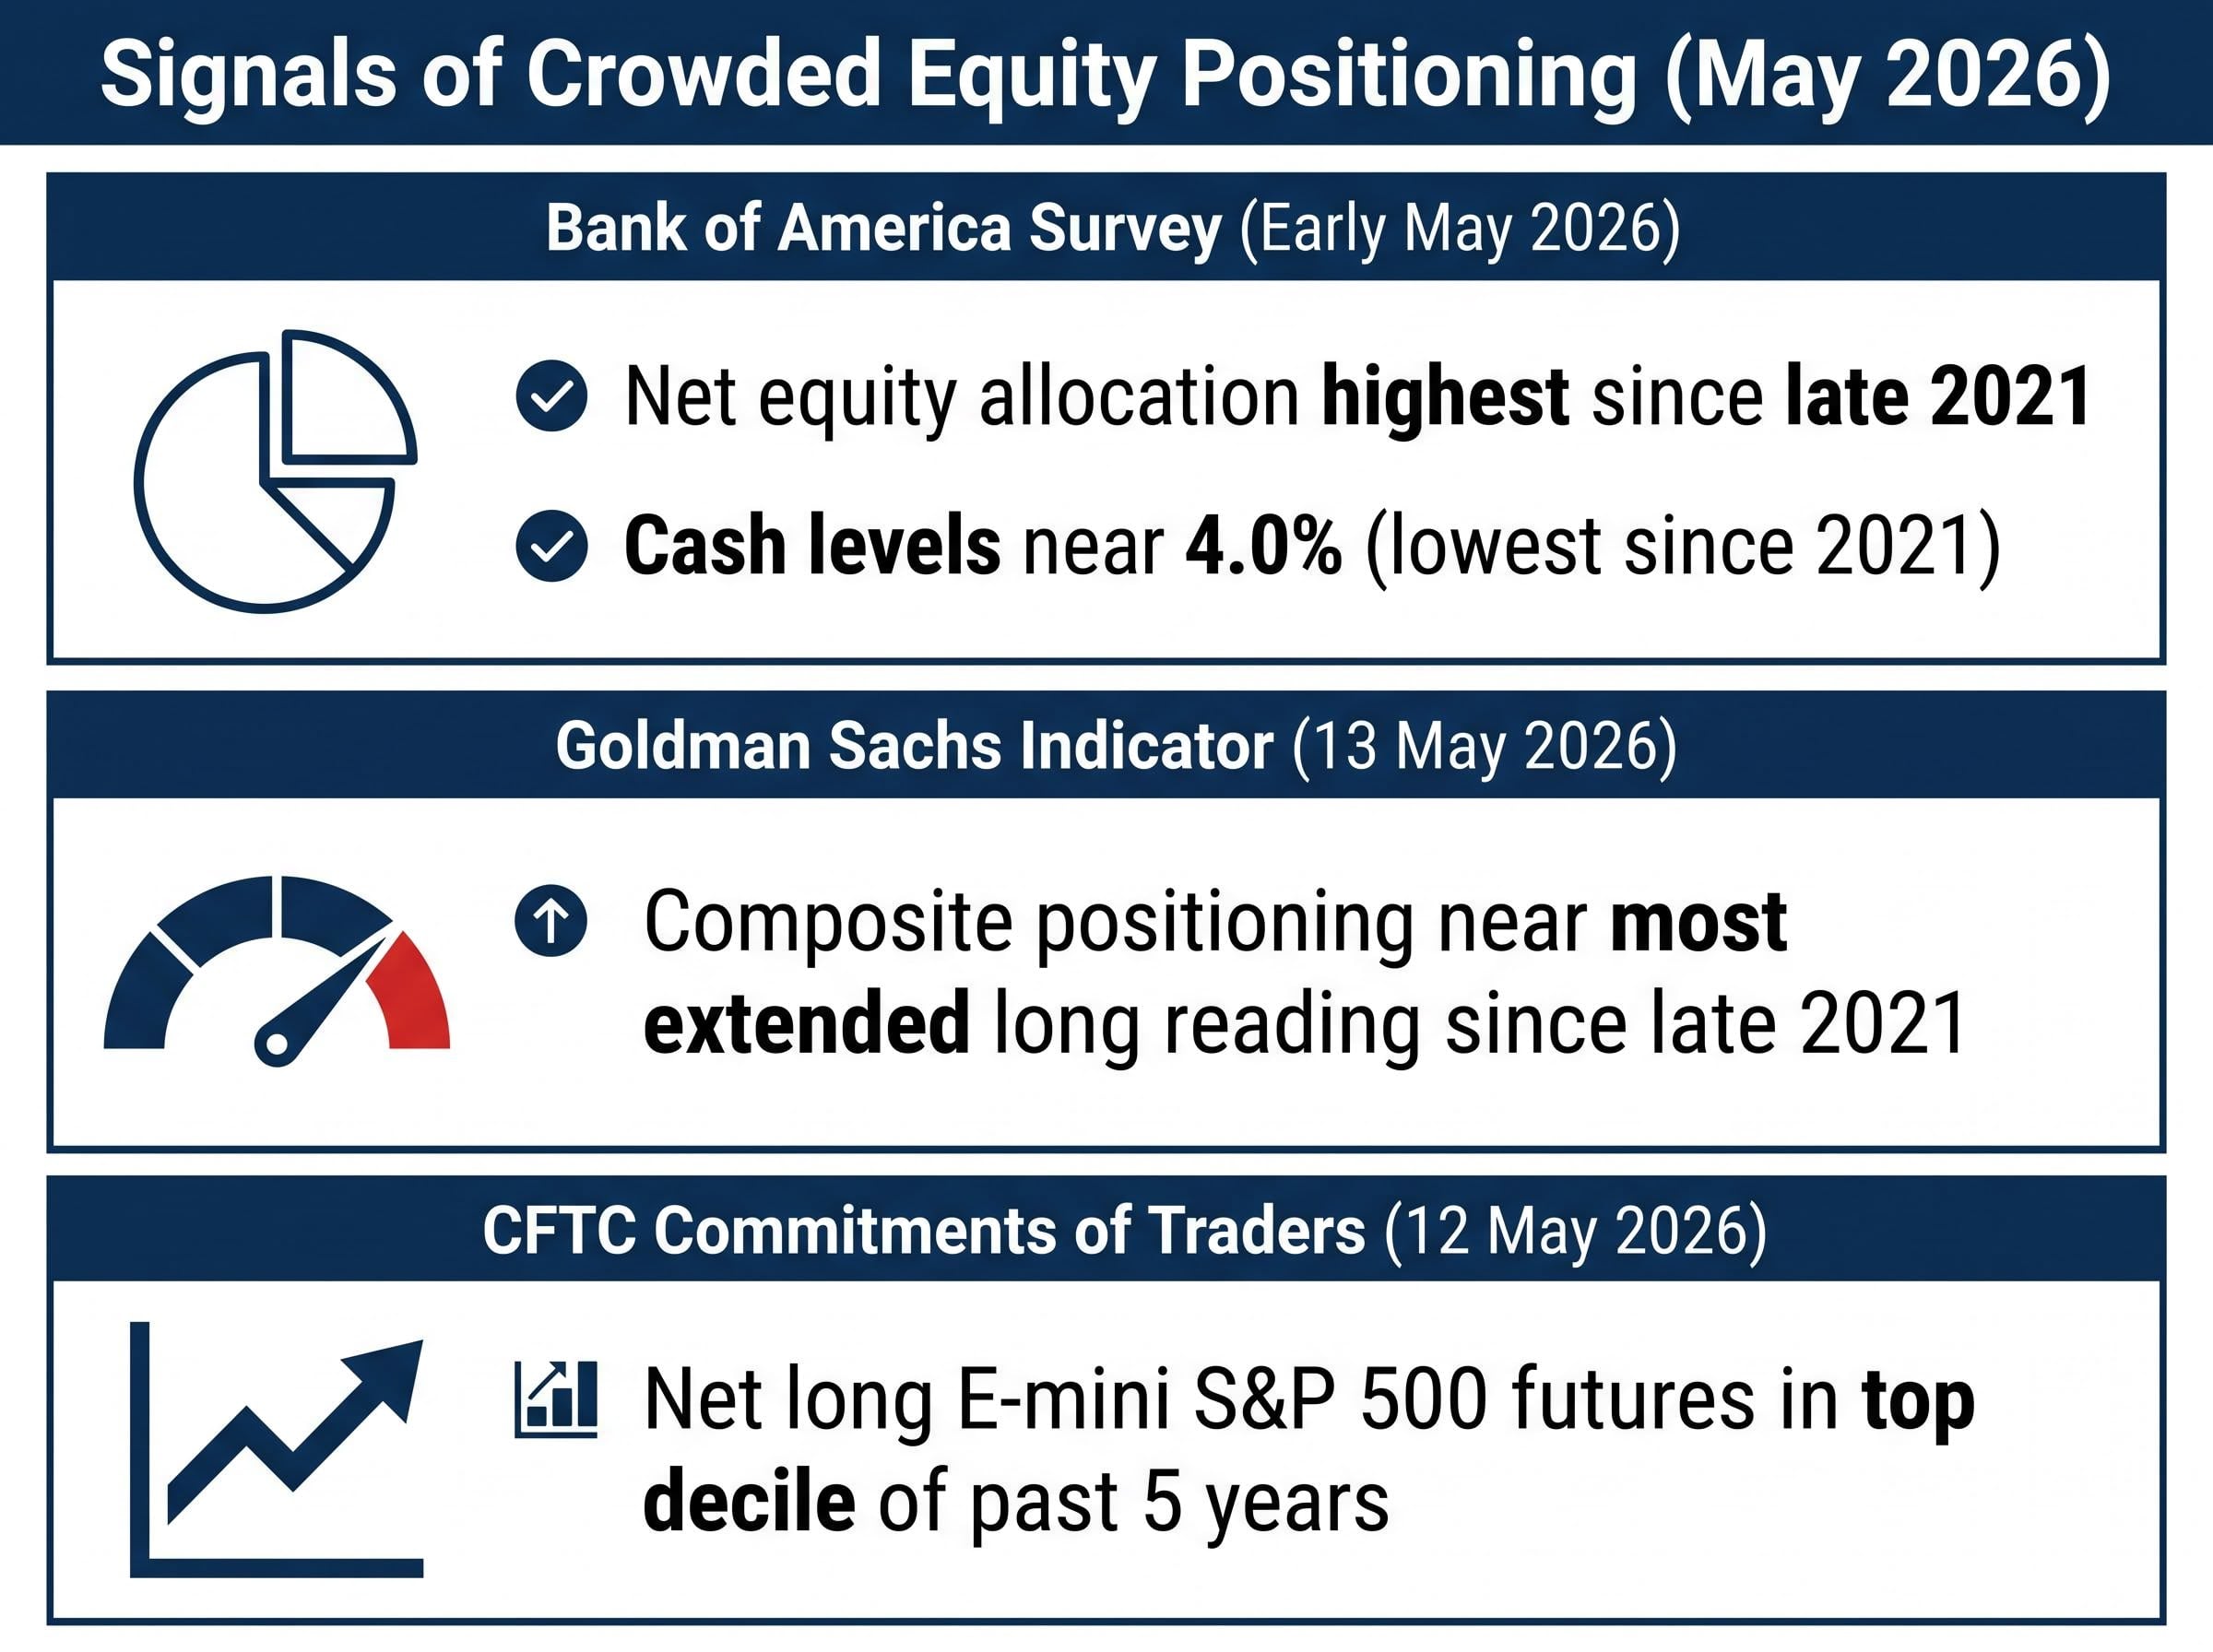
Goldman Sachs described retail and systematic strategies as “near max long” U.S. equities versus their model-determined ranges.
The same survey data underpinning Wolfe’s crowding diagnosis also triggered a BofA sell warning, with BofA strategist Michael Hartnett designating early June 2026 as the year’s best window to trim equity risk after cash levels fell to 3.9%, crossing the firm’s 4.0% contrarian threshold for the first time since 2021.
Wolfe’s warning functions as the analytical lens through which all five subsequent risks should be read. None of these risks are unprecedented in isolation. What makes them dangerous is the positioning context in which they would arrive.
When big ASX news breaks, our subscribers know first
The yen carry trade: a hidden lever under U.S. growth stocks
The yen carry trade is one of those mechanisms that sounds like a foreign exchange concern until it isn’t. In its simplest form, it works like this: investors borrow Japanese yen at near-zero interest rates, convert those yen into dollars, and deploy the proceeds into higher-yielding assets, including U.S. equities. Growth and AI names have been among the most popular destinations.
The trade is profitable as long as the yen stays weak and Japanese rates stay low. When either condition shifts, the positions need to be unwound, which means selling the U.S. assets that were purchased with the borrowed yen.
What BoJ policy normalisation means for the carry trade
The Bank of Japan held its short-term policy rate at 0.0-0.1% at its 26 April 2026 meeting but signalled tolerance for gradual yen appreciation and continued a measured reduction in Japanese Government Bond purchases. BoJ tightening does not need to be dramatic to unwind positions; it only needs to shift expectations about where the yen is heading.
USD/JPY sat around 154-155 as of 17 May 2026, after trading above 160 in late April before suspected BoJ and Ministry of Finance intervention. The currency pair remains historically weak, but multiple major banks have flagged the instability.
| Bank | USD/JPY trigger level | Cited market impact |
|---|---|---|
| Goldman Sachs (Bloomberg, 29 April 2026) | 10-15% yen rally from current levels | U.S. tech and high-beta equities vulnerable due to carry trade popularity |
| HSBC (Reuters, 3 May 2026) | USD/JPY toward 130-135 | “A sizable de-leveraging” across global equities, especially U.S. growth stocks |
| JPMorgan (FT, 5 March 2026) | Rapid yen rebound from “extremely undervalued” levels | Forced unwind of yen-funded carry trades in U.S. equities and credit |
HSBC cited past episodes (1998, 2016, 2020) where yen spikes coincided with global equity stress. For U.S. investors concentrated in tech and AI names, the yen is an invisible leverage mechanism in their portfolios they may not have considered.
The scale of Japan’s yen intervention campaign during Golden Week 2026 adds another dimension to this risk: funding an estimated 8-9 trillion yen in currency operations likely required liquidating $40-50 billion in U.S. Treasury holdings, a derived estimate that has placed bond investors on alert for additional yield pressure alongside any carry trade unwind.
AI spending and private credit: the two risks hiding inside the rally’s engine
The two assets that powered the rally’s narrative, AI infrastructure and private credit expansion, are both showing early stress signals. Neither has cracked. Both are creaking.
AI capex signals:
- The Wall Street Journal reported on 10 May 2026 that aggregate 2026 AI and data-centre capital expenditure guidance came in “slightly below the most bullish sell-side estimates” after Q1 earnings.
- Morgan Stanley (Bloomberg, 2 April 2026) cited “elongated sales cycles” and customers pushing for clearer AI return on investment before committing to large deployments.
- Several hyperscalers reiterated high AI-related capex but shifted emphasis toward “efficiency” and “monetisation,” a subtle but meaningful change in language.
Goldman Sachs equity research (CNBC, 6 May 2026) noted that while AI infrastructure spending remains strong, “incremental upside appears more limited” versus prior expectations, flagging the risk that a pause in AI capex growth could weigh on semiconductor and equipment stocks that had priced in multi-year hyper-growth.
The AI infrastructure spending cycle now represents 4.9% of U.S. GDP, surpassing both the dot-com era peak of roughly 4.2% and the cloud buildout peak of roughly 3.8%, a scale comparison that helps explain why even modest guidance disappointments relative to the most bullish sell-side estimates carry outsized re-rating risk for semiconductor and equipment stocks.
Private credit stress signals:
- Fitch Ratings (22 April 2026) estimated the trailing-12-month default rate in U.S. middle-market private credit at 4.5% in Q1 2026, up from 3.1% a year earlier. Healthcare services and consumer discretionary were the most affected sectors.
- Moody’s Analytics (30 March 2026) flagged rising amendments, covenant resets, and “pockets of stress” in secondary private credit markets.
- The Financial Times (8 May 2026) reported higher incidences of payment-in-kind toggles and maturity extensions, with bank strategists warning that private credit has “not yet been tested through a full default cycle.”
Both risks share a common trigger. A “higher for longer” rate environment extends leverage costs for AI projects and private credit borrowers simultaneously. And both risks affect exactly the sectors that dominate crowded long portfolios, meaning any deterioration hits portfolio concentration hard.
Inflation’s second wind and the Fed’s shrinking room to manoeuvre
The market’s rate-cut hopes and the actual inflation data are pointing in different directions, and the gap is widening.
April 2026 CPI (Bureau of Labor Statistics, released 13 May 2026) showed headline inflation at +3.4% year-on-year and core inflation at +3.6% year-on-year. March 2026 core PCE (Bureau of Economic Analysis) came in at +2.8% year-on-year. Both measures remain well above the Federal Reserve’s 2% target.
Fed Chair Jerome Powell, speaking at the 29 April 2026 FOMC press conference: “The recent data have not given us greater confidence that inflation is moving sustainably toward 2 percent.”
The Federal Reserve’s April 2026 FOMC press conference transcript establishes the official basis for Powell’s inflation assessment, with the Chair explicitly stating that recent data had not provided greater confidence that inflation was moving sustainably toward the 2% target, a framing that markets have since interpreted as keeping rate cuts off the table through at least mid-year.
The implication is not primarily a rate-hike scenario. It is a “higher for longer” scenario that gradually erodes equity multiples and borrowing costs. Persistent inflation gives bond markets a reason to push yields higher independent of Fed action, the bond vigilante dynamic that connects directly to equity valuations.
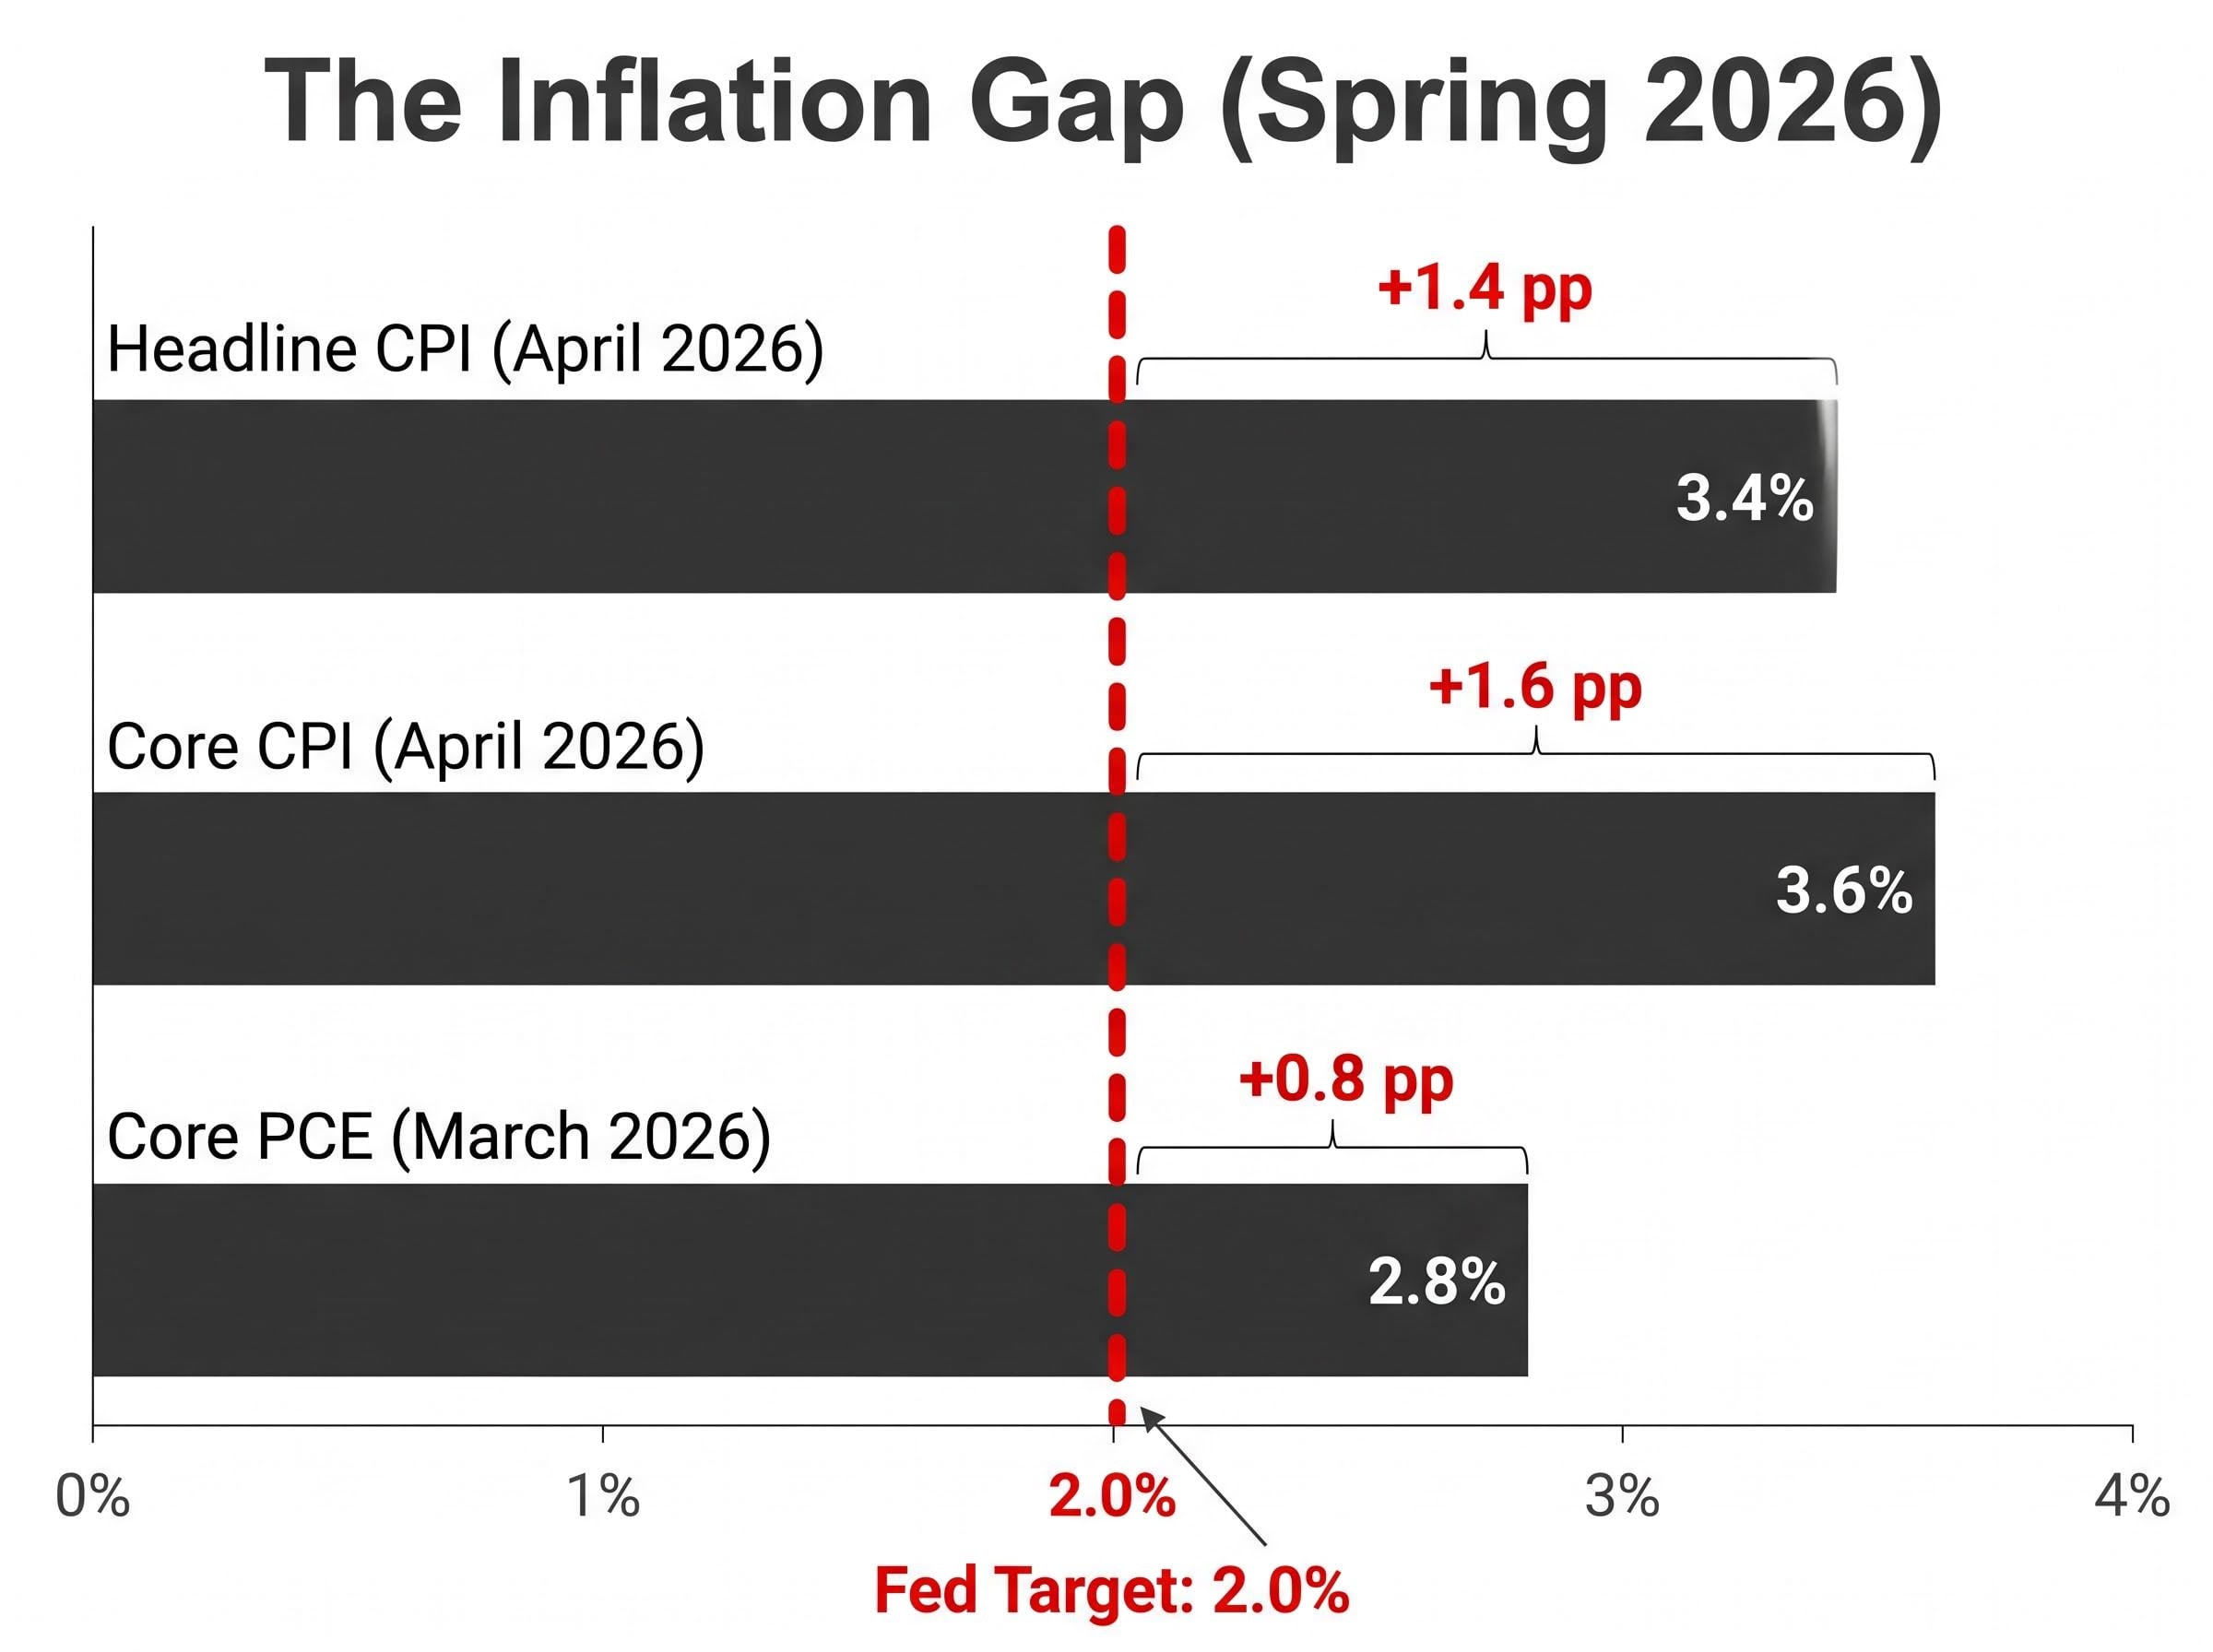
| Measure | Latest reading | Fed target | Gap |
|---|---|---|---|
| Headline CPI (April 2026) | +3.4% y/y | 2.0% | +1.4 pp |
| Core CPI (April 2026) | +3.6% y/y | 2.0% | +1.6 pp |
| Core PCE (March 2026) | +2.8% y/y | 2.0% | +0.8 pp |
| Market-implied 2026 cuts | 2-3 cuts (~50-75 bps) | Down from 100+ bps expected at year-start | |
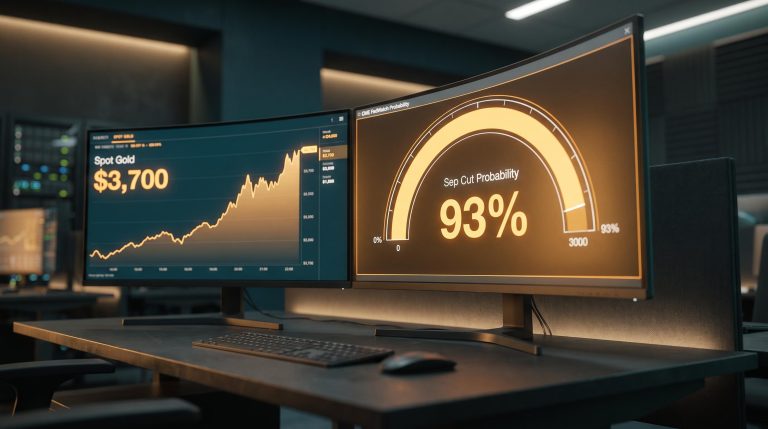
CME FedWatch data (CNBC, 15 May 2026) showed only a 60-65% probability of a first 25 basis point cut in September. Total 2026 cuts have compressed to approximately 2-3 from the 100+ basis points expected at the start of the year. This is not abstract macroeconomics. It is the mechanism that keeps yields elevated, which directly compresses the valuation multiples equity investors are currently paying near decade-high levels.
Energy costs, bond vigilantes, and the complete risk map for H2 2026
The 10-year Treasury yield moved from approximately 4.47% on 14 May to 4.66% by 19 May 2026, according to FRED DGS10 data. That trajectory, decisively above 4.5% and pressing toward 4.7%, brings the bond vigilante thesis into sharper focus.
The Financial Times (9 May 2026) described renewed talk of bond vigilantes as yields climbed, with strategists warning that a sustained move above 5% on the 10-year could force explicit fiscal consolidation debates. JPMorgan (CNBC, 25 April 2026) argued that a further rise in long-term yields, particularly driven by term premium, could pressure risk assets and complicate fiscal decision-making.
Elevated energy costs sit at the centre of this dynamic as the fifth tail risk Wolfe identified. Higher energy prices extend inflationary pressures independently of Fed policy, complicating the soft-landing narrative and keeping the Fed on hold longer. Energy-driven inflation makes rate cuts less likely, which in turn intensifies every other risk on the map.
Energy-driven inflation dynamics are currently being absorbed by corporate margin compression rather than retail price pass-through, with major consumer goods firms accepting 150 basis point gross margin reductions to protect sales volumes, but analysts identify sustained Brent crude above $85-$90 per barrel through Q3 2026 as the threshold at which that containment breaks down and broad goods inflation re-accelerates.
How the five risks interact under a “higher for longer” scenario
The yen carry trade, AI capex, and private credit risks all intensify if rates remain elevated. Higher borrowing costs squeeze leveraged yen positions, stretch AI project timelines, and push private credit default rates further upward. Energy-driven inflation makes rate cuts less likely, creating a feedback loop across multiple risks simultaneously. This is why Wolfe’s framing matters: it is the combination and interaction of risks, not any single factor, that distinguishes the current environment.
Wolfe Research analyst Chris Senyek (19 May 2026) noted that none of these risks were designated as base case outcomes; all were described as recurring themes across multiple recent investor meetings. The consolidated risk map:
- Yen carry trade unwind: A disorderly yen rally forces simultaneous selling of U.S. growth and AI positions funded by yen borrowing.
- AI capex disappointment: Guidance falling short of the most bullish estimates re-rates semiconductor and equipment stocks priced for hyper-growth.
- Private credit stress: Rising defaults (from 3.1% to 4.5%) in an asset class that has not yet been tested through a full cycle.
- Persistent inflation: CPI and PCE readings well above the 2% target constrain the Fed’s ability to cut rates and rescue markets.
- Energy costs and bond vigilantes: Elevated energy prices sustain inflation while rising yields compress equity multiples and pressure fiscal policy.
Positioning for a market that has forgotten how to hedge
Wolfe’s core thesis reduces to one sentence: the rally is real, but the margin for error is thin and shrinking.
The framing matters. These are tail risks, not base cases. This is a probability-weighting exercise, not a prediction of imminent collapse. But when positioning is this extended and cash levels sit at 4.0% (the lowest since 2021 per BofA), the market has little defensive dry powder already allocated. Senyek noted that these risks were surfacing as “recurring themes across multiple recent investor meetings,” suggesting institutional awareness is growing even as portfolios remain fully invested.
The practical value of Wolfe’s analysis lies in translating it into a structured audit. Readers may consider the following against their own holdings:
- How concentrated is your portfolio in AI, semiconductor, or tech names that would be affected by both a yen carry unwind and an AI capex disappointment?
- Does your portfolio carry direct or indirect private credit exposure through alternative funds or structured products?
- How would your equity holdings perform if the Fed delivers only two cuts in 2026 instead of the four or more the market priced in at the start of the year?
- At what 10-year yield level does your portfolio’s rate sensitivity become a material drag on returns?
None of these questions require predicting which risk fires first. They require knowing where you are exposed if any of them do.
This article is for informational purposes only and should not be considered financial advice. Investors should conduct their own research and consult with financial professionals before making investment decisions. These statements are speculative and subject to change based on market developments and company performance.