How Global Equity Positioning Flags the Next Violent Moves
30 mins ago
Oil prices have retraced near pre-conflict levels since the Strait of Hormuz crisis broke in late February 2026, and U.S.-Iran technical talks resumed in Doha today. On the surface, the crisis looks like it is winding down. It is not.
The inflation pass-through from the earlier price spike has not finished working through the U.S. economy. The Federal Reserve has flipped from a rate-cut posture to a potential rate-hike posture inside six months. The legal status of strait access remains contested. Treating the normalisation in spot crude prices as a signal that the macro risk has resolved is the specific mistake this analysis exists to correct.
Here is the full transmission chain from energy shock to inflation persistence to monetary policy reversal, mapped so you can assess whether your current positioning accounts for a risk that markets may be systematically underpricing during exactly this kind of ambiguous recovery phase.
The White House has indicated the strait is open. Iran maintains it retains partial authority over the passage. That disagreement has not been formally resolved, and it sits at the top of every risk calculation that touches energy supply.
The U.S.-Iran framework memorandum of understanding (MOU), concluded earlier in June 2026, took some pressure off the immediate situation without returning conditions to the pre-conflict baseline. Technical-level negotiations resumed today, 30 June 2026, in Doha, Qatar. Higher-level talks remain unscheduled.
Three specific ambiguities define the current access arrangement:
What this means for you: U.S. investors are pricing energy supply reliability on a political arrangement that either side can unwind. That asymmetry is not visible in spot crude prices, but it is embedded in the forward risk profile of every portfolio with energy cost exposure.
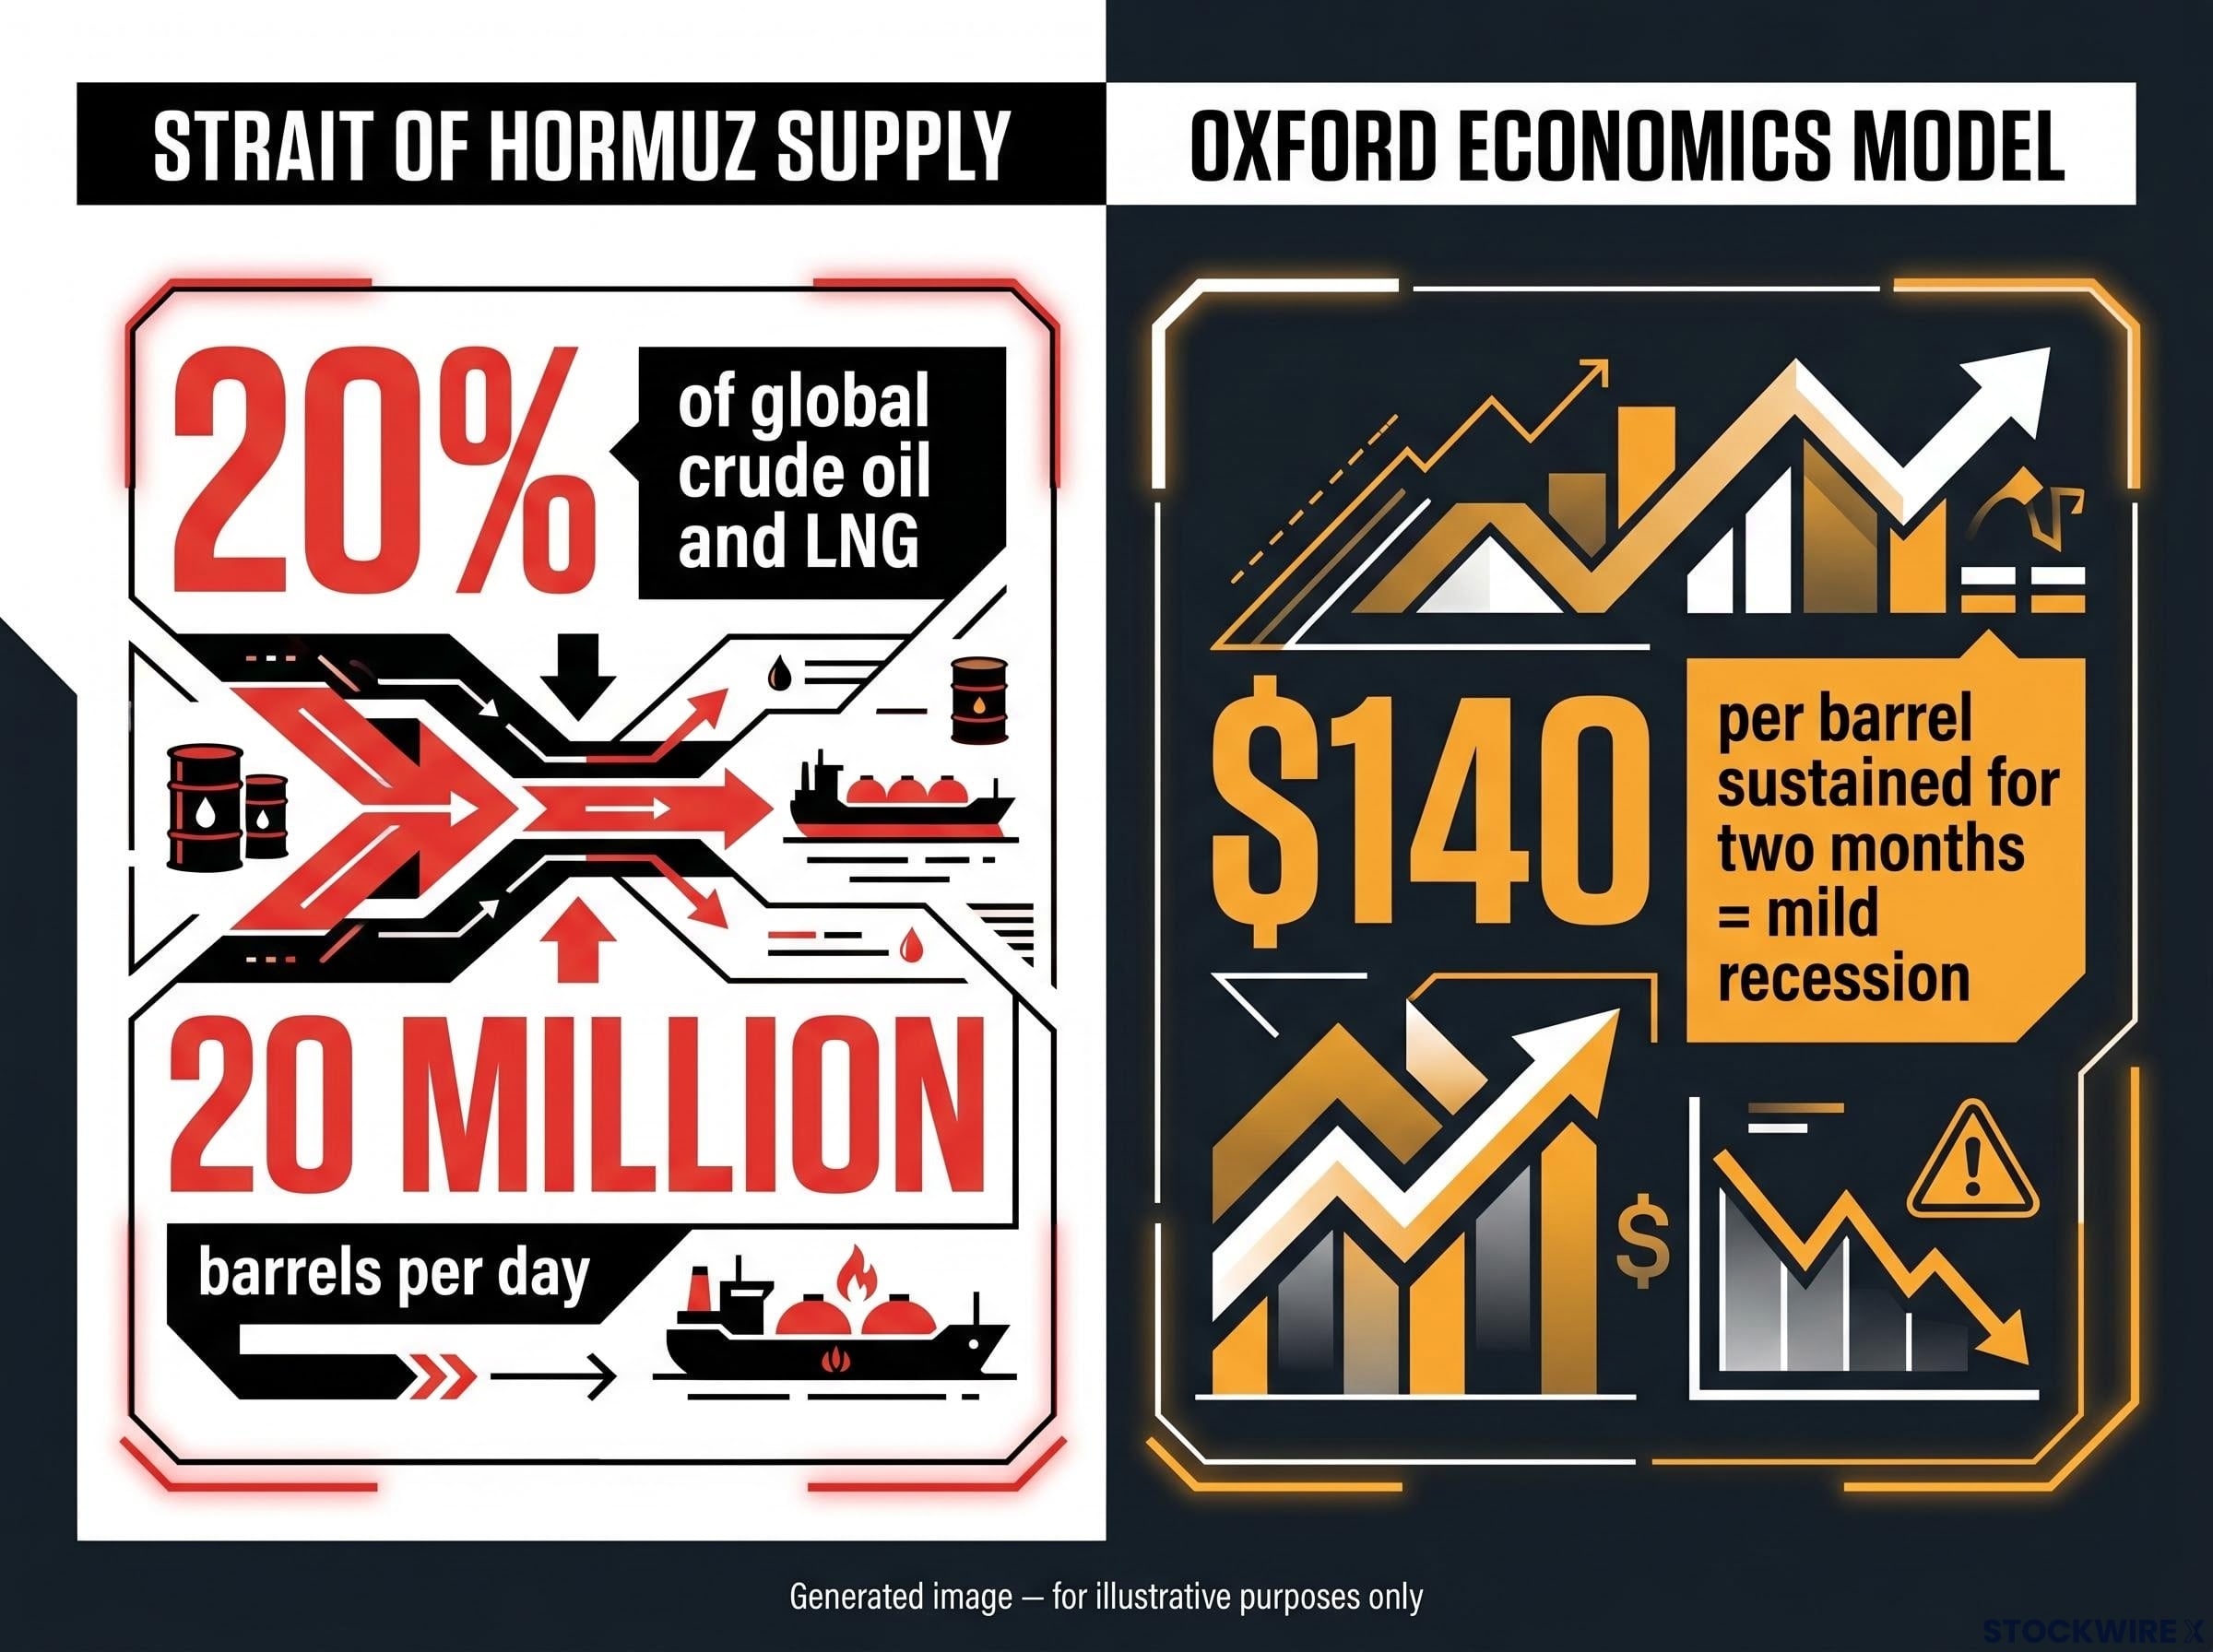
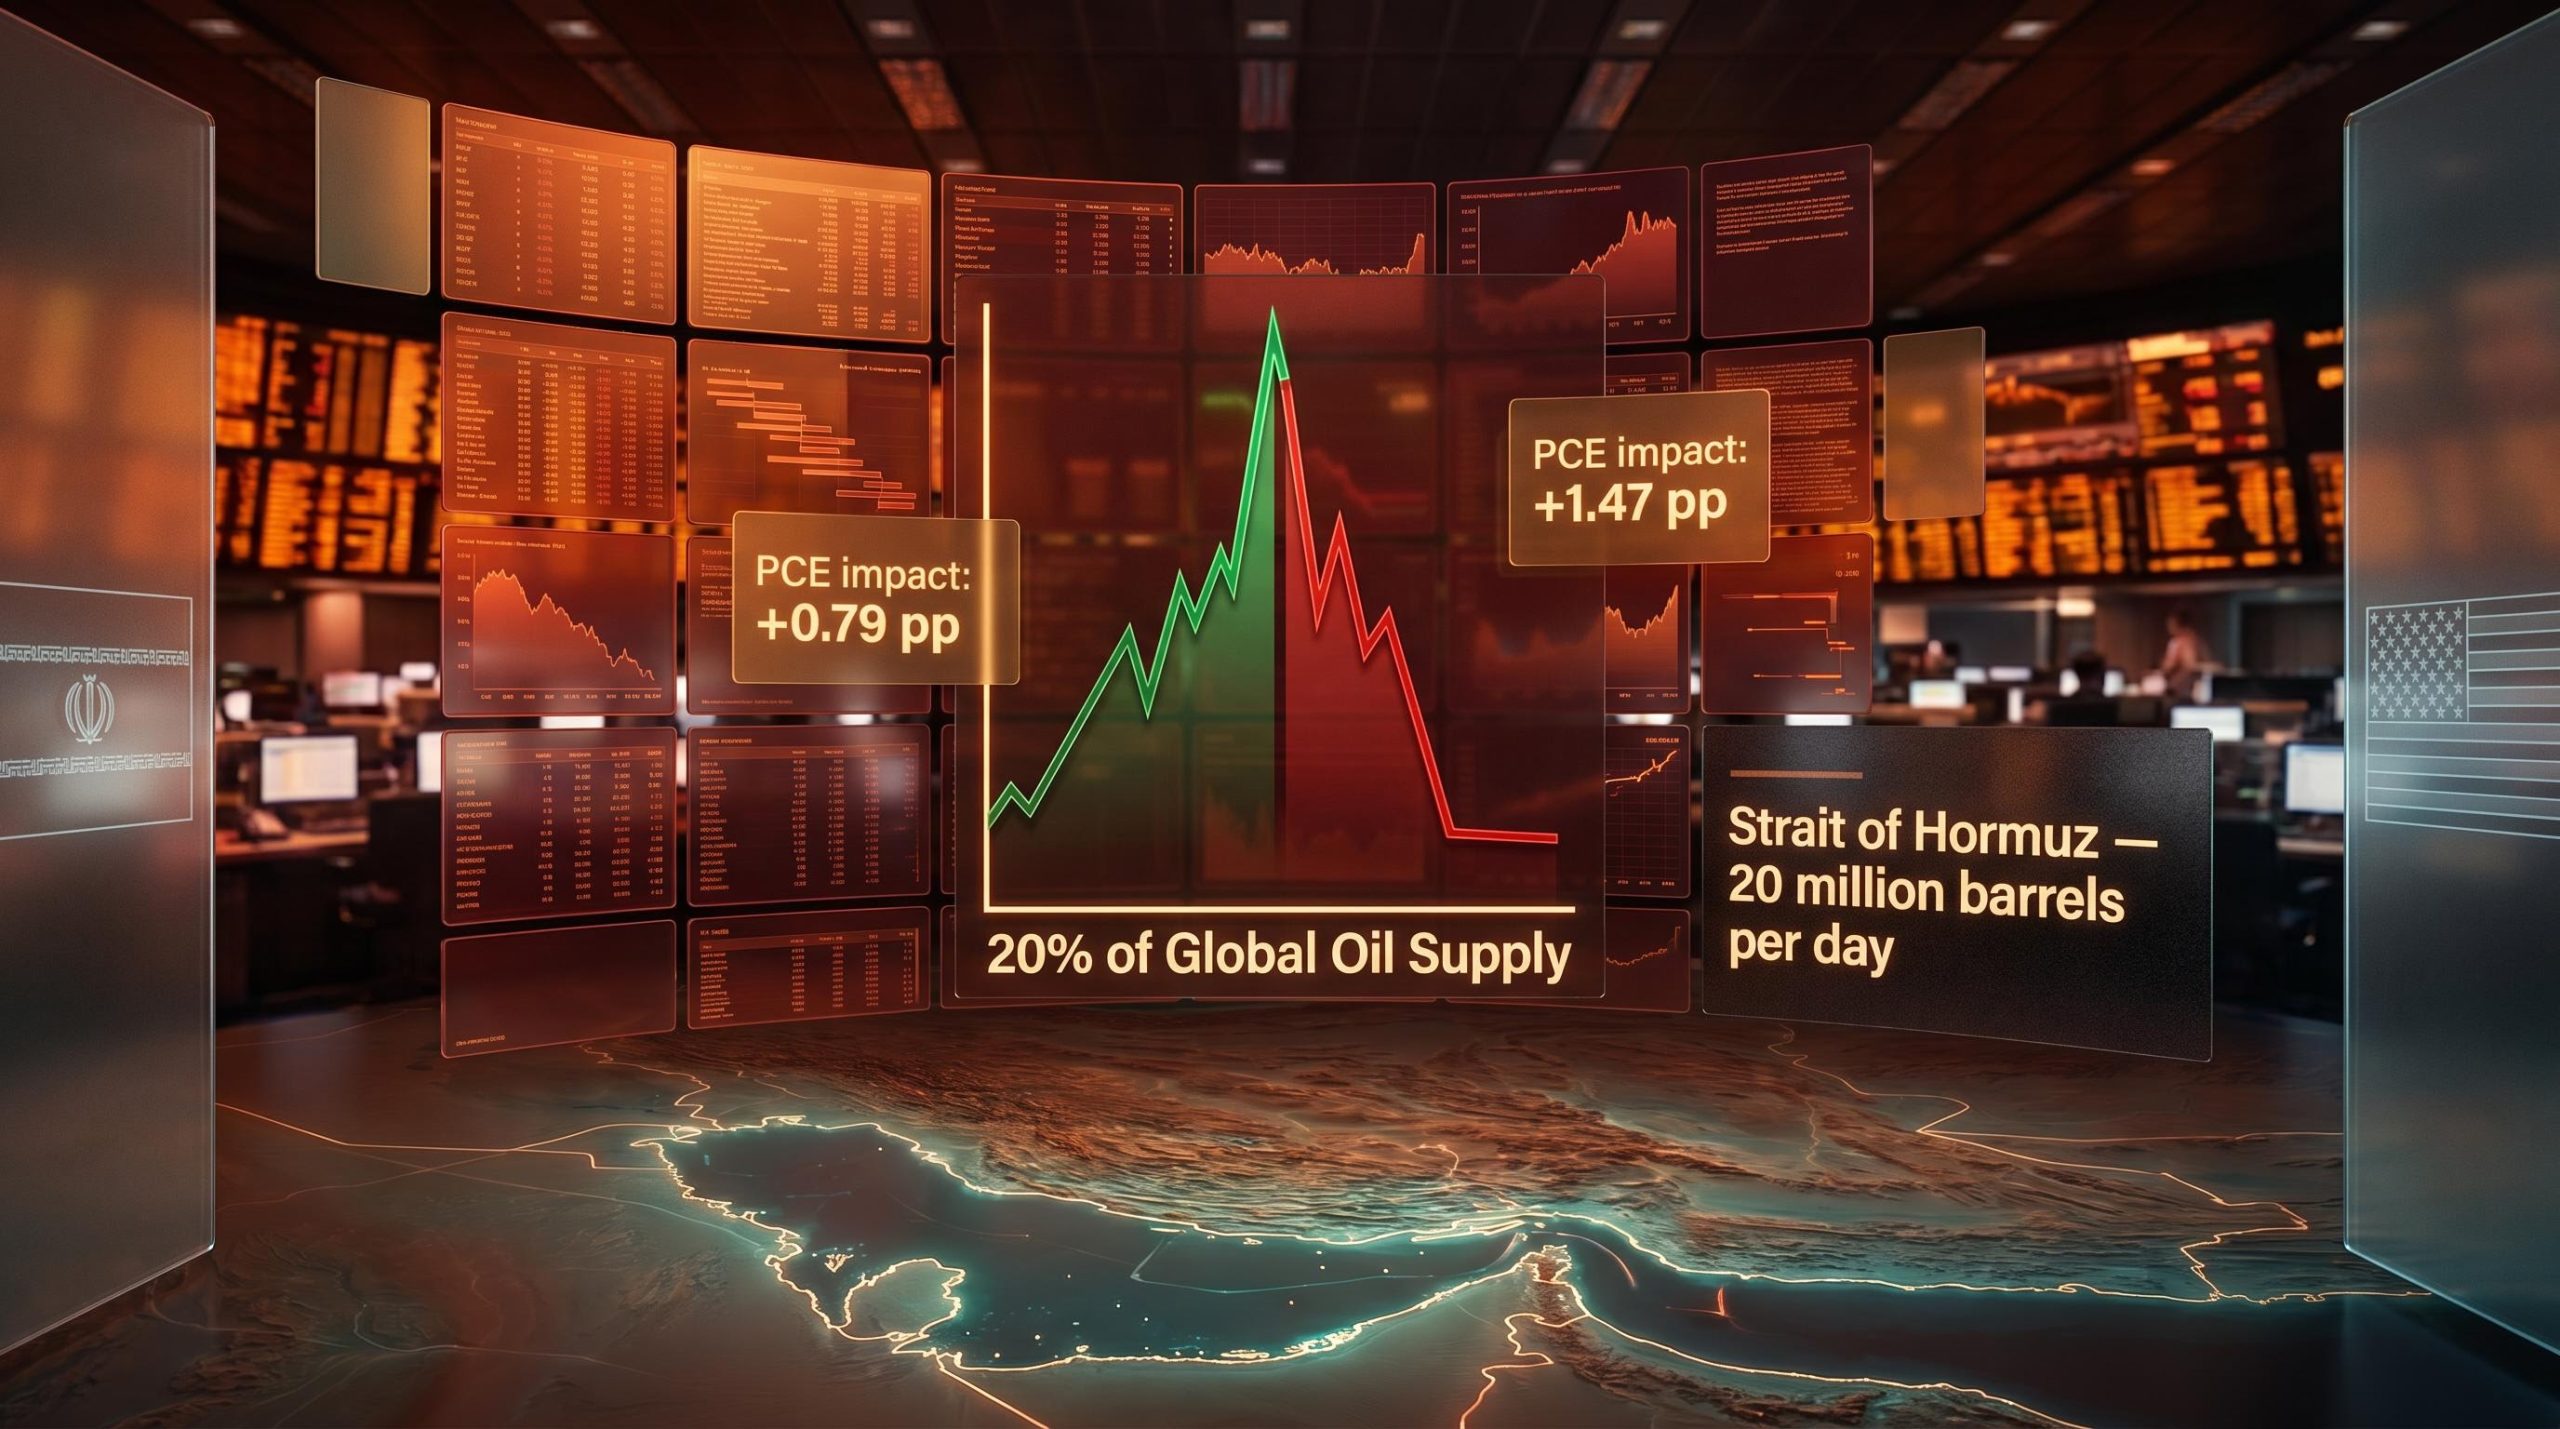
The Strait of Hormuz carries approximately 20% of global crude oil and liquefied natural gas (LNG), the equivalent of roughly 20 million barrels per day. That includes the majority of Qatar’s LNG exports. No alternative routing exists that can absorb that volume at comparable cost or speed.
When the U.S.-Israeli military campaign against Iran commenced in late February 2026, the strait was effectively closed to tanker traffic. Crude prices spiked. The disruption rippled outward within weeks, hitting not just energy markets but freight costs, food supply chains, and petrochemical feedstocks simultaneously.
The scale of the Hormuz supply disruption becomes clearest when measured in production equivalents: the EIA modelled Gulf shut-ins peaking near 10.8 million barrels per day in May 2026, roughly equivalent to removing 80% of total U.S. crude output from global seaborne flows.
Oxford Economics modelled the broader threshold: oil prices averaging approximately $140 per barrel sustained for two months would likely be sufficient to tip parts of the global economy into a mild recession, driven by higher fuel, food, and goods prices combined with tighter financial conditions.
By late June 2026, oil prices had returned near pre-conflict levels. That retracement is the data point markets are anchoring to. But the timeline between a price shock and its full pass-through into consumer prices runs months longer than the price spike itself. The disruption window created a multi-quarter inflation impulse that is still working through the system, even as the headline energy story fades from front pages.
Saudi Aramco’s CEO has warned that the supply normalisation timeline could extend into 2027, a projection that sits awkwardly against market pricing that treats the June spot retracement as evidence the disruption has largely cleared.
The mechanism is sequential, and each stage introduces its own delay. Energy costs first hit freight and logistics, raising the cost of moving all goods. Then the shock reaches food and agricultural inputs, where fertiliser costs, irrigation, and cold-chain logistics each absorb the price increase at different points in the production cycle. Business services and manufacturing come next. By the time the effect reaches headline Consumer Price Index (CPI) or Personal Consumption Expenditures (PCE), the measure the Fed watches most closely, the original crude price spike may already be months in the past.
Dallas Fed research (Kilian, Plante, Richter, Zhou, April 2026) quantifies how this scales:
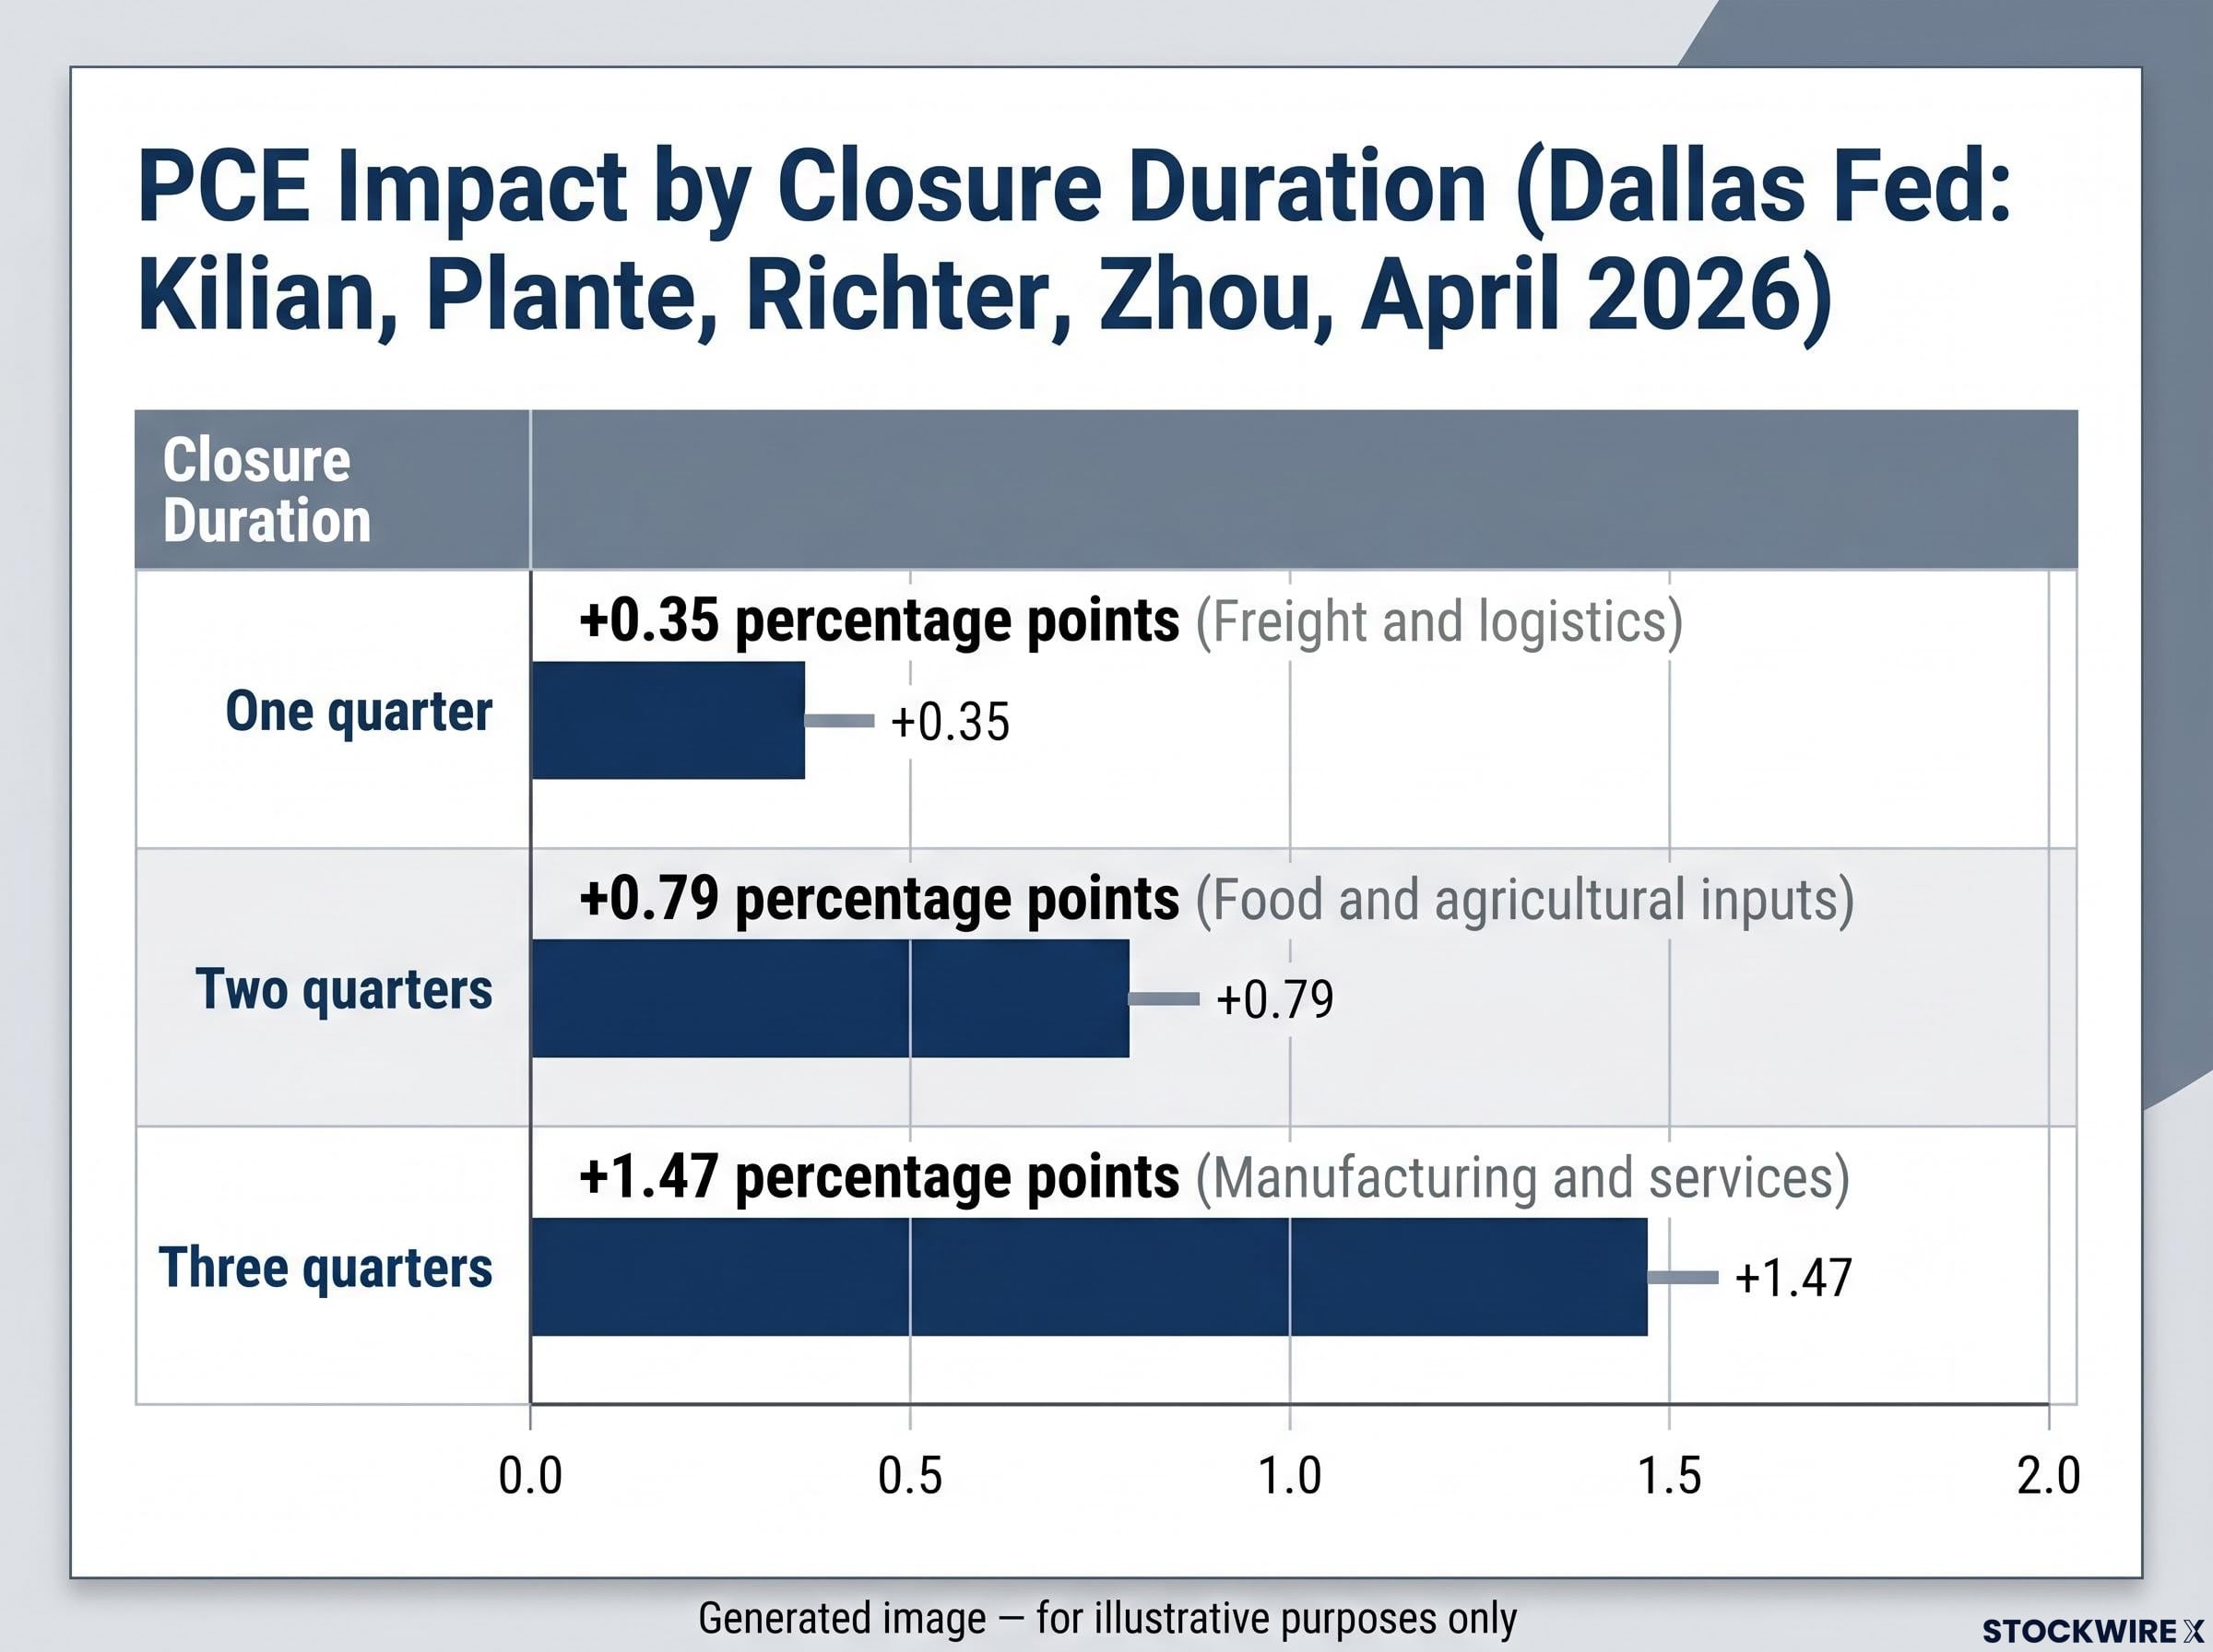
| Closure duration | PCE impact (Q4/Q4 2026) | Peak timing | Key transmission stage |
|---|---|---|---|
| One quarter | +0.35 percentage points | Months after reopening | Freight and logistics costs |
| Two quarters | +0.79 percentage points | Mid-2026 (+1.9-2.2 pp peak) | Food and agricultural inputs |
| Three quarters | +1.47 percentage points | Late 2026 and beyond | Manufacturing and services |
The critical finding: the positive effect on inflation persists for months after the strait reopens. Even a one-quarter disruption leaves a measurable inflation residue that outlasts the price normalisation itself.
Freight costs are the primary vehicle. When fuel prices rise, they embed themselves into the cost of moving every physical good across every supply chain, not just energy products. That is how an oil shock becomes a non-energy inflation problem.
Food inflation compounds separately because fertiliser, irrigation, and cold-chain logistics each absorb the energy shock at different points in the production cycle. The downstream categories most affected include:
These secondary channels are why the Fed cannot declare victory when oil retraces. The shock is not contained within the energy component of price indices; it has already dispersed across categories that move more slowly and correct more grudgingly.
Dallas Fed research on energy shock transmission finds that core inflation rises more modestly but more persistently than headline energy inflation after a supply disruption, meaning the correction in crude prices that markets are reading as a resolution signal precedes the inflationary clearing event by several quarters.
At the start of 2026, the consensus was straightforward: the Federal Reserve would begin lowering borrowing costs. Six months later, that expectation has reversed.
Markets spent early 2026 pricing in rate cuts. By mid-year, the Hormuz-linked inflation shock had pushed expectations toward potential rate hikes before year-end, one of the sharpest repricings of the monetary policy outlook in recent memory.
The Fed has held policy rates steady in its recent meetings, citing inflation that remains above target and noting that higher oil prices have made the path back to 2% more uncertain. This is not a pause by choice; it is a pause forced by an inflation picture that the Hormuz disruption made materially harder to read.
The bond market has responded accordingly. U.S. government bond yields have risen, consistent with repricing toward stickier inflation and tighter future financial conditions. That repricing flows directly into rate-sensitive assets across every risk category.
On a related institutional note, a Supreme Court decision on 29 June 2026 prevented President Trump from removing Federal Reserve Governor Lisa Cook from her position, offering a degree of reassurance that the Fed’s institutional independence would hold at a time when monetary policy credibility faces heightened scrutiny.
A Fed that was expected to cut rates and is now potentially hiking inside twelve months represents a material shift in the discount rate environment. That shift flows directly into equity valuations, mortgage costs, and corporate financing conditions. If you positioned for a rate-cut environment entering 2026, the return landscape you are operating in is meaningfully different from the one you planned for.
Geopolitical inflation risk, defined precisely, is the persistent, lagging inflation pressure that arises when geopolitical events disrupt core commodity supply chains, even after spot prices normalise. It is not a one-time shock to be priced and forgotten. It is a multi-quarter regime with compounding second-order effects, and the Hormuz crisis is its clearest recent example.
The Hormuz shock is layering onto a structural inflation regime that 150 years of price cycle data suggests has decades to run: all 13 disinflationary forces that suppressed prices across the previous four decades have now reversed simultaneously, making a quick return to 2% historically anomalous rather than the base case.
Markets exhibit a recurring pattern around geopolitical supply disruptions: risk tends to be over-priced during the acute crisis phase, when headlines dominate sentiment and volatility spikes, and under-priced during the ambiguous recovery phase, when spot prices stabilise and narrative attention shifts elsewhere.
The current post-Hormuz environment fits that pattern precisely. Oil prices near pre-conflict levels create a surface impression of resolution while the inflation pass-through continues running, the Fed’s policy path remains constrained, and the legal status of strait access is still being negotiated in Doha.
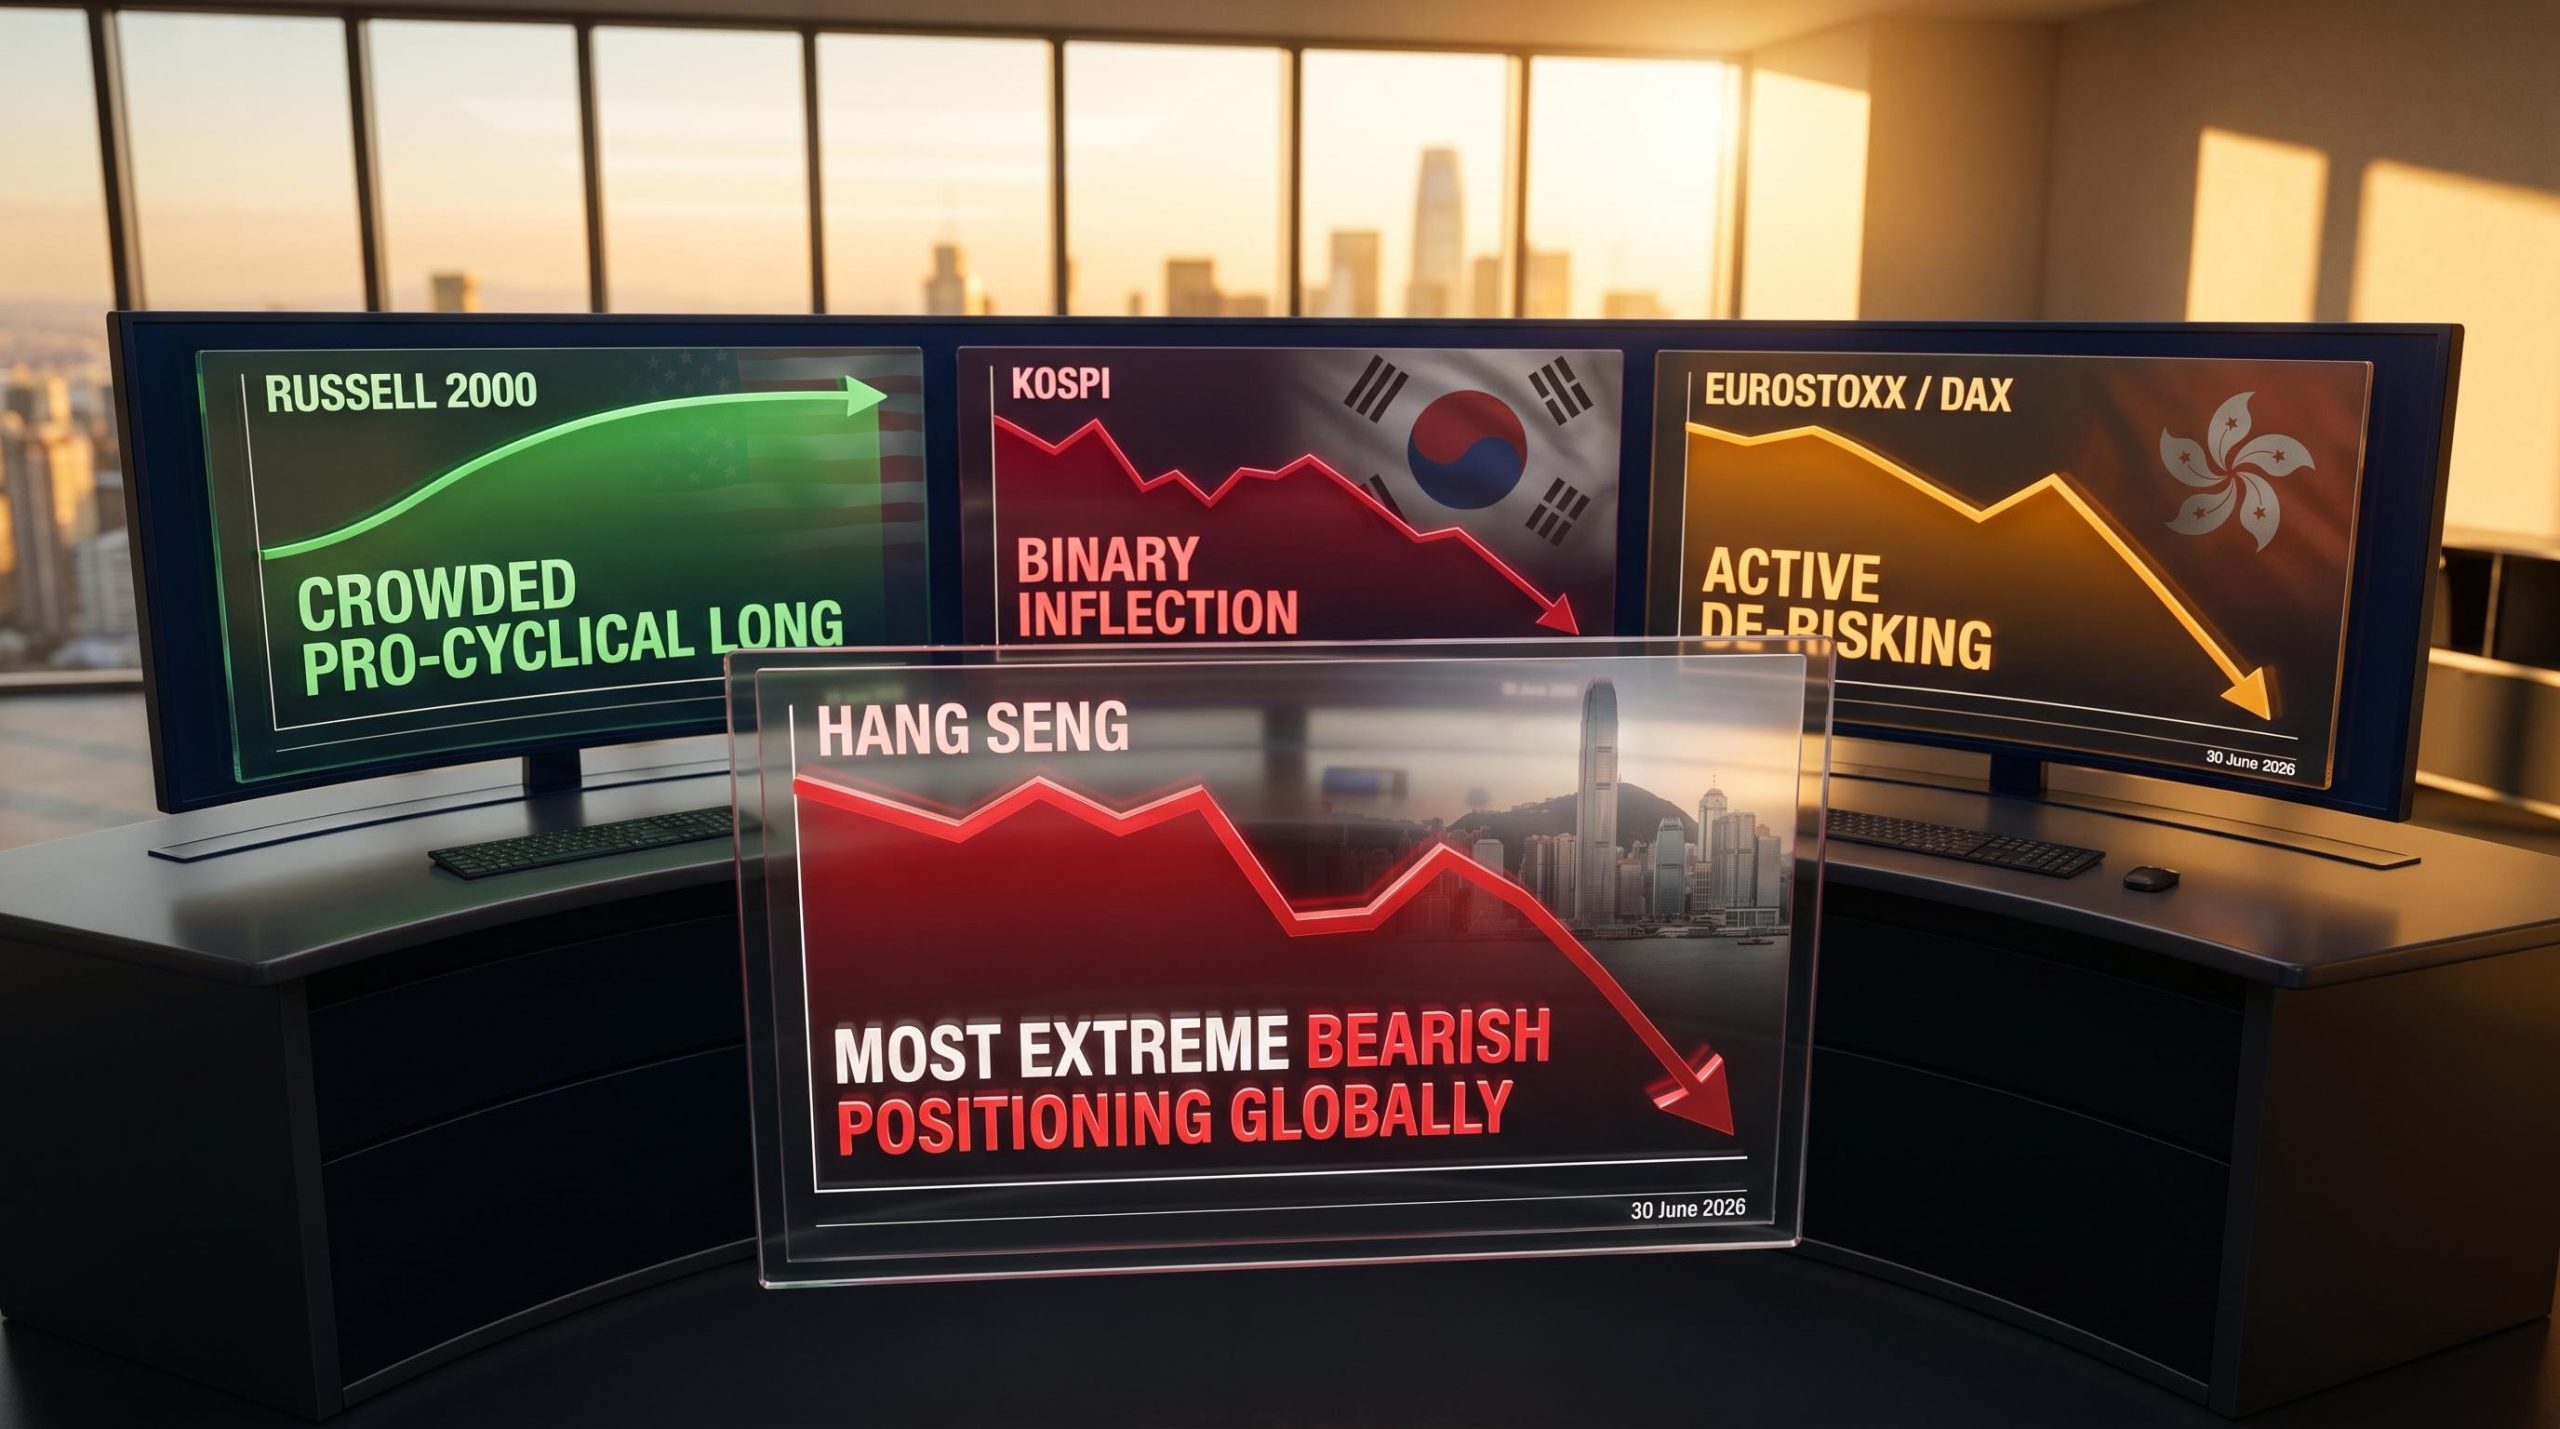
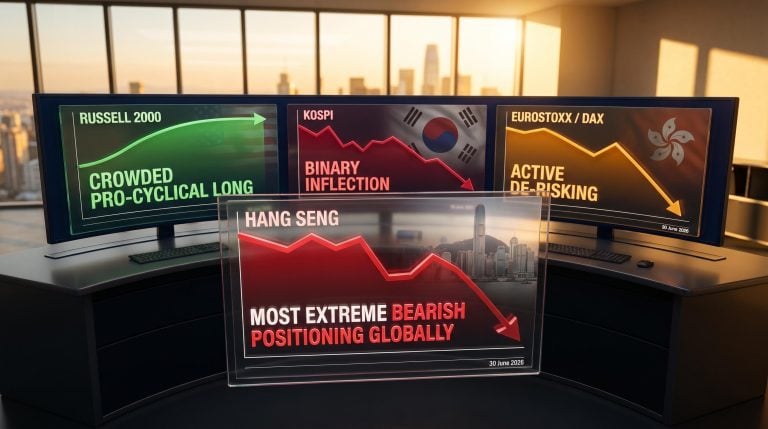
The sectors carrying the greatest ongoing exposure include:
For U.S. investors with international holdings, the most exposed geographies are:
The second-round policy response, tighter monetary conditions imposed by central banks responding to sustained inflation, can do as much macro damage as the initial price shock. That is the underappreciated transmission risk. If you return your portfolio to its pre-crisis positioning because spot prices have normalised, you are implicitly betting that both the pass-through and the policy response have fully cleared. The evidence here suggests they have not.
The analytical framework in this article converts into three forward-looking variables worth monitoring before concluding that the Hormuz risk has resolved:
Spot crude normalising is one data point. It is not a composite signal that the risk has cleared. Tracking these three variables positions you ahead of a market consensus that is currently treating price retracement as the primary indicator of resolution, while the inflation machinery, the policy constraints, and the legal ambiguities all remain active.
Investors who want to systematically pre-position ahead of diplomatic events rather than react after them will find our comprehensive walkthrough of policy-driven market risk mapping useful; it explains why the stabilisation-versus-resolution distinction carries direct predictive weight for which markets capture relief-rally gains and which absorb residual losses.
This article is for informational purposes only and should not be considered financial advice. Investors should conduct their own research and consult with financial professionals before making investment decisions. Forward-looking statements regarding inflation trajectories and Federal Reserve policy are subject to change based on evolving market conditions, geopolitical developments, and economic data.
Geopolitical inflation risk is the multi-quarter inflation pressure that arises when geopolitical events disrupt core commodity supply chains, even after spot prices return to normal. The shock disperses sequentially through freight, food, petrochemicals, and manufacturing, meaning headline energy prices can normalise while the inflationary pass-through continues running for several additional quarters.
Dallas Fed research (Kilian, Plante, Richter, Zhou, April 2026) models PCE impacts of 0.35 percentage points for a one-quarter closure, 0.79 percentage points for two quarters, and up to 1.47 percentage points for a three-quarter closure, with the inflation effect persisting for months after the strait reopens.
The Hormuz-linked oil price spike pushed inflation further above the Fed's 2% target, forcing the central bank to hold rates steady and shift market expectations from anticipated rate cuts at the start of 2026 to potential rate hikes by year-end, one of the sharpest monetary policy repricings in recent memory.
Airlines, shipping and logistics, agriculture, petrochemicals, and energy-heavy manufacturing carry the greatest ongoing exposure, along with international holdings concentrated in India, Europe, and Japan, all of which are heavily import-dependent on oil and LNG flowing through the strait.
The three most relevant signals are: the outcome of Doha technical talks and whether higher-level negotiations are scheduled; non-energy PCE and CPI readings across Q3 and Q4 2026, which the Dallas Fed model identifies as the primary pass-through window; and Fed forward guidance at upcoming meetings, where the language around inflation persistence matters as much as the rate decision itself.