JPMorgan Says Cyber Risk Leaves Bank Valuations Dangerously Exposed
7 mins ago
The S&P 500 closed the first half of 2026 up more than 7% for the year. By that measure alone, the bull market is intact. But the final week of H1 told a sharply different story: the Nasdaq fell 4.6%, tech stocks extended their losing run to five straight sessions, and the Dow Jones Industrial Average quietly outperformed both indices. That divergence is not a contradiction. It is the market’s live preview of what major Wall Street firms are now calling the defining dynamic of the second half.
On the final trading day of H1, RBC Capital Markets, JPMorgan, Morgan Stanley, and Evercore ISI each issued constructive but pointedly nuanced outlooks for H2 2026. The common thread across all four is not a debate about direction; each firm expects equities to move higher. The debate is about where leadership comes from. The era of a handful of mega-cap tech names carrying the entire index may be giving way to something broader, and that shift has implications for how your portfolio should be weighted heading into July.
Here is what the four firm outlooks actually say, which sectors they favour, and what the near-term risks mean for how you should be thinking about your positioning today. This is a decision-support read, not a general market summary.
The numbers from the week ending 29 June 2026 are worth sitting with before you read the outlook notes.
| Index | 29 June close | Daily change | Weekly change | YTD (H1 2026) |
|---|---|---|---|---|
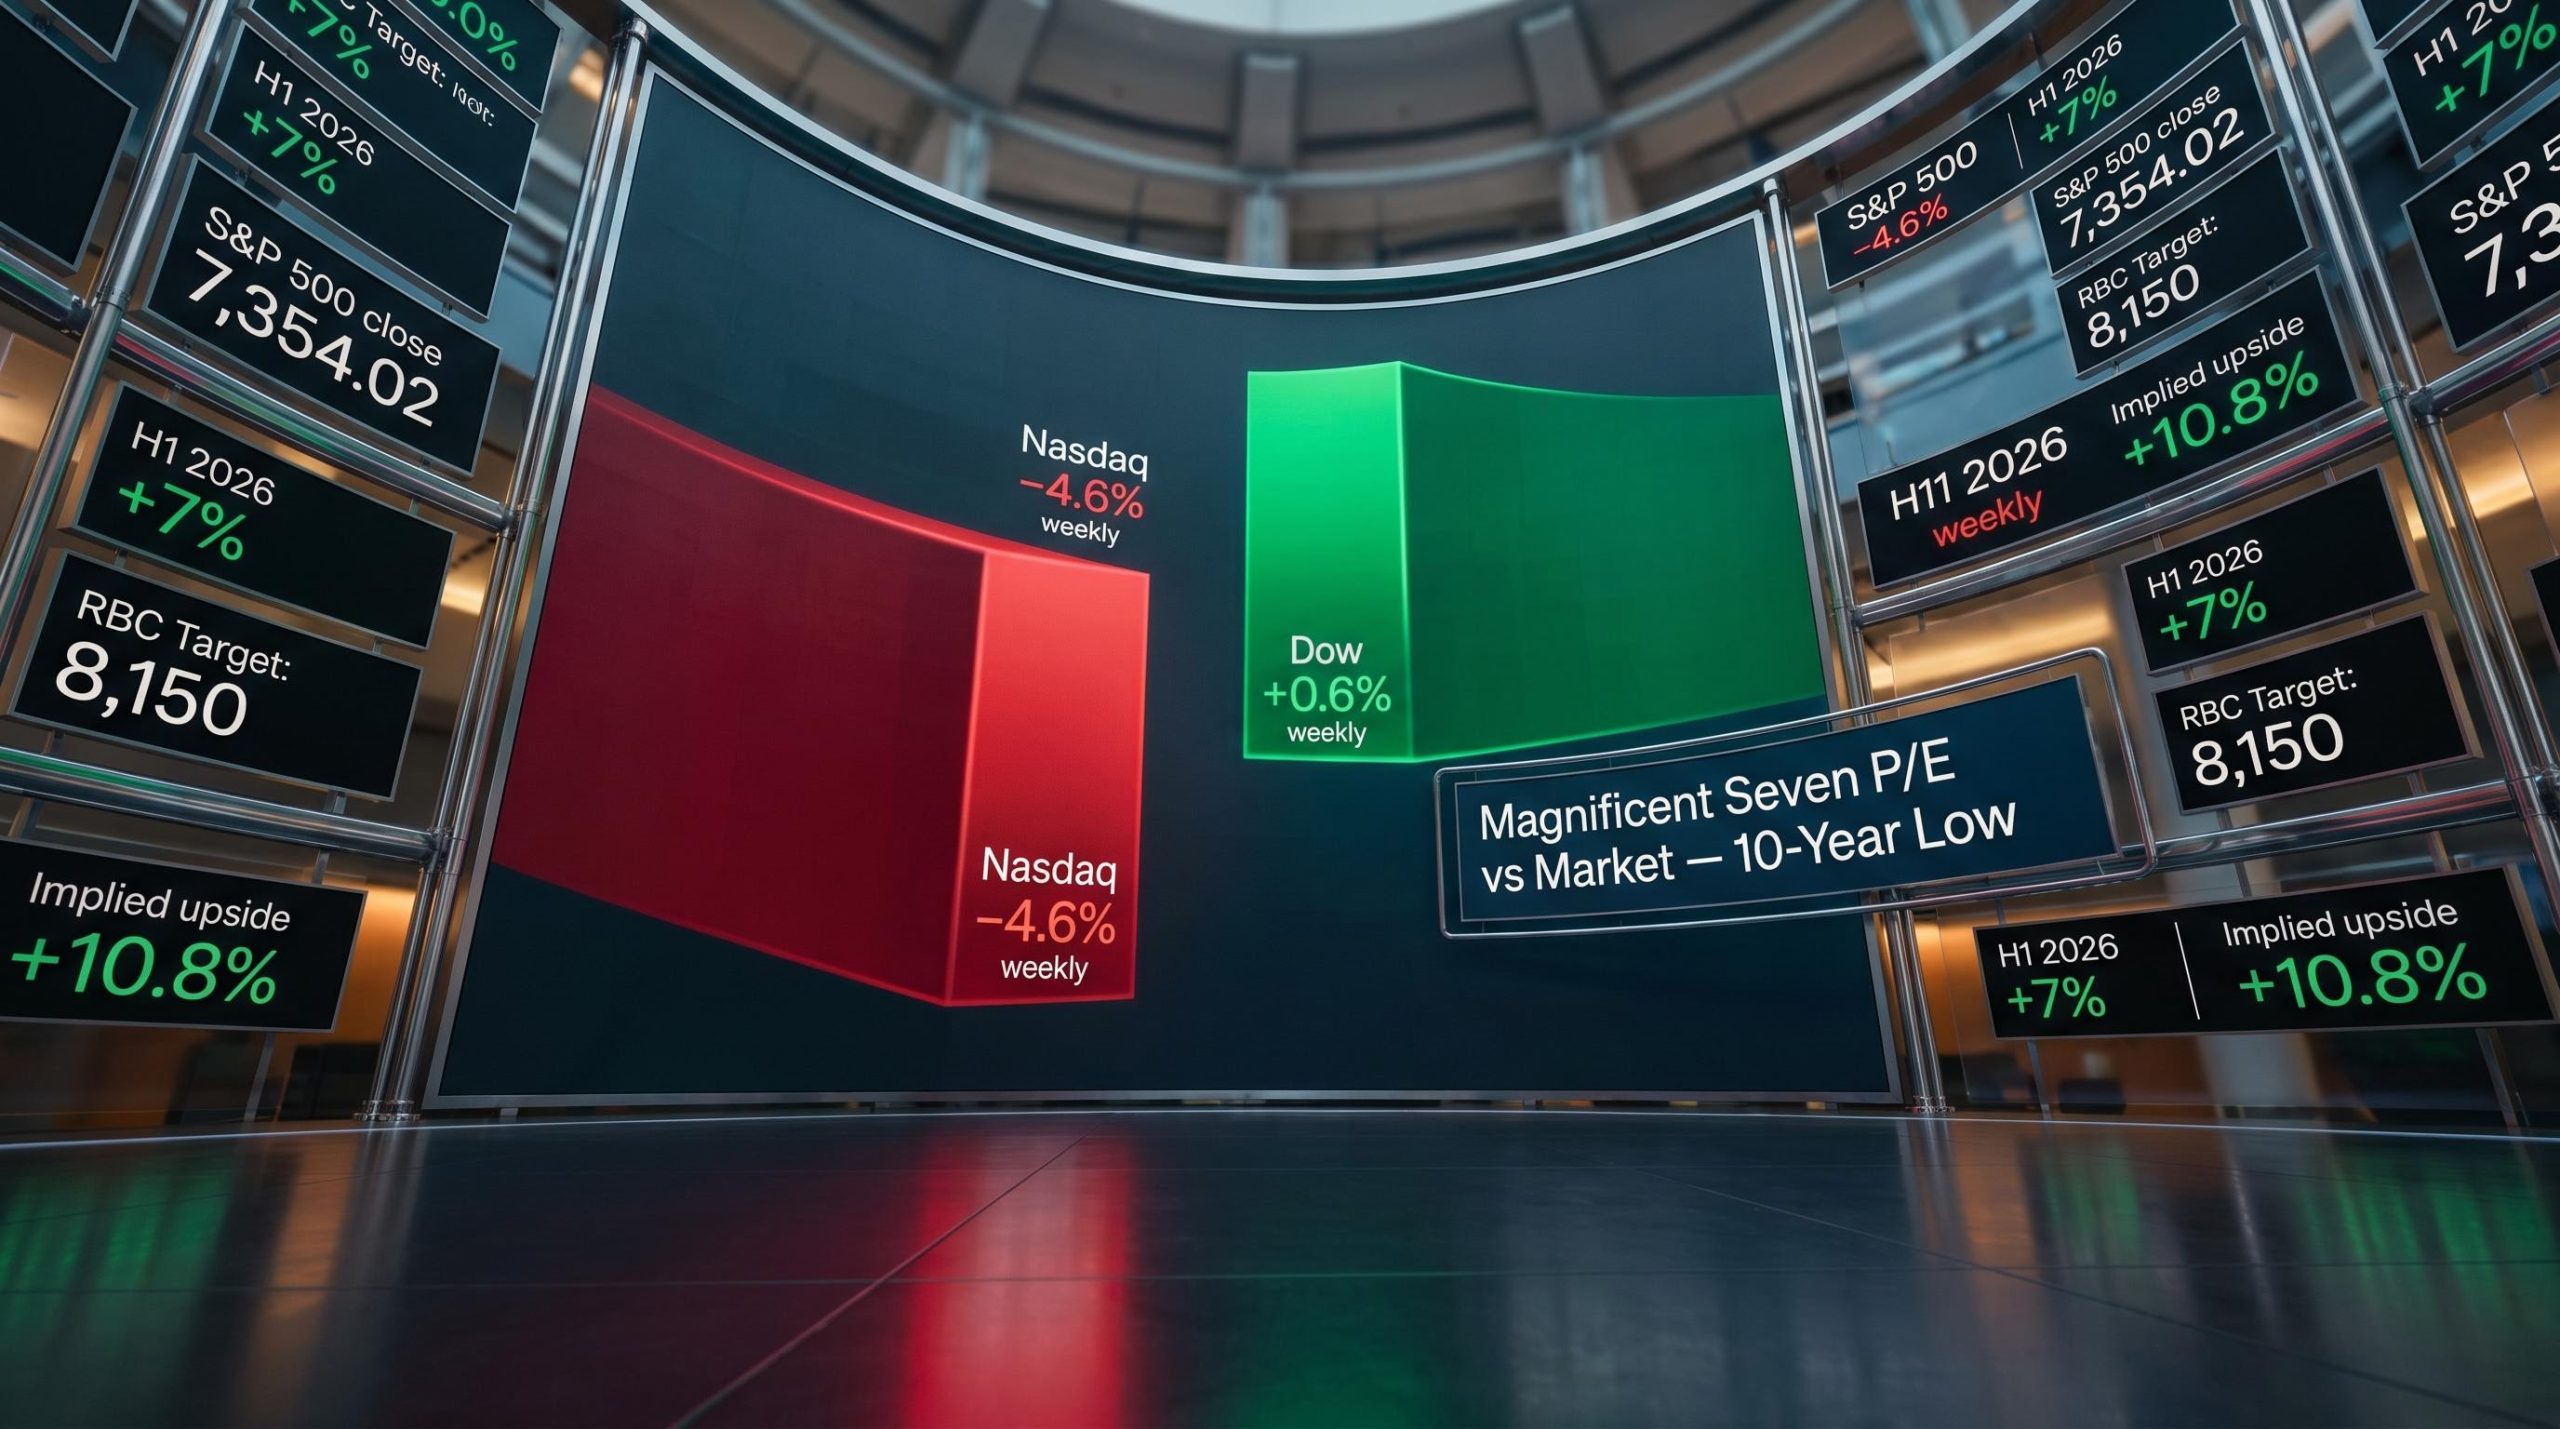
| S&P 500 | 7,354.02 | −0.05% | −2.0% (approx.) | +7%+ |
| Nasdaq Composite | 25,297.62 | −0.24% | −4.6% | — |
| Dow Jones | 51,876.11 | −44.51 pts (−0.09%) | +0.6% (approx.) | — |
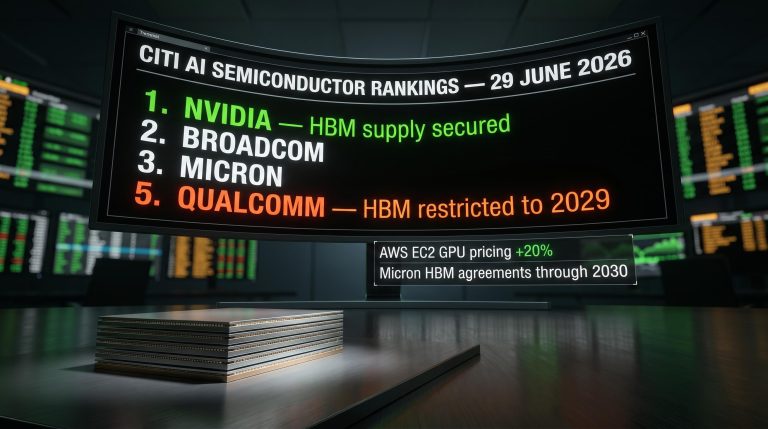
For the fifth day running on 29 June, tech stocks bore the brunt of the selling, with chipmakers under particular pressure as investors revised their expectations for how soon AI spending would translate into earnings.
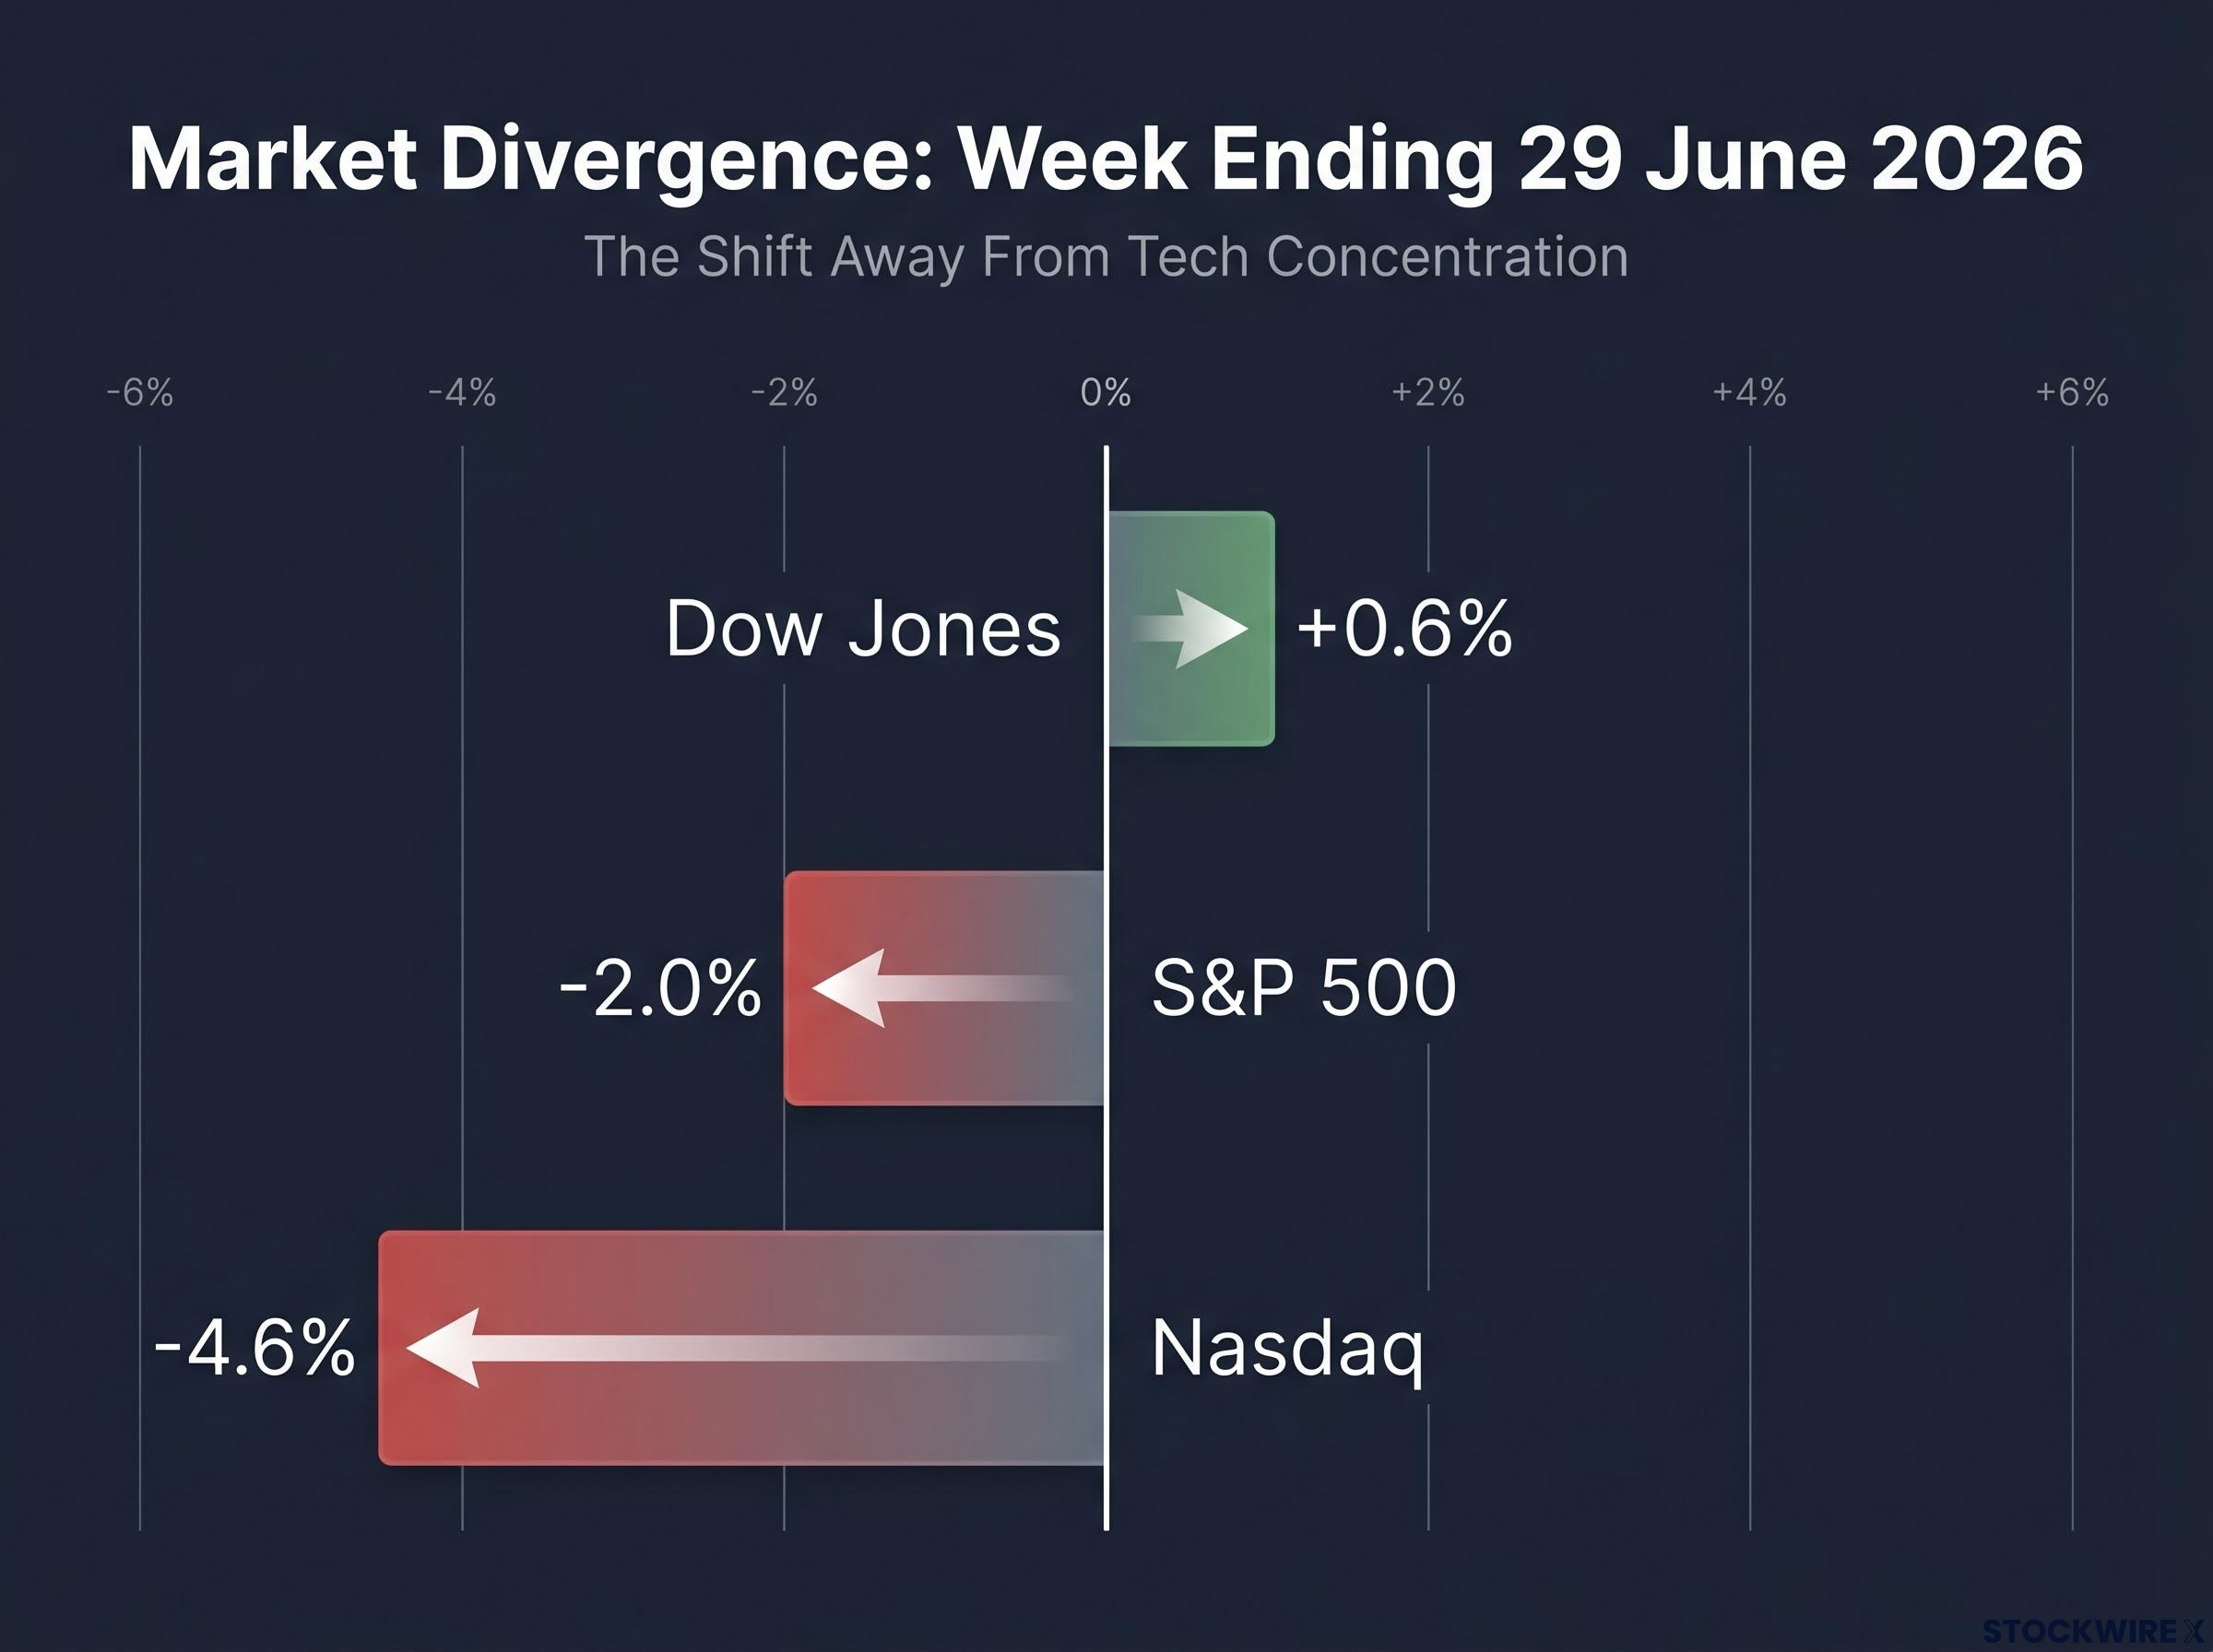
The Nasdaq’s 4.6% weekly decline, set against the Dow’s 0.6% weekly gain, is the kind of divergence that only appears when institutional capital is actively reallocating away from concentrated tech positions.
That five-day consecutive tech drawdown, combined with the Dow’s positive weekly return, tells you the sector rotation Wall Street strategists are forecasting is already happening in the market, not just being discussed in research notes.
Four independent firms arrived at the same structural conclusion via different analytical routes. That convergence is what makes the broadening thesis worth taking seriously rather than treating as a single house view.
The sector rotation capital flows visible in early June 2026 add a granular dimension to the broadening thesis: energy gained more than 22% year-to-date and industrials more than 16%, both against a broad market index return below 1%, making sector selection the dominant return driver well before the final week of H1.
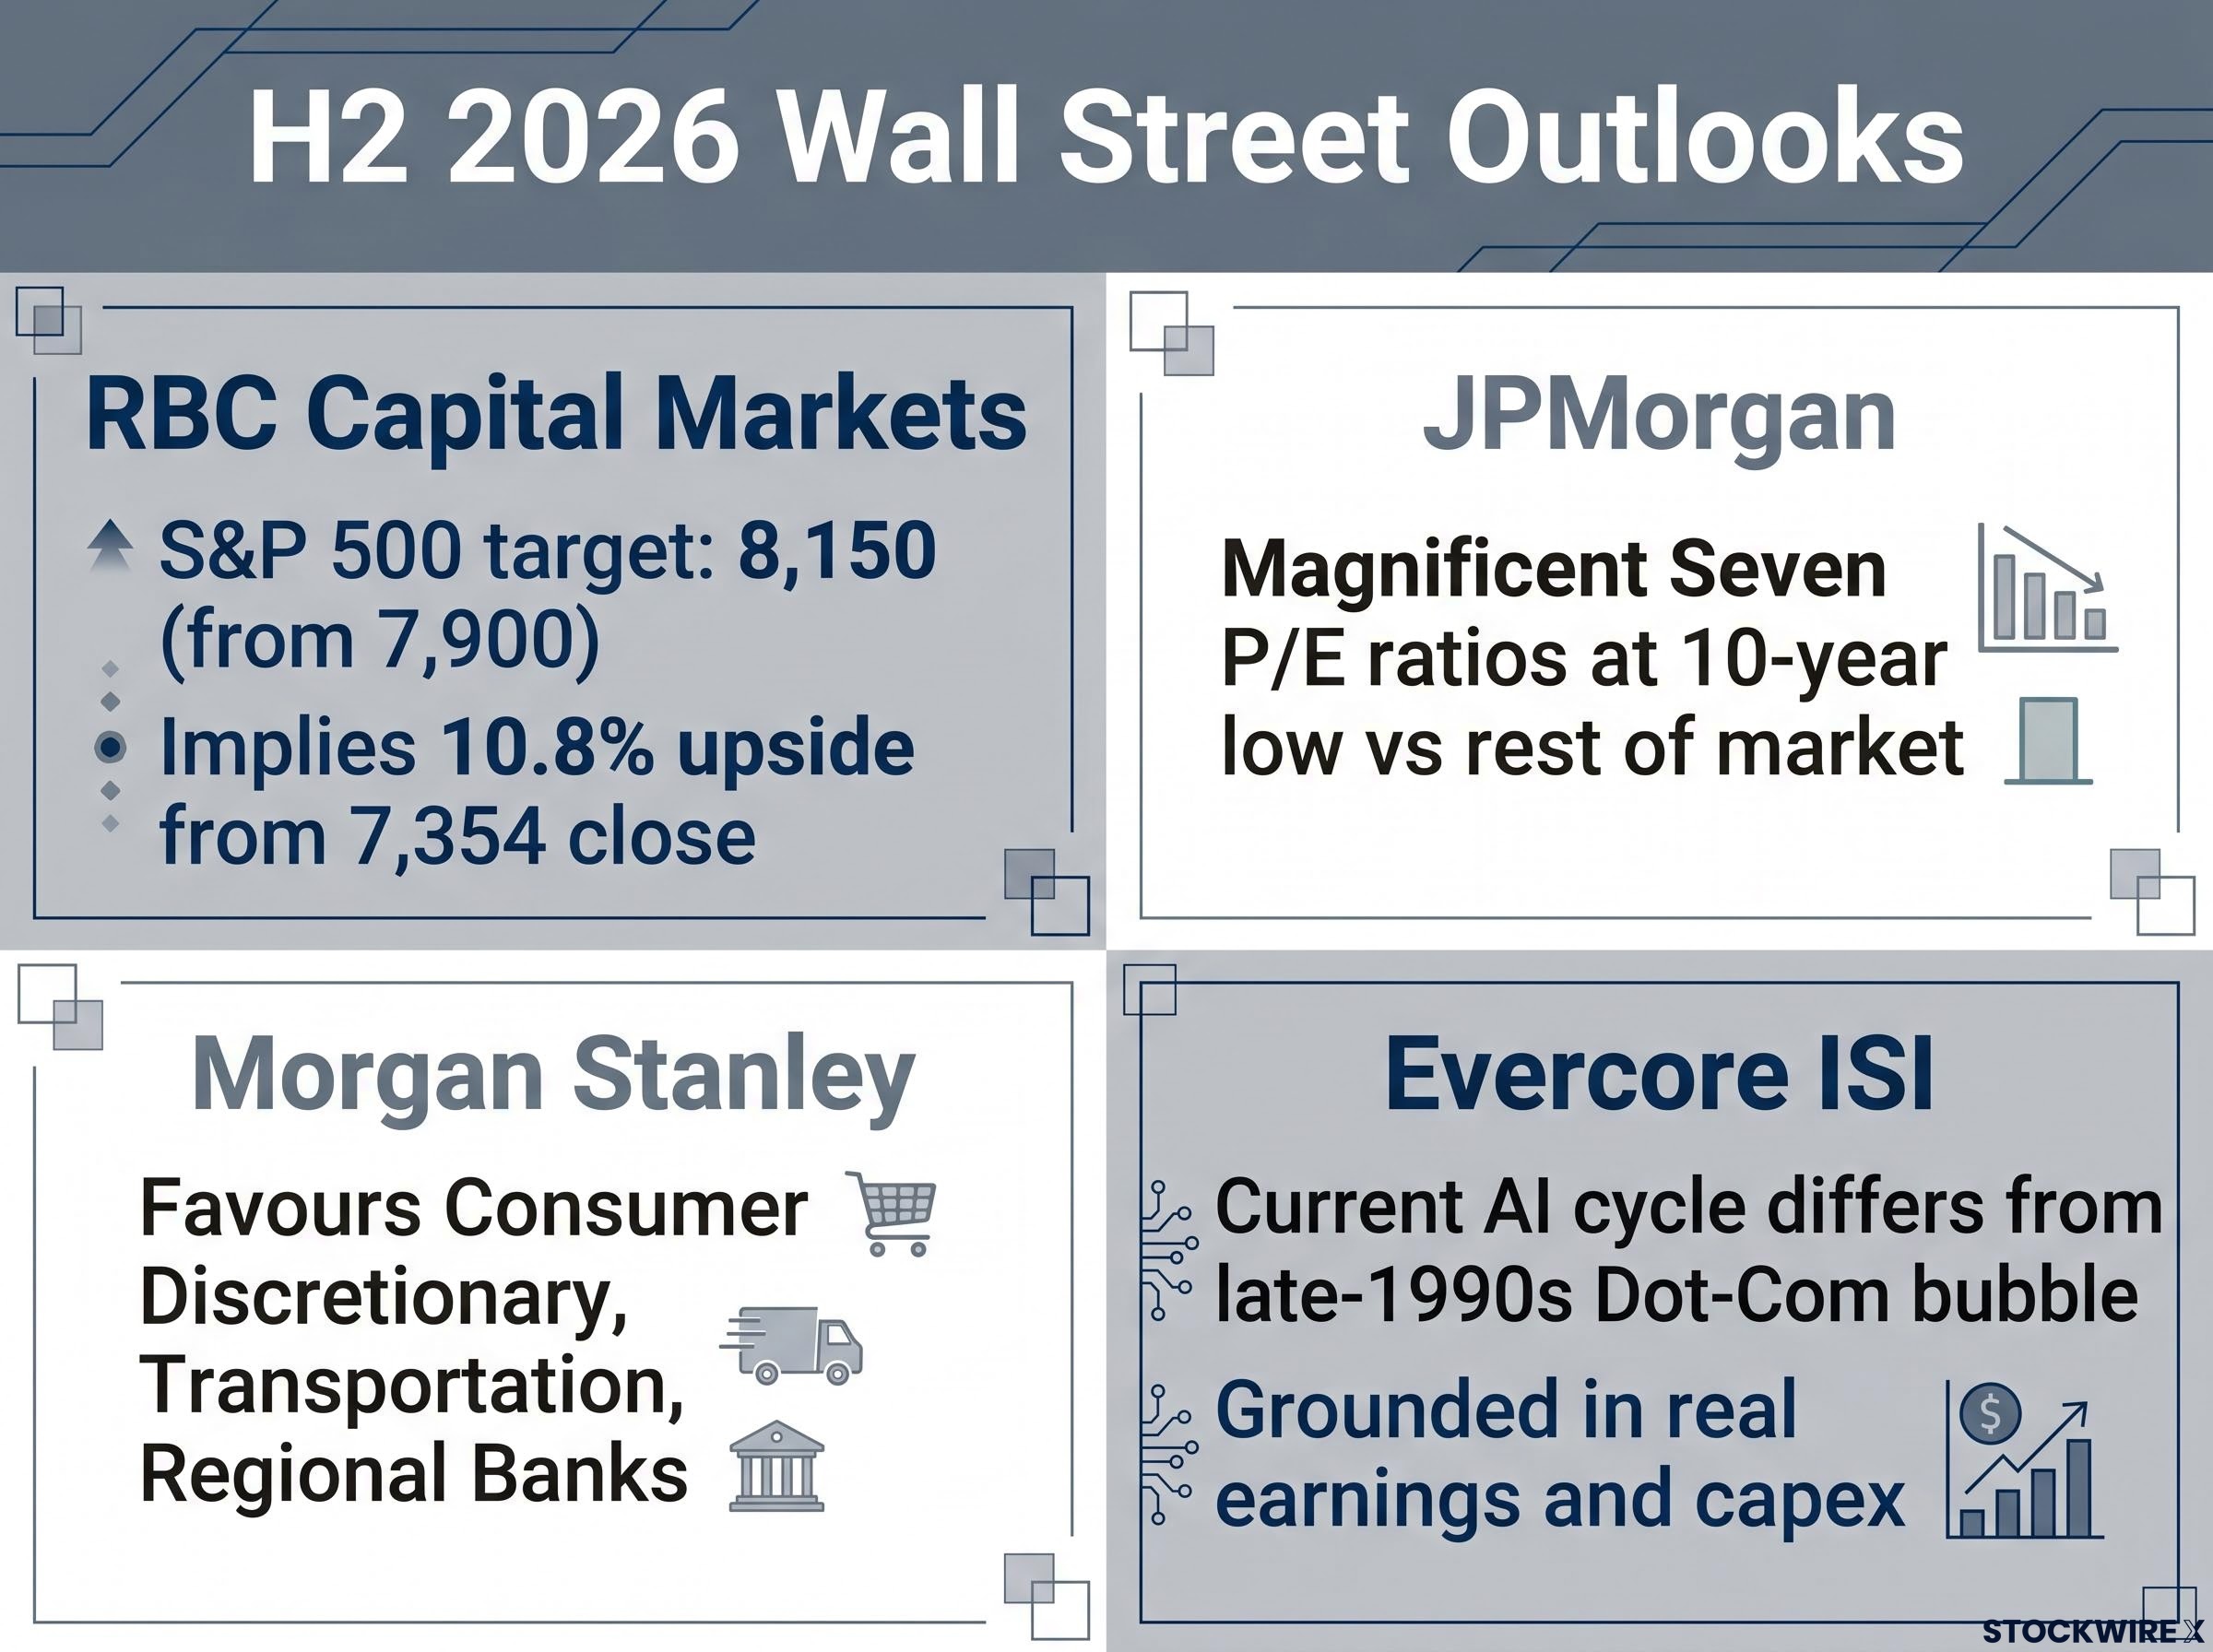
RBC’s 8,150 target implies roughly 10.8% upside from the 29 June close of 7,354. And JPMorgan’s valuation observation means that staying in quality tech names may not be the contrarian call it feels like after five consecutive down sessions; on a relative basis, those valuations sit at a ten-year low compared to the broader market.
Evercore ISI made the comparison explicit: according to the firm, policymakers do not regard the current wave of AI-driven equity appreciation as the kind of speculative mania that characterised the late 1990s. That matters because it shapes how aggressively the Fed would act to cool AI-related speculation. In the late 1990s, the perception that markets had become irrationally detached from fundamentals contributed to the Fed’s willingness to tighten, which helped accelerate the bust. Evercore’s read is that regulators see the current AI cycle as grounded in real earnings and capital expenditure, not speculative froth. If you have been tempted to draw a direct line from this AI run to the Dot-Com collapse, that distinction should at least complicate the comparison.
The broadening thesis is not a vague instruction to “diversify away from tech.” The sector calls are specific, and each has a named catalyst.
Morgan Stanley’s high-conviction names:
Broader cyclical beneficiaries across the four firms:
Market broadening tends to produce more durable advances than single-sector-led rallies. When gains are distributed across many sectors and names, the index is less vulnerable to a correction in any single area.
The fact that Morgan Stanley named Transportation and Regional Banks specifically, rather than defaulting to a generic “cyclicals” call, tells you this is not a passive rotation recommendation. Those sectors carry the combination of valuation, earnings sensitivity, and momentum characteristics the firm believes are needed to lead in H2.
Market breadth measures how widely gains are distributed across the stocks in an index. When breadth is narrow, a handful of names drive most of the index’s returns. When breadth is broad, the gains are spread across many sectors and individual names.
For much of Q2 2026, the S&P 500’s advance was powered by a concentrated group of mega-cap technology and AI stocks, the Magnificent Seven and their adjacent names. That is narrow breadth.
The Nasdaq’s 4.6% weekly decline is a live illustration of what happens when narrow leadership faces pressure: because so much of the index’s weight sits in a few names, a sector-level correction drags the entire benchmark disproportionately. The Dow, which carries broader sector exposure, gained 0.6% in the same week. Same market, different breadth profile, very different outcome.
| Characteristic | Narrow breadth | Broad breadth |
|---|---|---|
| Index return drivers | A few large-cap names | Many sectors and names |
| Concentration risk | High | Low |
| Sector participation | Limited to 1-2 sectors | Broad across cyclicals, defensives, growth |
| Volatility profile | Vulnerable to single-sector shocks | More resilient to sector rotation |
| Durability of advance | Historically less durable | Historically more durable |
Understanding this helps you see why a falling Nasdaq and a rising Dow in the same week is not a contradiction but the early fingerprint of the structural shift all four firms are now formally forecasting.
Small-cap rotation dynamics add a dimension to the broadening thesis that large-cap sector calls alone do not capture: the Russell 2000 returned approximately 12.21% year-to-date through May 2026, more than double the S&P 500’s 5.62%, supported by a valuation discount of roughly 18x versus 22x earnings and a surge in institutional fund flows from approximately 8% of equity inflows in 2025 to approximately 25% in 2026.
Morgan Stanley’s base case is that the Federal Reserve keeps rates unchanged through 2026, provided three conditions hold: oil prices continue to ease, the inflationary effect of tariffs does not reignite, and services and housing inflation stays under control.
The Federal Reserve’s June 2026 rate decision confirmed the FOMC’s choice to hold the federal funds rate steady, citing elevated inflation alongside a resilient labour market, providing the explicit policy anchor that underpins Morgan Stanley’s rate-hold base case for the remainder of the year.
If the Fed holds, lower real interest rates support valuations across a wider set of assets, not just technology. Long-duration assets, those whose value depends heavily on future earnings rather than near-term cash flows, become more attractive across multiple sectors. That is the mechanism through which a rate hold amplifies the broadening effect: the valuation tailwind extends beyond tech and AI to cyclicals, financials, and industrials that had been priced for a tighter policy environment.
The constructive thesis has a specific vulnerability, and it is not earnings disappointments or a surprise Fed hike.
Morgan Stanley flagged shrinking liquidity, driven by the unwinding of reserve management programmes and a reduction in Treasury buyback activity, as the principal short-term threat to broad equity indices and crowded momentum positions. This is a market-plumbing risk: central bank and government liquidity operations can drain market liquidity even when policy rates stay unchanged, creating sudden volatility in crowded, momentum-driven positions.
CTA selling mechanics operate on rule-driven algorithms with no discretionary override, meaning threshold breaches across multiple funds can compound selling pressure faster than any fundamental-driven event; Goldman Sachs identified $93 billion in net long equity exposure among trend-following funds in early June 2026, with a one-month sustained decline capable of triggering more than $100 billion in mechanical selling.
This kind of pullback can arrive without a clear fundamental headline, which is precisely what makes it dangerous for investors waiting for an obvious signal to de-risk.
The constructive rate-hold base case itself is conditional. Morgan Stanley’s three requirements:
If services and housing inflation re-accelerates, the base case shifts from a rate hold toward a hiking scenario. That would directly challenge the equity thesis underpinning every broadening call in this article.
The fact that the identified risk is liquidity mechanics rather than earnings or Fed policy means standard fundamental screening will not alert you to it in advance. You need to track treasury market plumbing and reserve balances as leading indicators, not just corporate earnings calendars.
The four-firm consensus points toward recalibration, not a dramatic overhaul. Here are the five positioning steps the research supports, each anchored to a specific firm view:
RBC’s 8,150 target and the implied 10.8% upside from the 29 June close are directional roadmaps, not guarantees. They should inform your positioning and risk calibration, not dictate binary in-or-out decisions.
For investors who want a step-by-step execution framework rather than directional guidance, our dedicated guide to portfolio rebalancing after equity gains covers how to identify concentration drift, when to trigger a rebalance using a 5% threshold rule, and how to sequence the execution tax-efficiently across account types.
Services and housing inflation is the primary macro variable. A re-acceleration would shift Morgan Stanley’s base-case rate hold toward a hiking scenario, directly undermining the constructive equity thesis.
Liquidity operations data, specifically reserve management and Treasury buyback activity, is the market-plumbing variable. Changes here can trigger index-level volatility independent of corporate fundamentals or Fed rate decisions. This is the variable most investors are not tracking.
The convergence across RBC, JPMorgan, Morgan Stanley, and Evercore ISI on the broadening thesis is genuine, and four independent firms arriving at the same structural view through different analytical routes carries real informational weight. But consensus views are frequently revised, and price targets reflect probability-weighted scenarios rather than commitments.
The core positioning takeaway holds regardless of whether the S&P 500 reaches 8,150 precisely: the H2 setup favours diversified, quality-oriented equity exposure with reduced concentration in crowded tech names and selective rotation toward cyclicals. That framing remains sound even if the specific targets shift.
The constructive equity view for H2 2026 is intact, the broadening thesis is supported by multiple independent firm analyses, but it is conditional on the macro and liquidity variables named throughout this article.
The two variables most likely to create volatility windows, services and housing inflation on the macro side and liquidity operations on the plumbing side, are also the variables where patient, well-positioned investors can make meaningful adjustments rather than react under pressure. The value of a four-firm consensus is not that it is always right, but that it tells you where the weight of institutional conviction currently sits, which is itself useful information for calibrating your own risk tolerance.
This article is for informational purposes only and should not be considered financial advice. Investors should conduct their own research and consult with financial professionals before making investment decisions. Past performance does not guarantee future results. Financial projections are subject to market conditions and various risk factors. This analysis reflects market commentary as of late June 2026 and does not constitute personalised financial advice.
RBC Capital Markets, JPMorgan, Morgan Stanley, and Evercore ISI all expect equities to move higher in H2 2026, with RBC setting an S&P 500 price target of 8,150, implying roughly 10.8% upside from the 29 June close of 7,354. The shared view is that gains will be driven by broader sector participation rather than continued mega-cap tech dominance.
Market broadening means index gains are distributed across many sectors and stocks rather than concentrated in a handful of mega-cap names; it historically produces more durable advances and reduces the risk that a correction in any single sector drags the entire index lower.
Morgan Stanley named Consumer Discretionary, Transportation, and Regional Banks as high-conviction calls, while JPMorgan favoured cyclical trades broadly; Industrials, Materials, Financials, and Energy were cited across multiple firms as beneficiaries of the rotation away from concentrated tech positions.
The Nasdaq dropped 4.6% over the week ending 29 June while the Dow gained roughly 0.6%, reflecting institutional capital actively rotating out of concentrated tech and AI positions into sectors with broader economic exposure, exactly the sector rotation Wall Street strategists had been forecasting.
Morgan Stanley identified two principal risks: a re-acceleration of services and housing inflation that would push the Fed toward rate hikes rather than a hold, and shrinking market liquidity driven by the unwinding of reserve management programmes and reduced Treasury buyback activity, which can trigger sharp selloffs in crowded momentum positions independent of any fundamental news.