Finance-educated investors tend to trust capital expenditure disclosures as a direct window into how much companies are actually spending on AI infrastructure. That assumption is increasingly unreliable, and the gap between reported figures and economic reality is widening with each quarter of hyperscaler spending.
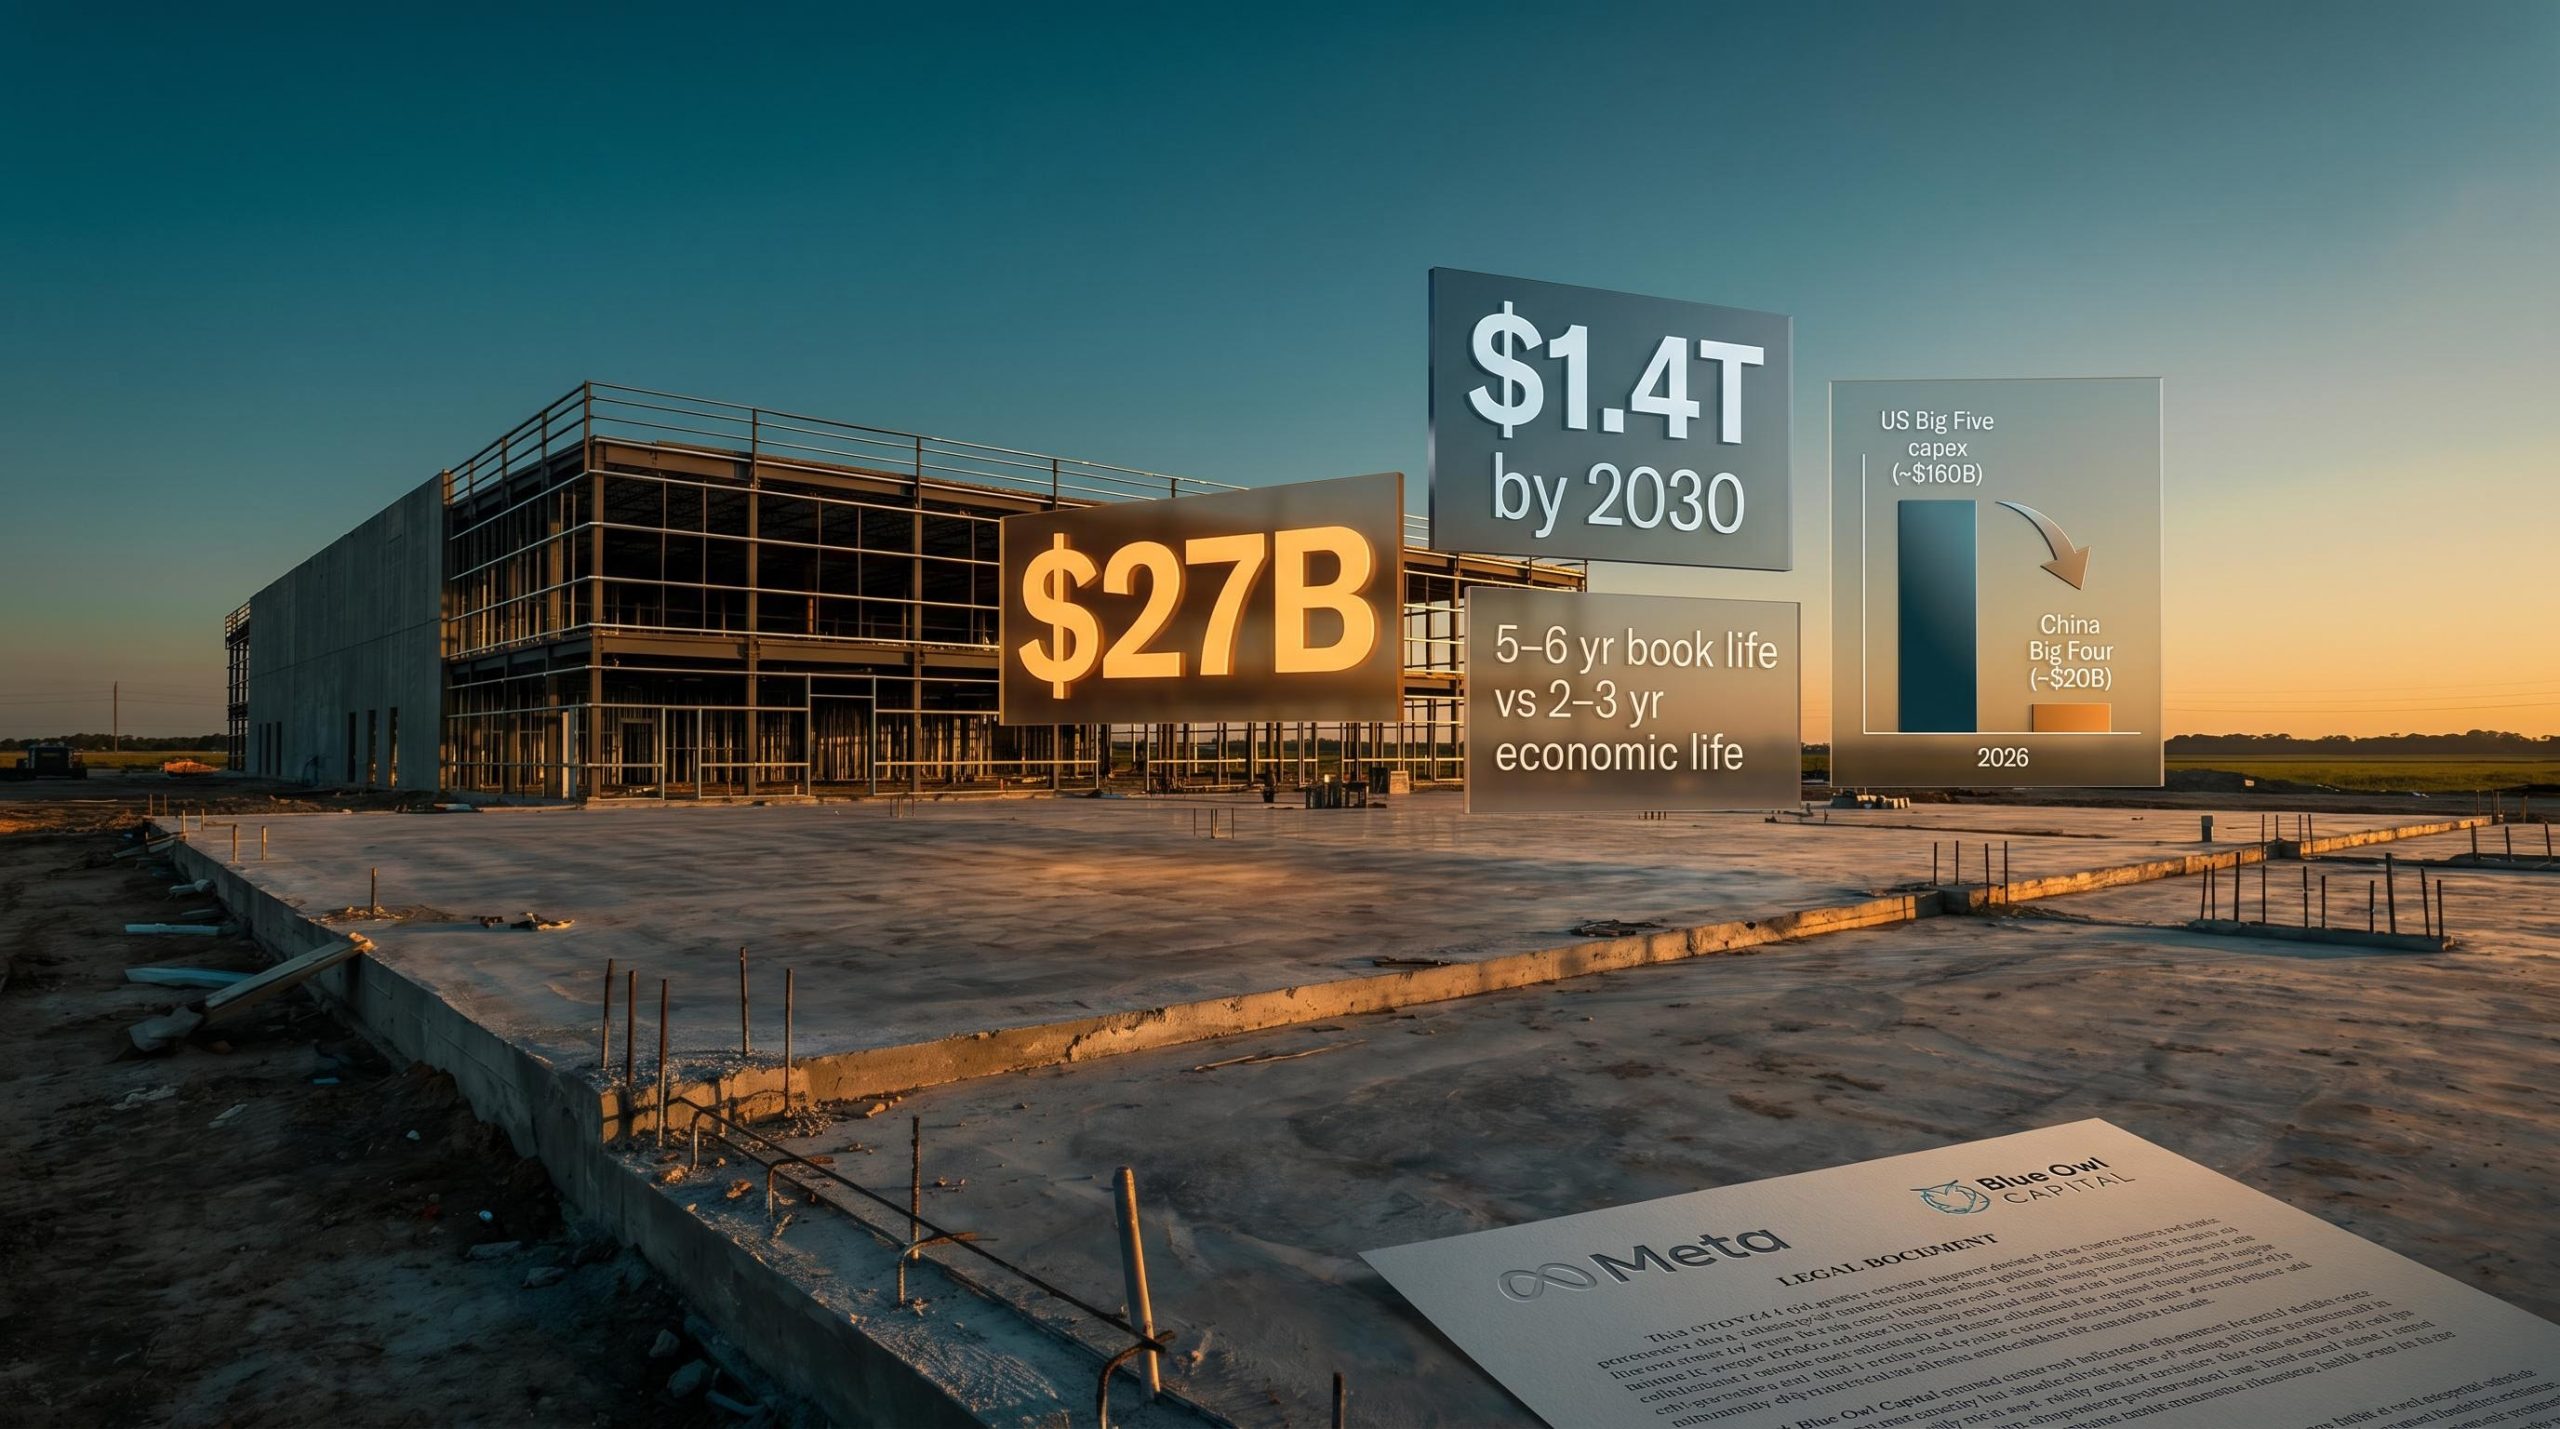
GQG Partners portfolio manager Brian Kersmanc has built a structured case that standard accounting, applied honestly, can still misrepresent the economics of AI infrastructure investment. The distortions span depreciation lives stretched beyond hardware reality, construction-in-progress balances absorbing tens of billions in uncommissioned spend, and off-balance-sheet joint ventures transferring major commitments outside the consolidated balance sheet. The scale is not trivial: US Big Five technology companies are on a path to deploy approximately $1.4 trillion in cumulative AI infrastructure capex by 2030, dwarfing the projected $320 billion from their Chinese counterparts.
Here is a practical framework for reading hyperscaler balance sheets with those structural distortions in view, using Meta’s $27 billion Louisiana data centre joint venture with Blue Owl Capital as a concrete case study of how the accounting works in practice.
Why standard accounting makes AI infrastructure look cheaper than it is
When a hyperscaler buys a rack of GPUs, the cost does not hit the income statement immediately. It is capitalised, meaning it sits on the balance sheet as a long-lived asset, and the expense is spread across future periods through depreciation. That is standard practice. The question is how many periods.
Hyperscaler 10-K filings commonly assign useful lives of five to six years to GPU and accelerator hardware. Kersmanc’s analysis at GQG estimates the realistic economic life of leading-edge AI hardware at two to three years, given Nvidia’s product cycle cadence and the pace at which new architectures render prior generations uncompetitive.
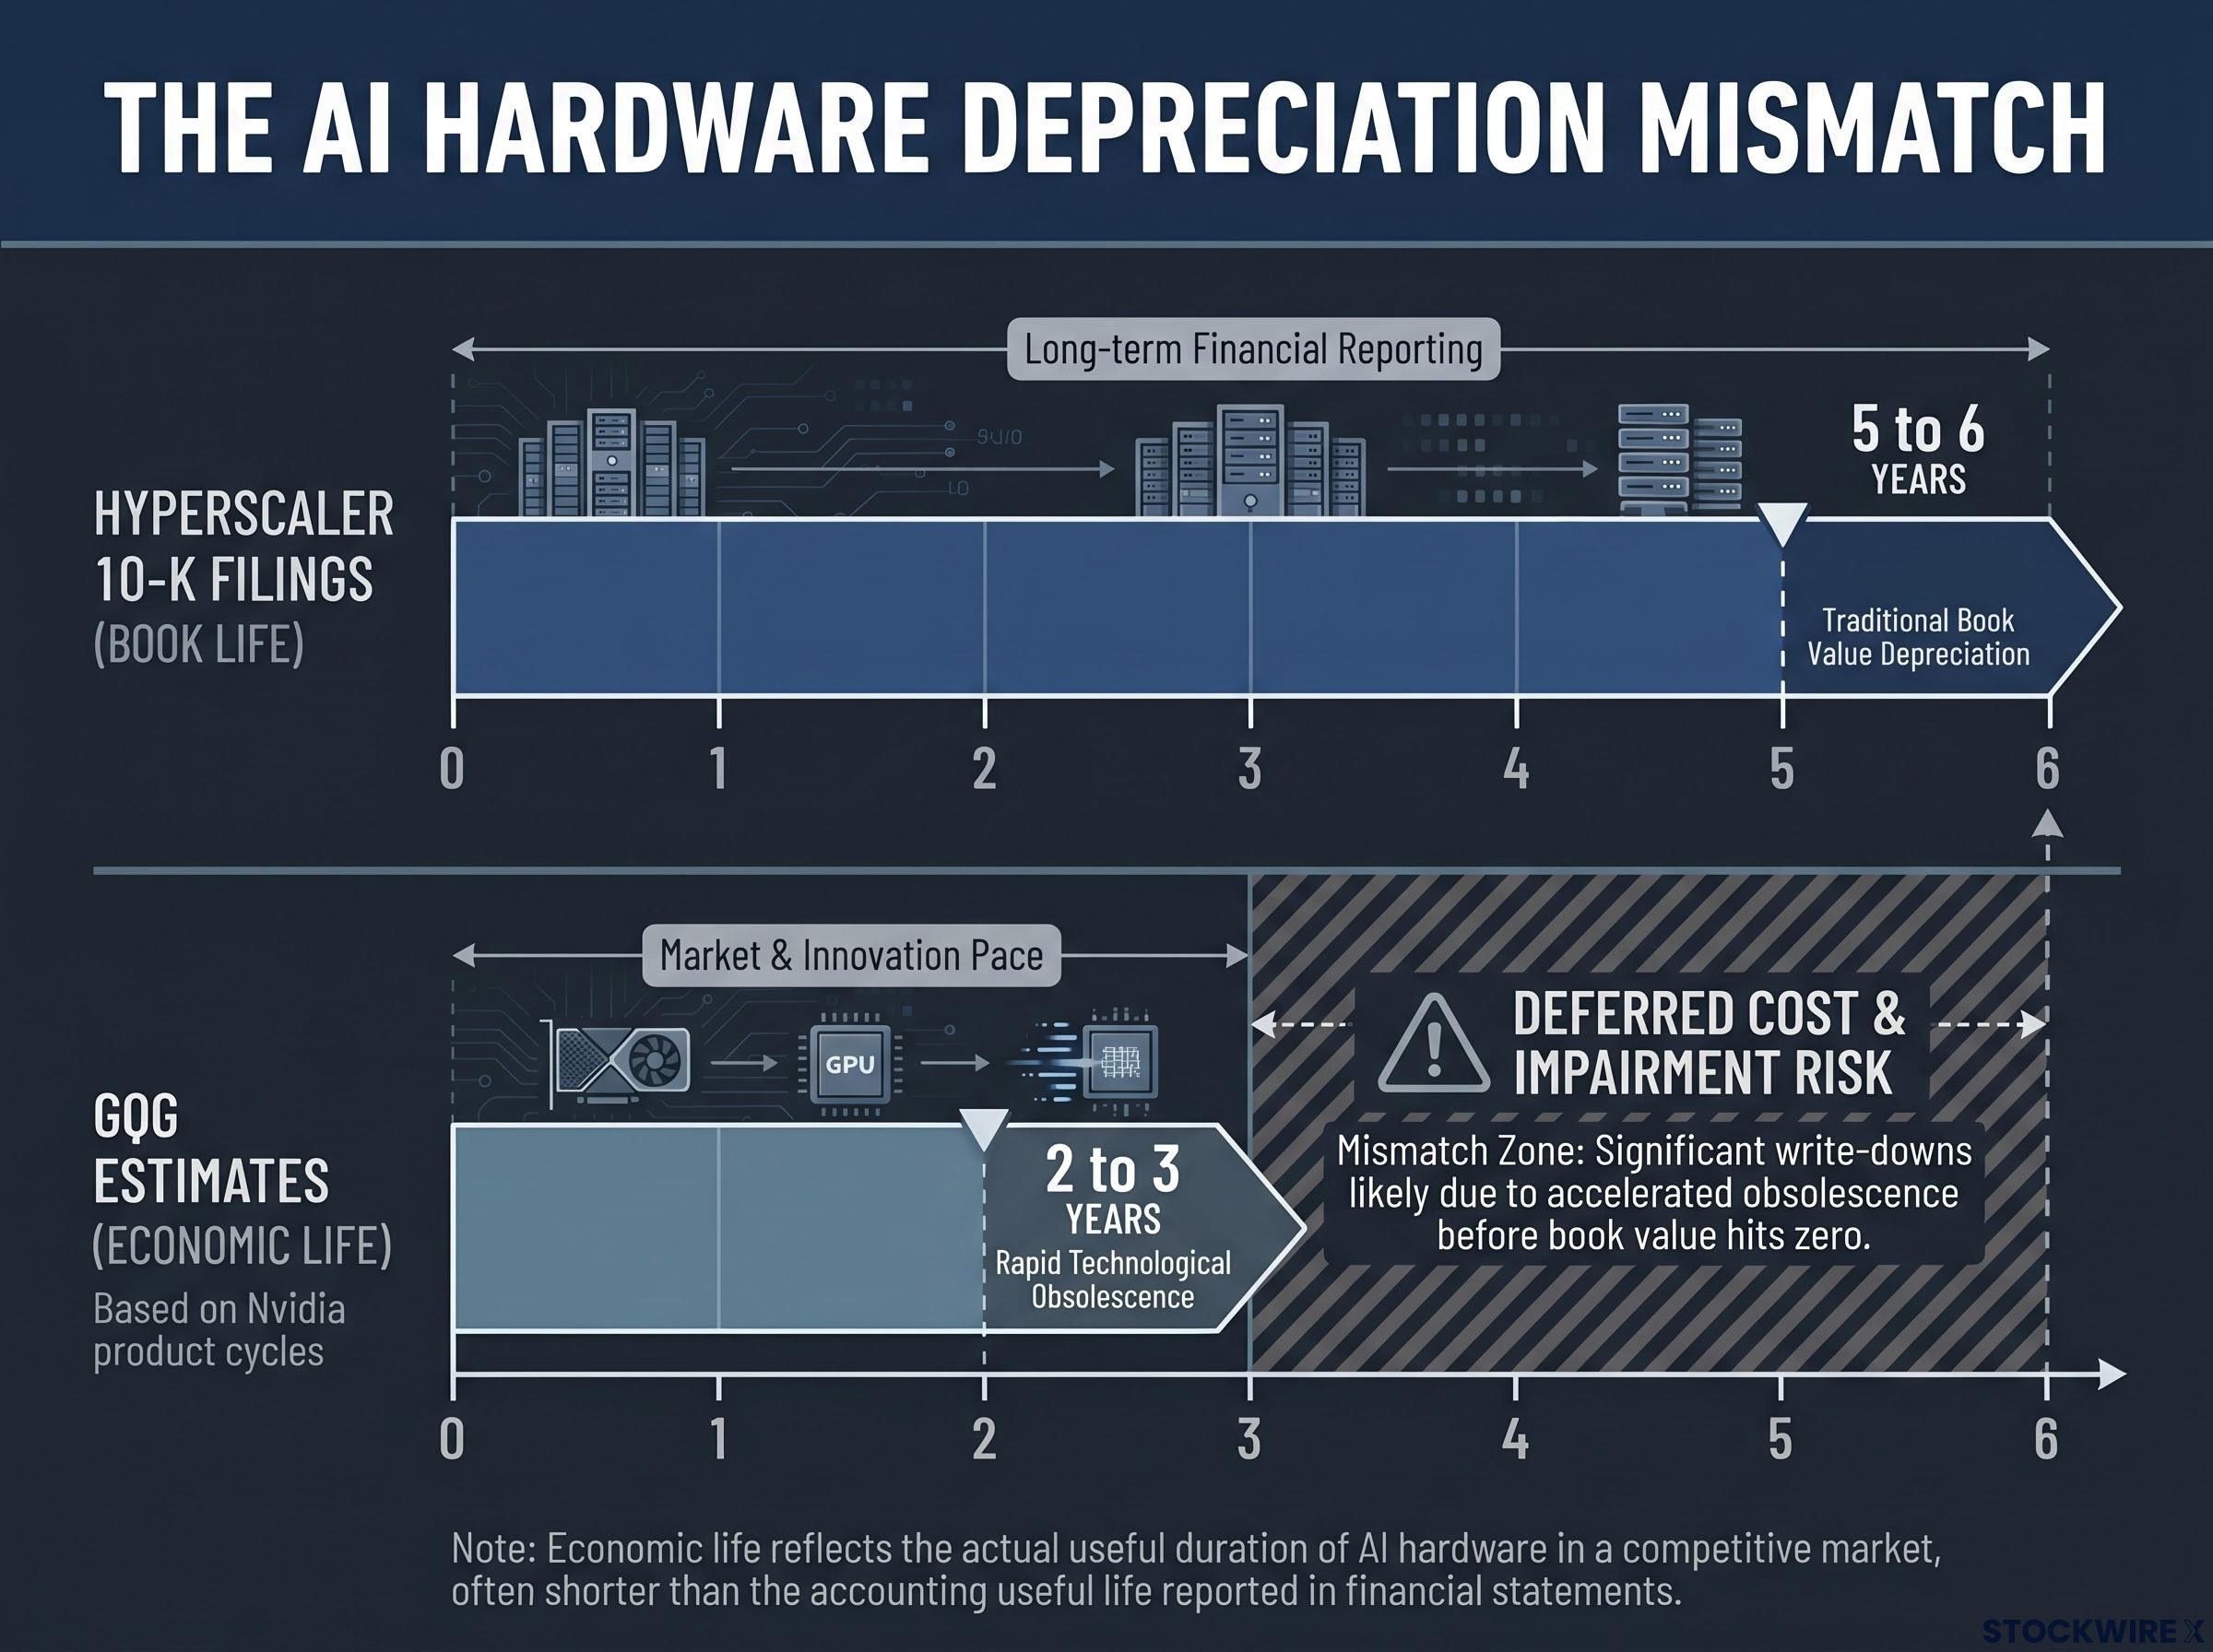
GQG estimates that AI hardware economic lives run two to three years, against five-to-six-year book schedules disclosed in hyperscaler 10-K filings.
The gap between those two numbers is where the distortion lives. AI service revenue is recognised today, but a disproportionate share of the hardware cost supporting that revenue is pushed into future income statements. The consequences flow in sequence:
The accounting distortions documented here do not exist in isolation: they are structural features of the broader AI infrastructure investment cycle, in which hyperscaler free cash flow compression, opaque monetisation timelines, and Wall Street’s one-year ROI ultimatum are compressing the window for balance sheet assumptions to prove out.
- Near-term profitability is flattered because current-period margins carry revenue earned on infrastructure whose cost has been only partially recognised
- Future earnings carry forward impairment risk if demand, pricing, or utilisation disappoints before the depreciation schedule runs its course, forcing the true cost to surface in a compressed and market-moving way
The earnings consequence of stretched depreciation
The deferred cost recognition creates a forward liability that is invisible in current-period income statements. Consider Alphabet’s 2026 capex guidance of $175-185 billion against Google Cloud revenue of approximately $59 billion. The capex-to-sales ratio tension is stark, yet it is partially obscured by the fact that only a fraction of each year’s spend is recognised as an expense in that year.
If the depreciation assumptions prove too generous, the cost does not arrive gradually. It arrives as impairment charges that compress years of deferred expense into a single reporting period. For every quarter you read a hyperscaler earnings release today, a portion of the infrastructure cost supporting those AI revenues has been deferred into future periods, making current margins look stronger than the underlying economics can sustain long-term.
When big ASX news breaks, our subscribers know first
Construction in progress as a holding zone for uncommitted capital
A balance sheet is a map of where capital sits. Construction in progress (CIP), the category where data centre build costs accumulate before assets are placed into service and depreciation begins, is the part of that map with a deliberate blank spot. Cash has been spent. The capital is real and committed. But CIP assets attract no depreciation charge, generate no revenue attribution, and sit outside the denominator of return-on-asset calculations.
That matters because it makes standard productivity metrics look better than reality:
- Return-on-asset distortion: A growing share of the infrastructure base is excluded from the operating asset denominator, flattering ROA and capex productivity ratios
- The Meta illustration: GQG analysis cited in Morningstar on 26 June 2026 found that Meta’s CIP line item grew by a factor of two across 2024 and 2025, pointing to a substantial body of hardware and build expenditure that has not begun depreciating and has not yet demonstrated a return
What to extract from the balance sheet footnotes
The diagnostic is straightforward. Pull CIP separately from gross property, plant, and equipment (PPE). Compute CIP as a percentage of total PPE, and track that ratio over rolling quarters. A ratio that is rising quickly tells you capital is being committed and spent at a pace that outstrips commissioning, which means the return on that capital is being deferred alongside the depreciation.
Limited project-level detail, inconsistent “placed in service” decisions, and opaque interactions with sale-leaseback structures make CIP balances difficult to evaluate from outside. That opacity is precisely why tracking the ratio over time is more informative than reading any single quarter’s footnote in isolation.
The Meta-Blue Owl joint venture as a case study in off-balance-sheet AI financing
The accounting distortion deepens when CIP dynamics intersect with off-balance-sheet financing. Meta’s joint venture with Blue Owl Capital for a Louisiana AI data centre, announced in October 2025, is the clearest public illustration and is increasingly treated as a sector template.
The structure is legitimate. Blue Owl investors take real economic exposure, and the arrangement reflects genuine risk-sharing. But understanding what it removes from view for Meta equity investors requires working through the mechanics.
The Meta-Blue Owl Louisiana data centre joint venture represents approximately $27 billion in committed AI infrastructure.
| Entity | Ownership stake | Balance sheet treatment | Key exposure |
|---|---|---|---|
| Blue Owl Capital funds | ~80% | Consolidated on Blue Owl fund balance sheets | Project debt, construction risk, utilisation risk |
| Meta Platforms | ~20% | Off Meta’s consolidated balance sheet | Lease-back commitments, residual value guarantees |
Because Meta holds a minority stake, the assets and liabilities of the vehicle do not appear on Meta’s consolidated balance sheet. Reported PPE, CIP, leverage, and return on assets all look more favourable than they would if the $27 billion commitment were consolidated.
Why this structure is becoming sector-standard
Alphabet is now backstopping third-party data centre and energy infrastructure vehicles in a similar pattern, per GQG analysis, introducing new contingent liabilities in unconsolidated structures. For Meta equity investors, the residual value guarantees and lease commitments tied to this JV represent real economic exposure that does not show up in standard debt-to-equity or capital intensity ratios. Any valuation framework built on reported balance sheet figures is working with an incomplete picture of the company’s infrastructure obligations.
Hyperscaler debt issuance has escalated in parallel with the capex commitments: the Big Four issued $121 billion in debt in 2025, approximately four times the five-year average, and project a further $100 billion in 2026, meaning the off-balance-sheet financing structures described here sit atop an already-elevated on-balance-sheet leverage base.
The US-China capex divergence and what it means for return expectations
The accounting structures described above sit atop a widening macro gap between US and Chinese AI infrastructure spending. The numbers, presented side by side, are striking before any editorial comment is required.
| Metric | US Big Five | China Big Four |
|---|---|---|
| 2024 capex | ~$110B | ~$17B |
| 2025 capex | ~$135B | ~$22B |
| 2026 capex (estimated) | ~$160B | ~$20B |
| Cumulative to 2030 (projected) | ~$1.4T | ~$320B |
| Planned data centres | ~5,500 | ~500 |
Source: Brian Kersmanc, GQG Partners, drawing on Goldman Sachs, Dell’Oro Group, and GQG analysis.
Stanford AI Index data shows US private AI investment reached $285.9 billion in 2025, more than 23 times China’s $12.4 billion.
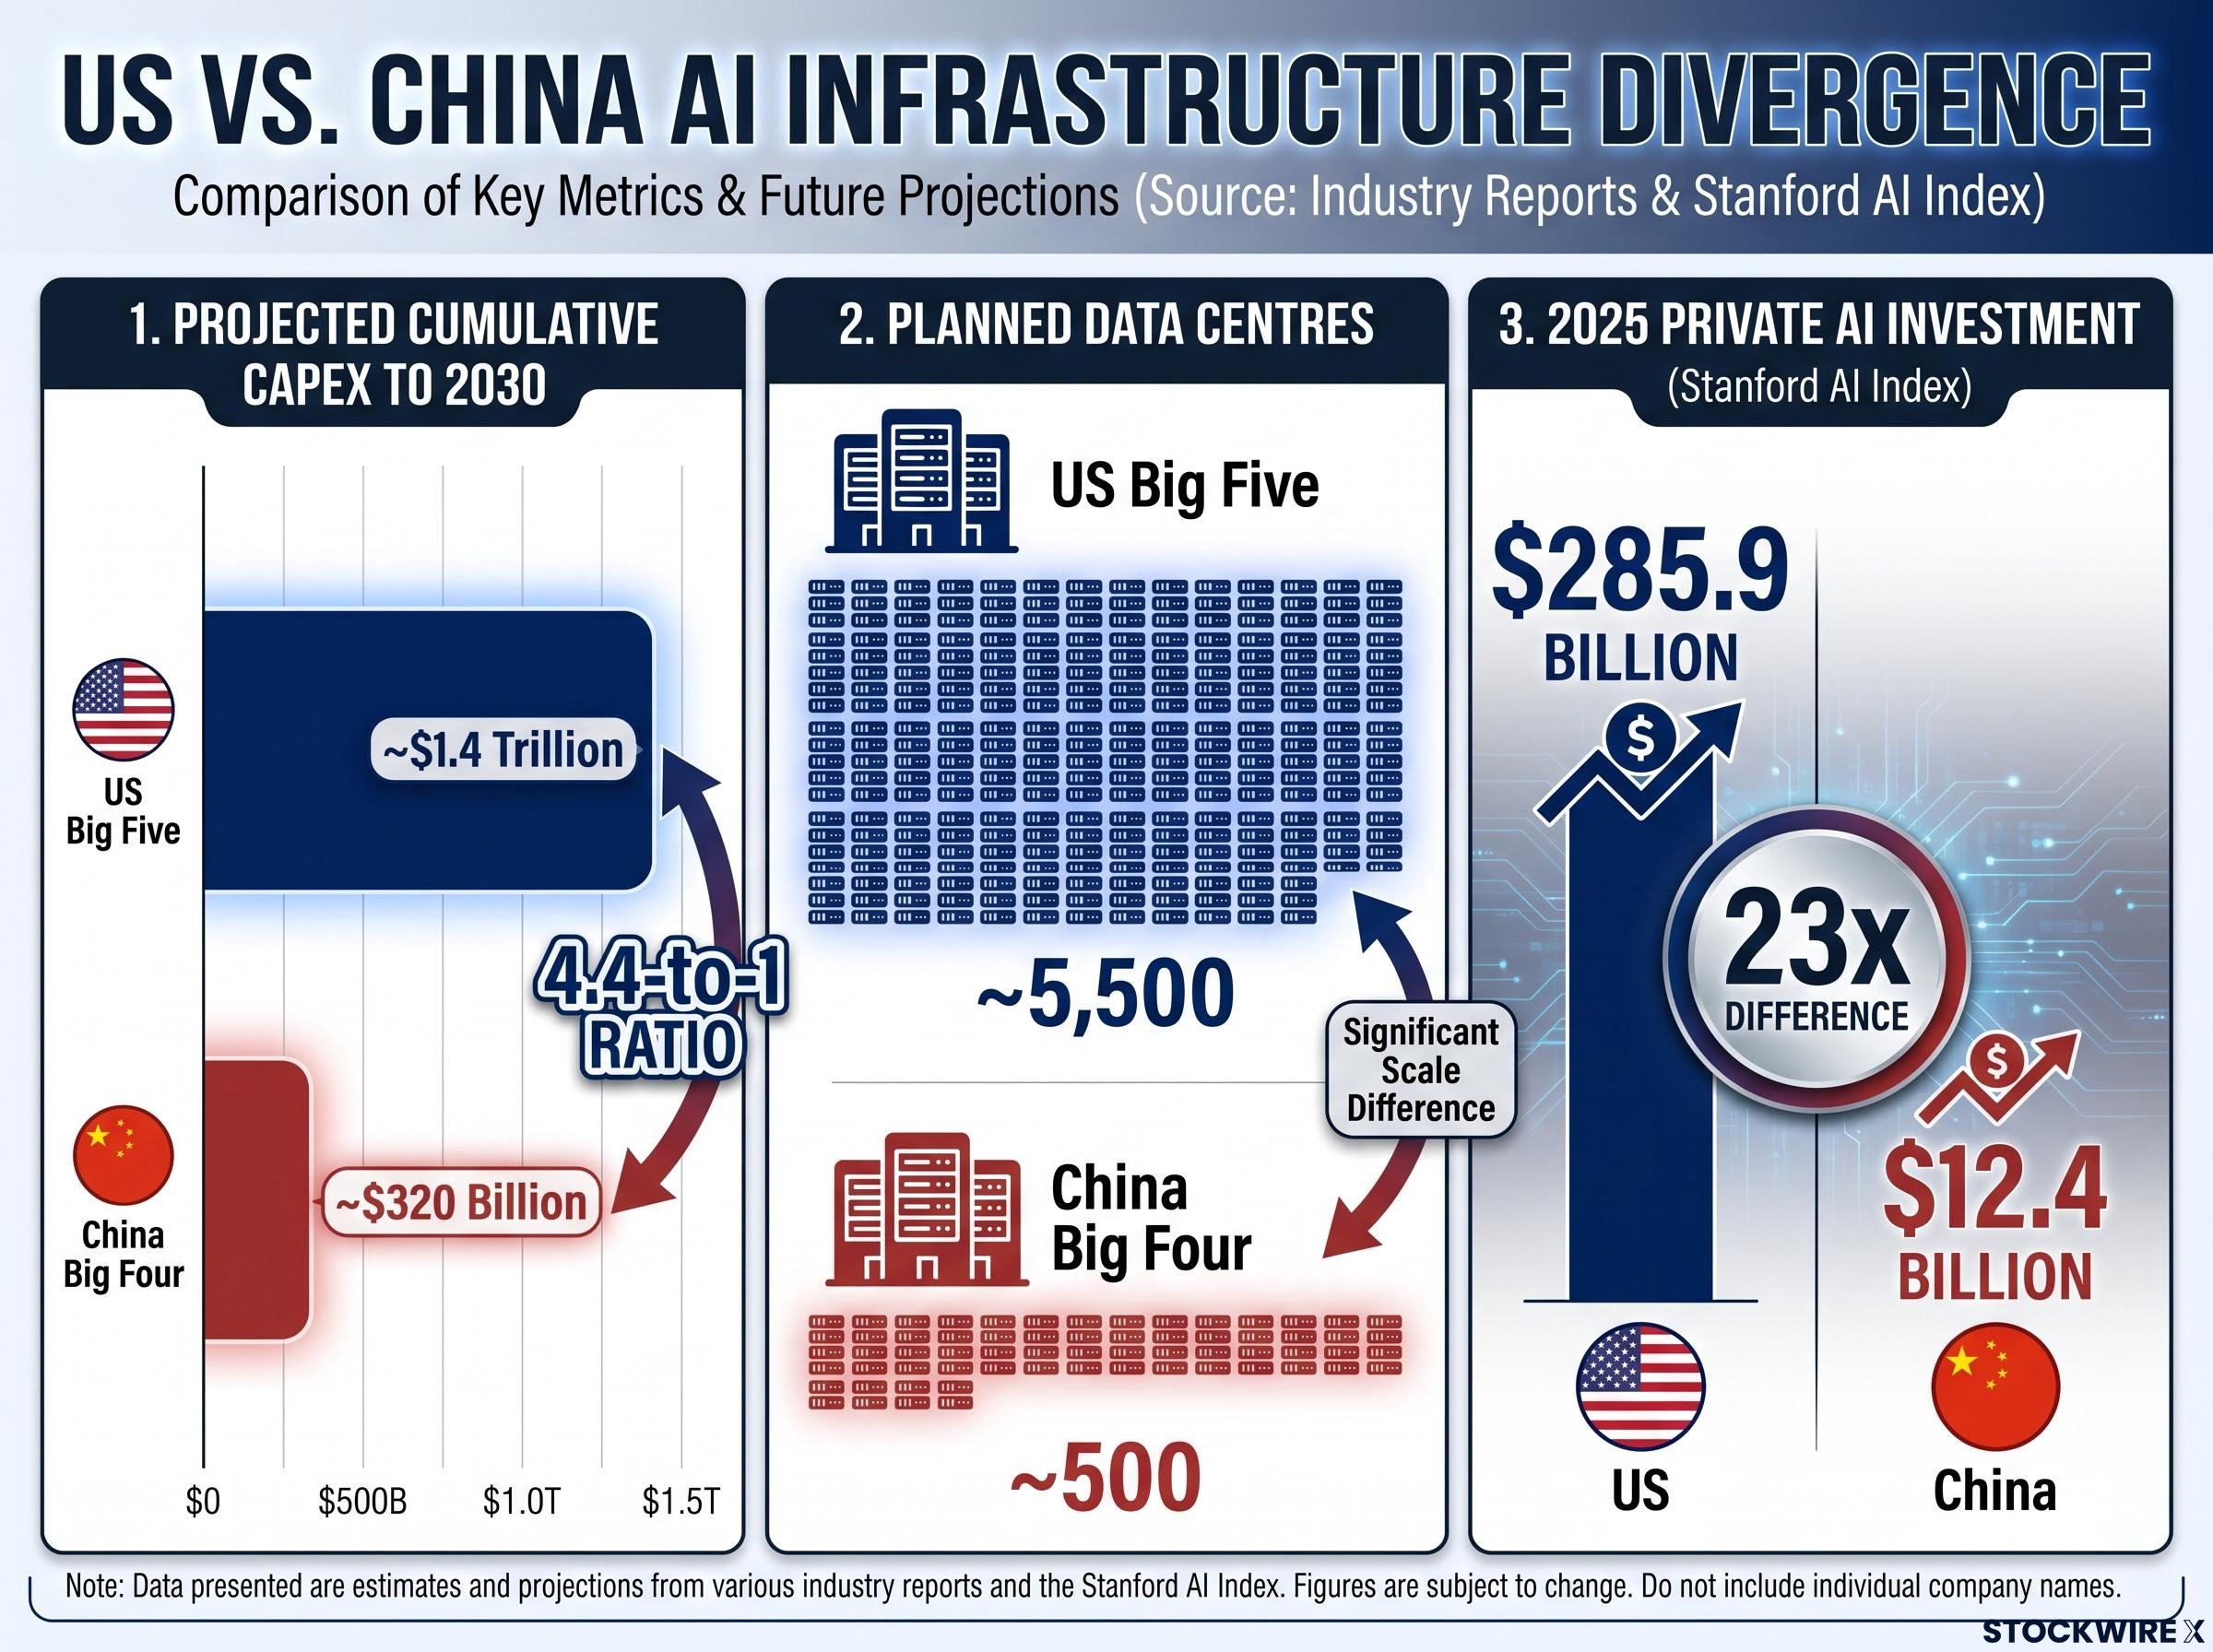
The approximately 4.4-to-1 cumulative capex divergence projected by 2030 raises a strategic question. Chinese developers are increasingly leveraging open-source models with lower training costs and significantly less capital expenditure on physical infrastructure. If comparable AI capability is being delivered at a fraction of the capital intensity, the return hurdle for US hyperscalers is correspondingly higher.
The accounting structures described in preceding sections reduce visibility into whether that hurdle is being cleared. US investors are implicitly underwriting a bet that physical AI infrastructure scale generates returns that lower-cost approaches cannot replicate, and that bet is currently being carried at face value by balance sheets that are not fully transparent about their real obligations.
Semiconductor market concentration adds another layer to this risk: semiconductor companies accounted for a record 13% of US equity market capitalisation in April 2026, surpassing dot-com era levels, meaning that a compression in hyperscaler capex growth would reverberate through a sector now structurally embedded in broad index returns.
Execution risk and the data centre pipeline that may not be built
GQG’s label for this research, “Dotcom on Steroids,” earns its weight in this section. The accounting concerns described above assume the planned infrastructure actually gets built. A growing body of evidence suggests it may not.
Community and regulatory resistance to AI data centre development is intensifying across the United States:
- High electricity consumption straining local grids
- Significant water usage for cooling systems
- Broader environmental and quality-of-life impacts on surrounding communities
- Political responses emerging at the local and state level as opposition organises
Kersmanc estimates that approximately 50% of data centres originally scheduled for completion have either not yet begun construction or have been cancelled entirely.
Source: Brian Kersmanc, GQG Partners, as of 26 June 2026
Global data centre pipeline data supports the concern. Since 2018, only a small proportion of announced projects have reached operational or under-construction status, with large volumes remaining in announced, delayed, or cancelled categories.
What slippage means for balance sheet assumptions
CIP balances and off-balance-sheet JV commitments are modelled on announced build schedules. When approximately half the pipeline stalls, the capital already committed to those plans remains in accounting limbo for longer than models assume. Depreciation schedules and return calculations are built on infrastructure timelines that are not being realised.
This divergence between accounting treatment and physical reality does not surface in standard financial reporting until impairments or project-level disclosures are forced. If the planned data centre pipeline underlying hyperscaler CIP balances and off-balance-sheet JV commitments does not materialise on schedule, the eventual reckoning will compress into a smaller forward window.
Six diagnostics for reading hyperscaler balance sheets with the distortions in view
The preceding sections identify four distinct mechanisms that separate reported financial figures from economic reality. This framework, drawn from GQG’s analytical approach, converts those concerns into specific steps you can apply to the next hyperscaler earnings release.
The most important signals reside in footnotes and contingent liability disclosures, not in top-line capex numbers.
- Start with CIP, not just PPE. Extract the CIP line and compute it as a percentage of total PPE. Track the ratio over rolling quarters. Large or fast-rising ratios warrant deeper review of commissioning timelines.
- Test depreciation assumptions against product cycle reality. Compare disclosed useful lives for AI hardware across hyperscalers. Challenge five-to-six-year GPU schedules against observed product cycles and expected economic obsolescence of two to three years.
- Map off-balance-sheet exposure. Build a side schedule of all unconsolidated vehicles, sale-leasebacks, special purpose vehicles (SPVs), and joint ventures tied to data centres and energy infrastructure. Include lease obligations, residual value guarantees, and credit backstops.
- Triangulate capex versus physical progress. Cross-check capex guidance and run-rates with evidence of actual construction milestones: permits, power agreements, contractor announcements, and commissioning dates.
- Adjust return metrics for total capital deployed. Recalculate return on assets (ROA) and return on invested capital (ROIC) with an expanded denominator that includes estimated off-balance-sheet infrastructure.
- Track AI revenue against infrastructure intensity. Monitor AI-specific revenue lines relative to AI-related capex. A widening gap between infrastructure growth and AI revenue traction is an early warning that balance sheet assumptions on asset lives and returns may not hold.
Investors who apply this framework will often find that adjusted ROIC and true capital intensity ratios look materially different from reported figures. Valuation multiples anchored to headline return metrics are implicitly incorporating assumptions about infrastructure efficiency that have not yet been stress-tested against the full picture.
What the accounting does and does not resolve about AI’s investment case
GQG and the analysis presented here do not allege fraud or dishonest reporting. The concern is more structural: standard accounting, honestly applied, can still misrepresent economic realities when asset lives, contingent liabilities, and off-balance-sheet exposures are stretched in ways that are new to this investment cycle.
Four mechanisms create the gap between reported figures and economic reality:
- Depreciation timing mismatch: five-to-six-year book lives against two-to-three-year economic lives
- CIP classification: committed capital sitting outside income statement scrutiny and return-on-asset denominators
- Off-balance-sheet vehicles: real economic exposure via leases and guarantees that does not appear in consolidated filings
- Execution risk: physical construction pipelines stalling while accounting assumptions carry on unchanged
This does not make AI infrastructure investment wrong. Future productivity gains and new revenue streams could still validate much of the current spending, and the bull case is not dismissed. But the US Big Five are on a path to deploy approximately $1.4 trillion by 2030, making this the largest single capital allocation bet in US corporate history.
Investors who rely on headline earnings, capex, and ROA figures without reconstructing the full economic picture are carrying risks that the accounting does not surface until impairments, restatements, or earnings revisions force the issue. The risk is not priced where you can see it. It is priced where you cannot.
For readers wanting to place these balance sheet distortions in the context of broader market valuation, our deep-dive into AI bubble valuation frameworks examines how the S&P 500 Shiller CAPE ratio at 40-41, Minsky financing stage analysis, and the $30 billion Meta SPV combine to assess whether the current cycle has migrated from hedge to speculative financing.
This article is for informational purposes only and should not be considered financial advice. Investors should conduct their own research and consult with financial professionals before making investment decisions. Past performance does not guarantee future results. Financial projections are subject to market conditions and various risk factors.