How Warsh’s 130-Word Statement Reshaped Federal Reserve Policy
18 mins ago
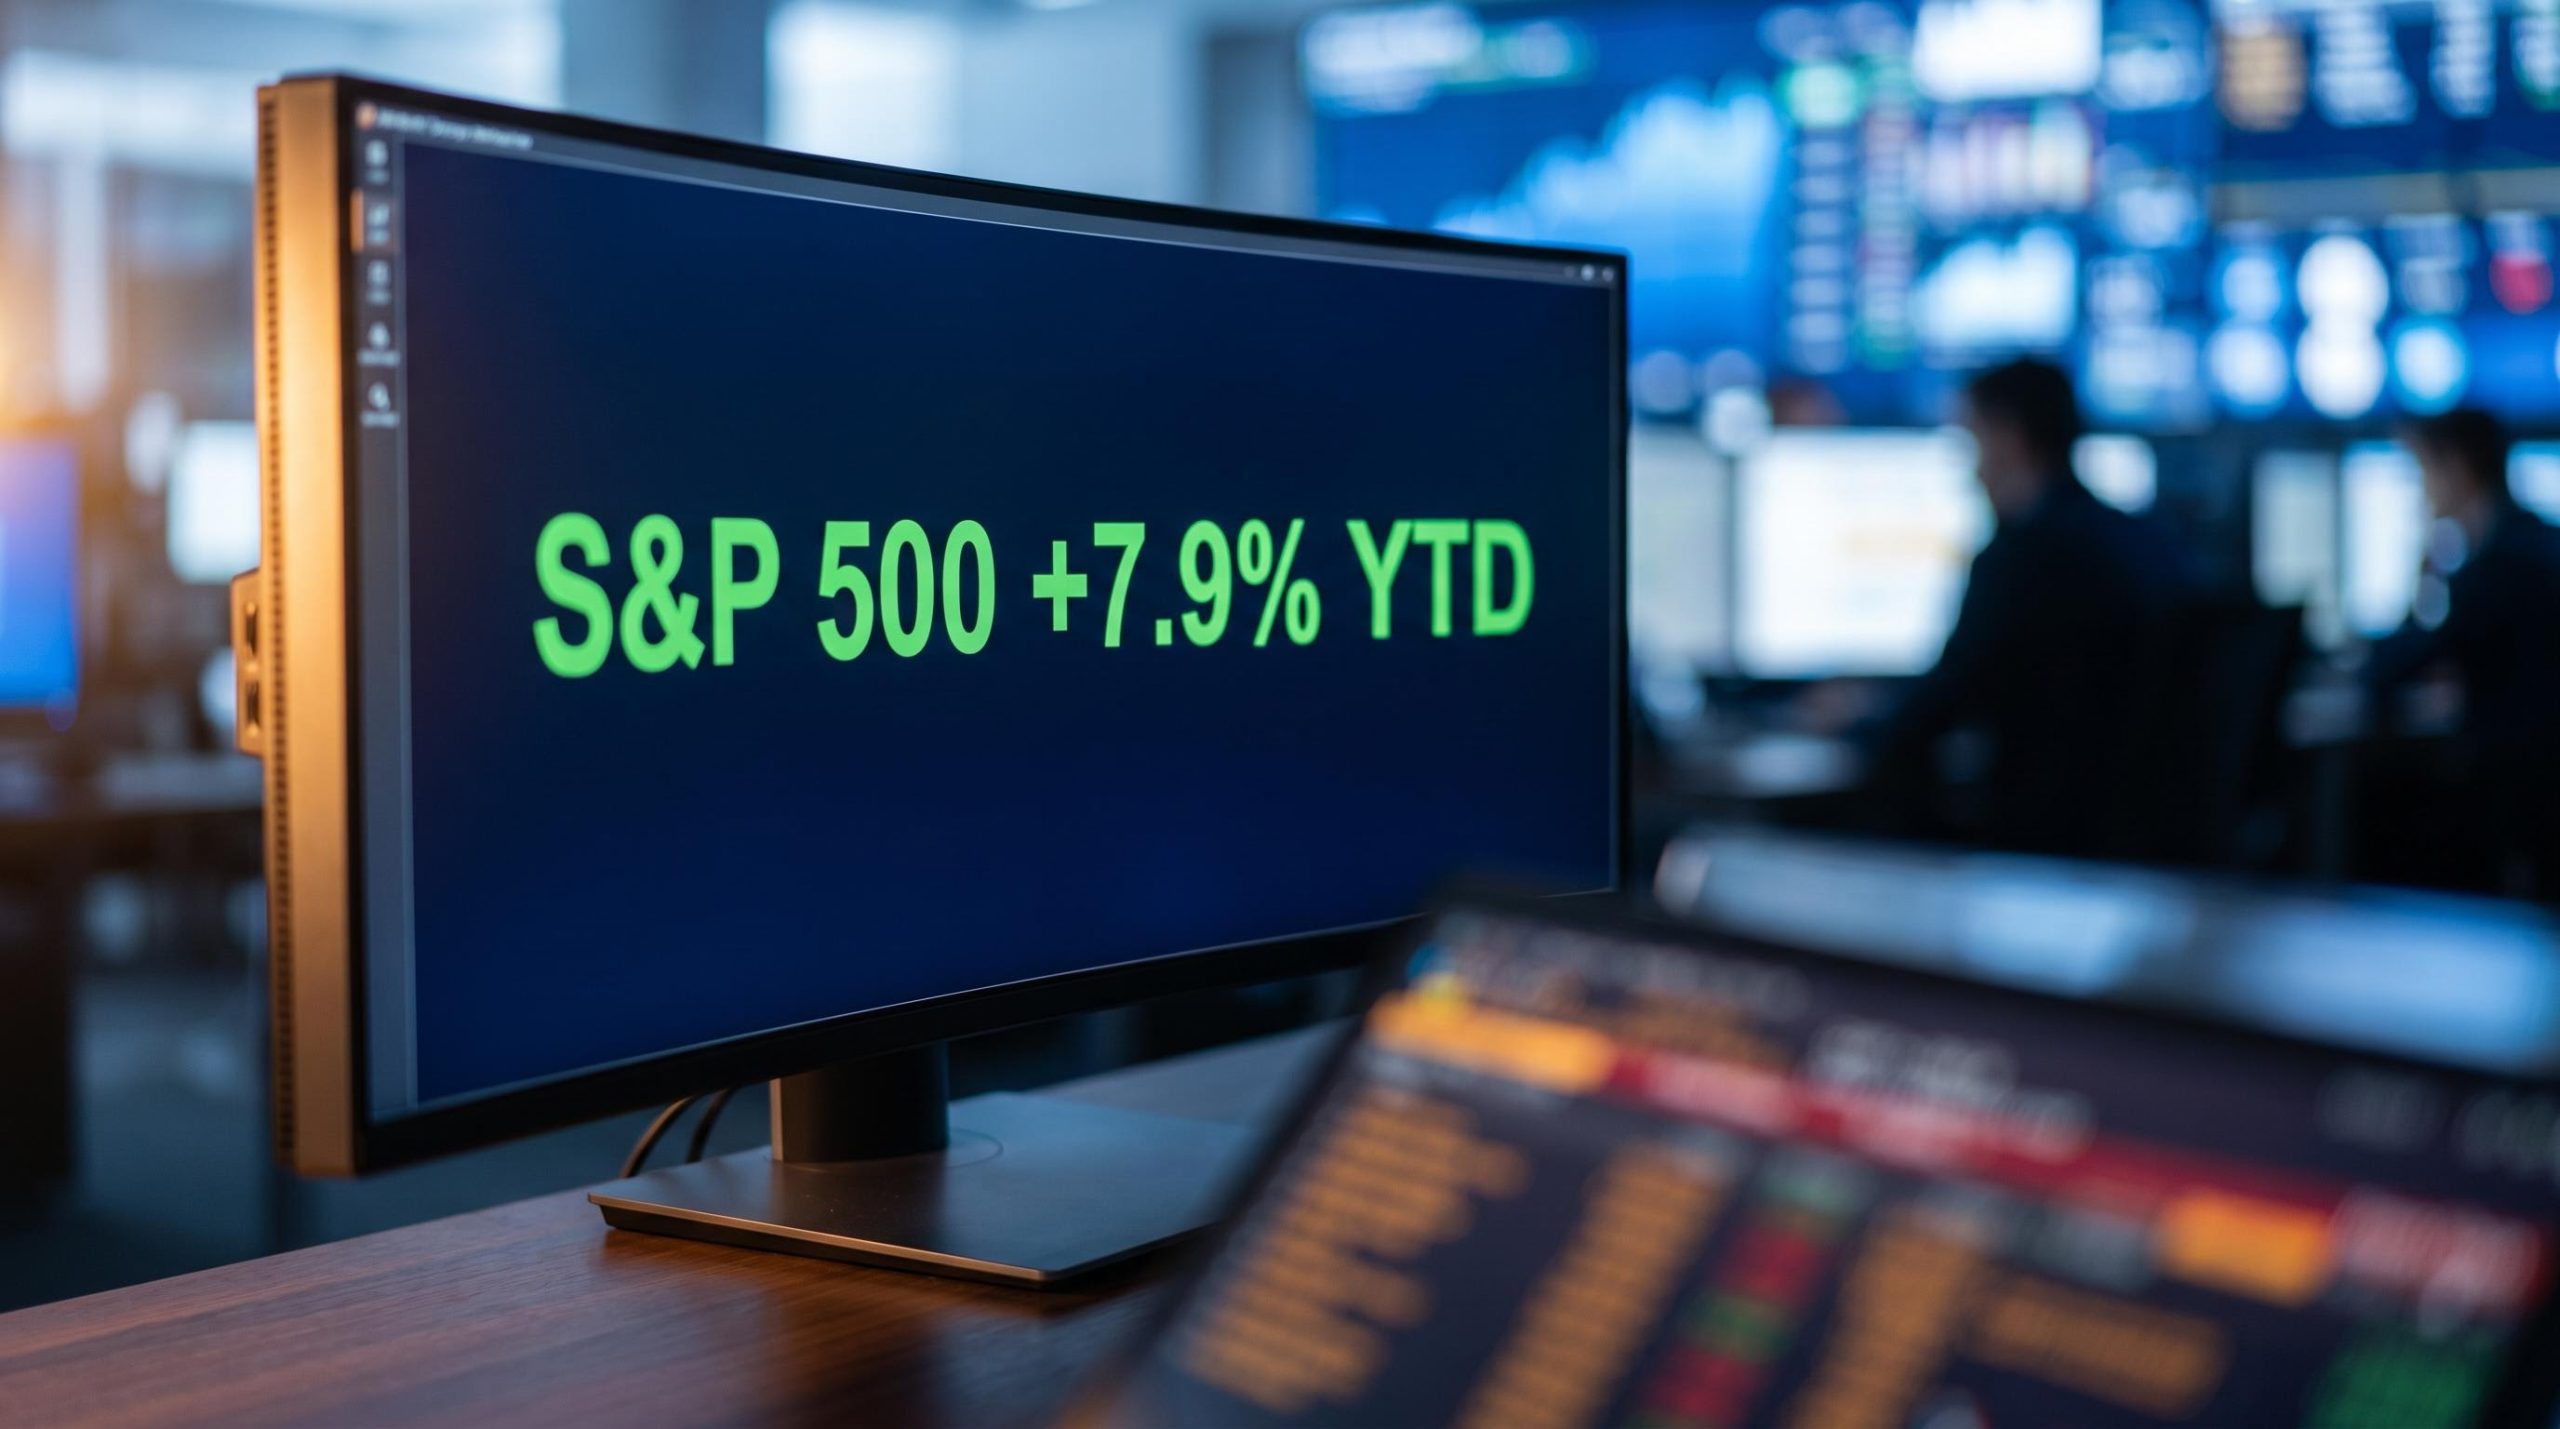
The market outlook for June 2026 presents a striking contradiction: U.S. equity markets are up roughly 7-9% year-to-date, yet the dominant investor conversation focuses almost entirely on what could go wrong. The major indices have absorbed significant geopolitical shocks and shifting rate expectations, but market participants remain highly defensive.
The next two to three days present a narrow window where upcoming commercial and inflation data will either confirm or challenge these bearish assumptions. These specific fears have been quietly accumulating since the U.S. Consumer Price Index printed at 4.2% year-on-year in May 2026. This is not a routine data week, as the gap between expectation and reality may suddenly become visible across global trading desks.
What follows gives you a clear framework for navigating these important releases. After reading, you will understand which specific data thresholds matter, why widely cited risks may already be priced in, and what conditions would genuinely alter your portfolio’s exposure.
Most retail investors treat a purchasing managers index reading of 50 as a hard binary where anything below signals a recession. You must dismantle this misconception to understand what global data is actually telling you.
PMI readings are diffusion indexes that capture how widely change is spreading across surveyed businesses, rather than measuring the absolute scale of economic output. A sub-50 reading simply means more firms are contracting than expanding.
PMI false recession signals occur in roughly 30-40% of cases across advanced economies, according to research from the ECB and Bank of England, partly because geopolitical shocks inflate survey pessimism well beyond what hard output data ultimately validates.
However, the weight of growth among the largest corporations can sustain a broader economic advance even as the headline index slips beneath that threshold.
The Statistical Nuance A sub-50 PMI reading does not automatically indicate economic decline, because growth concentrated among the largest firms can keep the broader economy moving forward.
This mechanic completely shifts how you should interpret recent and upcoming global data. Last month, UK and Eurozone composite PMIs both moved into contraction territory, with rising energy costs identified as the key drag on services activity.
Meanwhile, Japan and U.S. PMIs showed continued expansion during the same period. S&P Global, whose PMI network spans more than 30 economies, scheduled the flash Eurozone PMI release for 08:00 UTC on 23 June 2026.
To read these signals correctly, categorise them into three specific zones: Above 50: The economy is expanding broadly. Near-50 but below: Commercial activity is slowing but not collapsing. * Well-below 50: The data signals a broad and severe contraction.
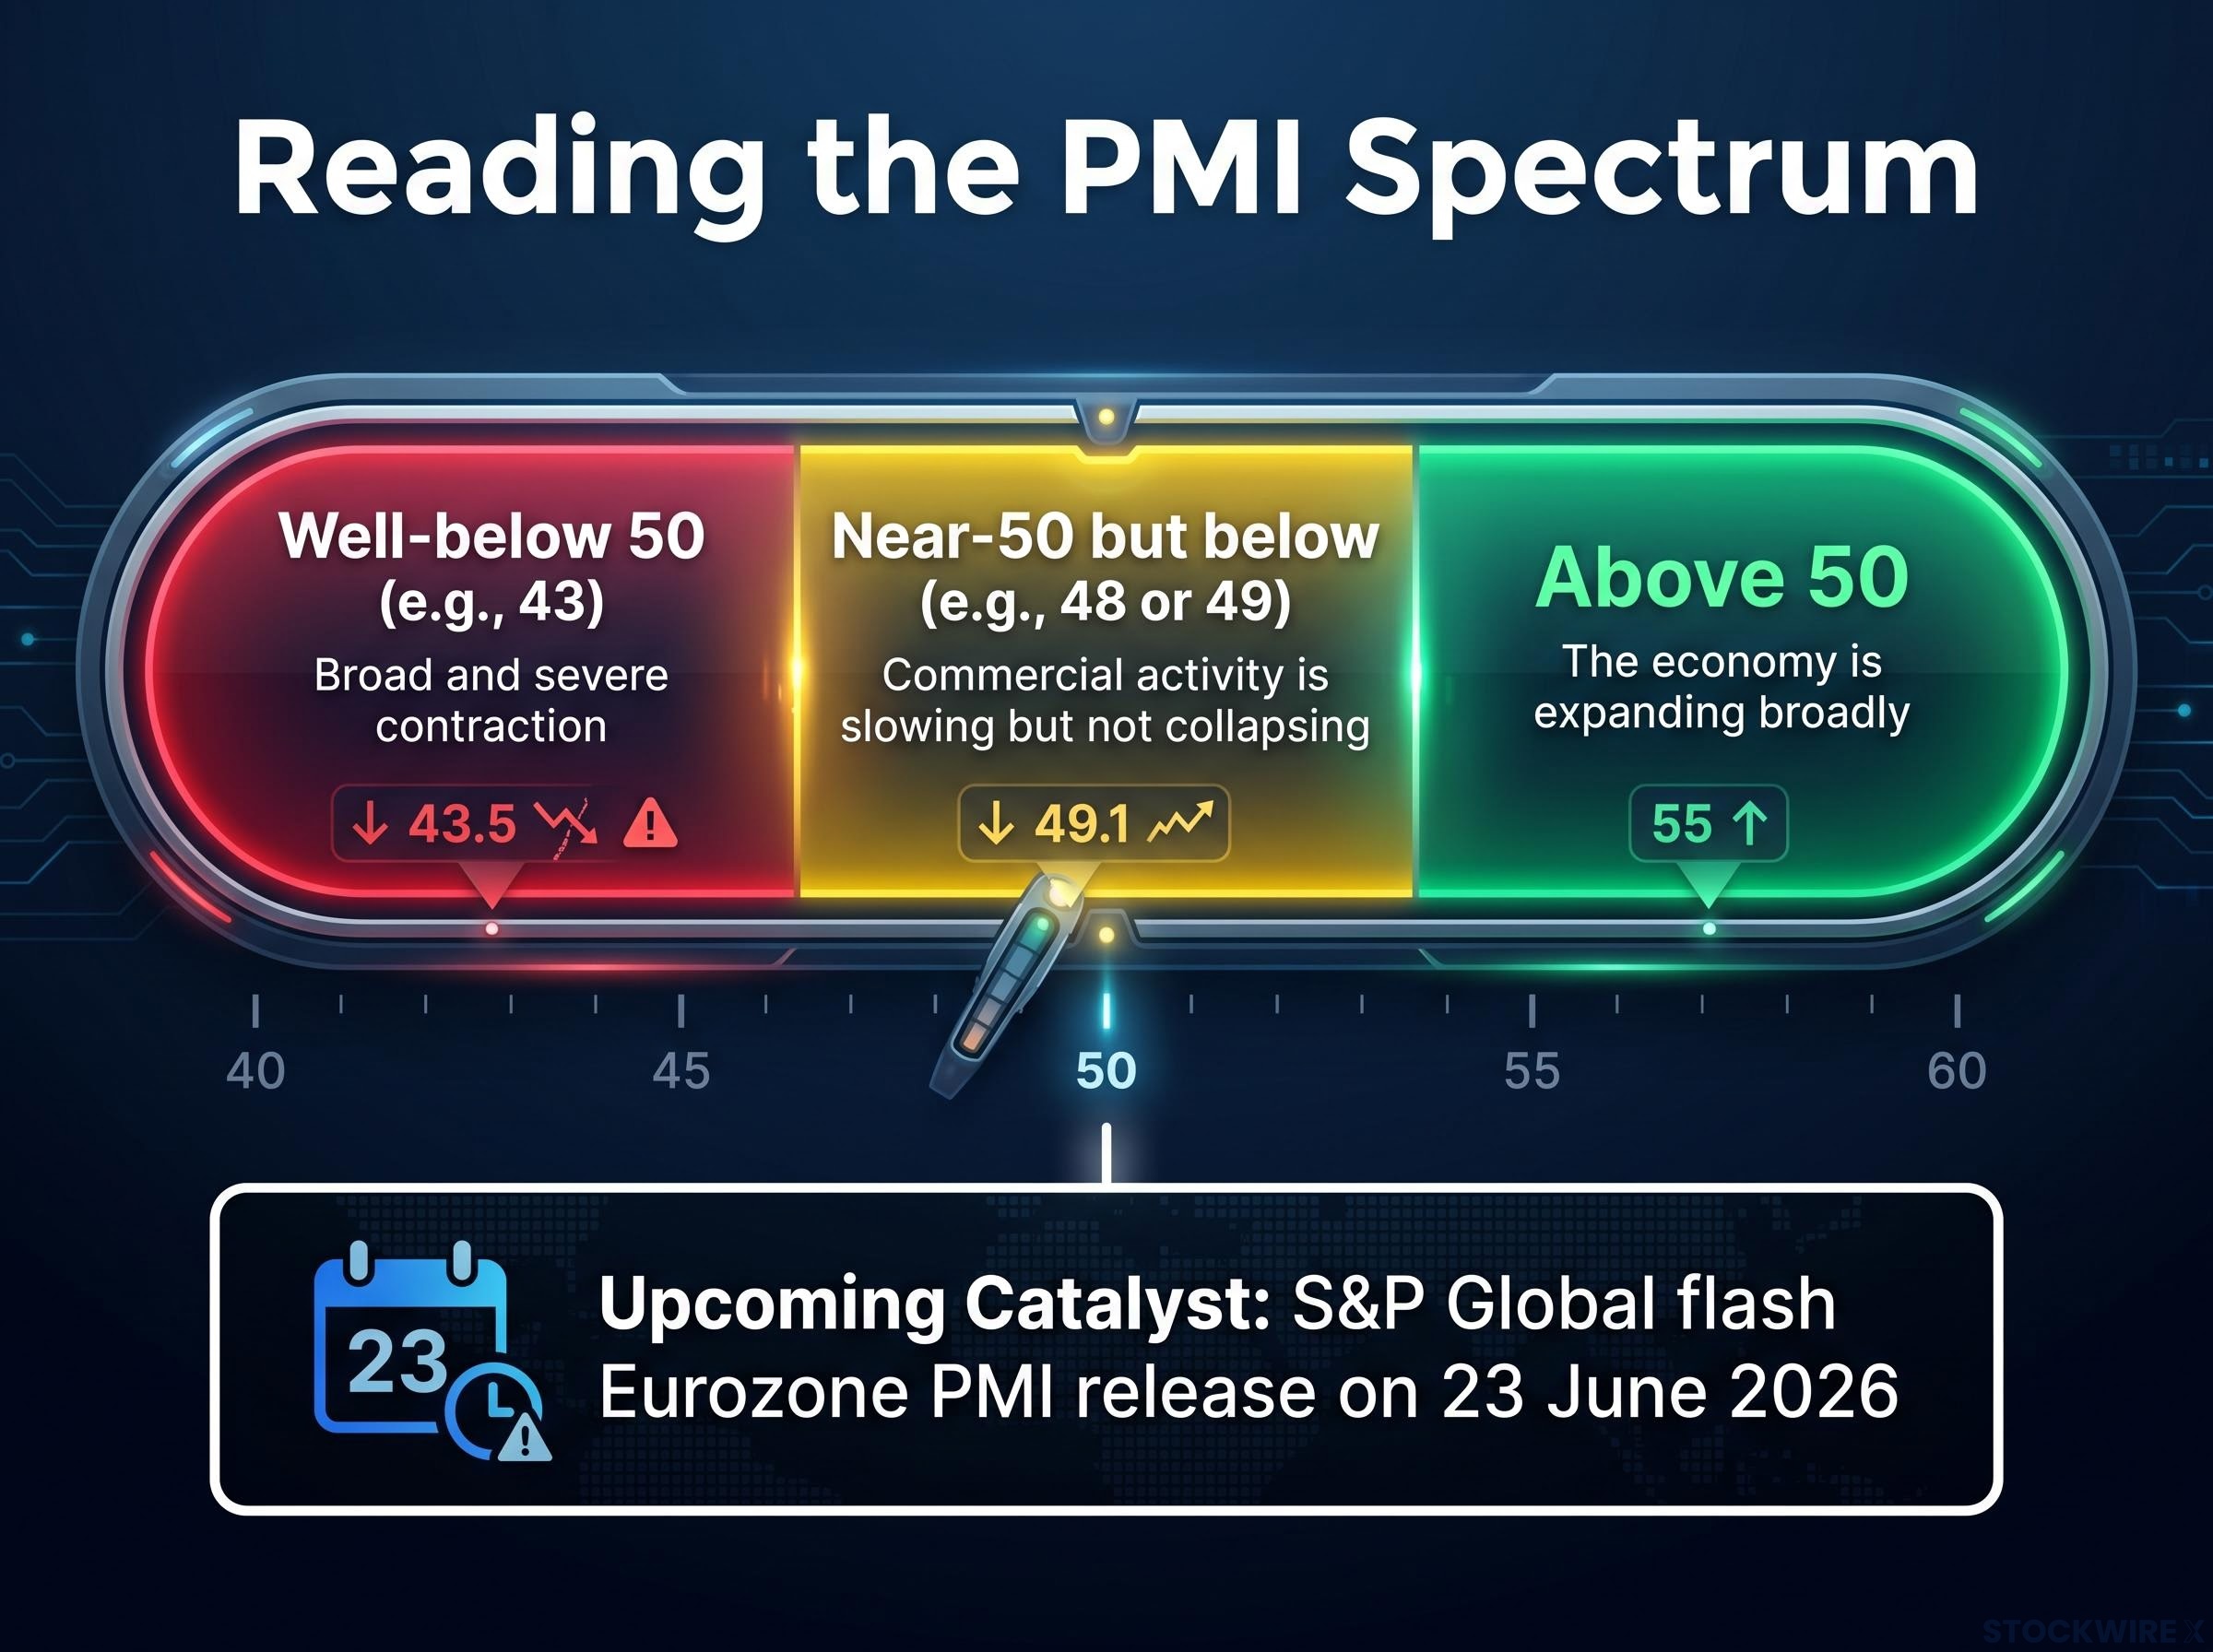
For your portfolio, this mechanic matters immensely. A European PMI print of 48 or 49 is not the same signal as a reading of 43, and understanding the difference tells you whether a relief rally in European-exposed equities is a rational response.
Investor expectations for European and UK PMIs sit at deeply depressed levels following last month’s contraction readings. Energy cost escalation remains the primary drag on service-sector demand across these regions.
Depressed expectations lower the bar for a positive surprise considerably. In conditions like these, data that merely avoids the worst outcome has historically acted as a genuine positive catalyst for equities rather than a neutral one.
For a U.S.-based investor watching European data, the implication is not that Europe’s economy is fine. It means the equity market may already be pricing in a worse outcome than the data will actually deliver, creating an asymmetric opportunity.
When pessimism is pervasive but hard data proves merely mediocre rather than dire, equities tend to grind higher. When incoming numbers simply prove less alarming than feared, markets find a path upward even against a backdrop of persistent uncertainty.
Widely visible risks lose their ability to drive further downside once they are partially priced into valuations.
The current environment features mixed macro data, well-advertised risks, and constructive institutional positioning. This setup explains why the S&P 500 achieved its approximately 7-9% year-to-date performance through mid-June 2026.
Institutional outlooks for U.S. equities now project high-single to low-double-digit gains over the next 12 months, contingent on earnings resilience.
For investors wanting to understand the full institutional landscape behind those projections, our full explainer on the 2026 bull market outlook examines how BlackRock, J.P. Morgan, Fidelity, and two other major asset managers are positioning across equities, including their specific concerns around AI concentration risk and late-cycle drawdown probability.
The headline Consumer Price Index spike to 4.2% year-on-year in May 2026 alarmed many investors. However, separating headline noise from the signal the Federal Reserve actually monitors changes the threat level entirely.
The Fed’s preferred metric is the core Personal Consumption Expenditures index, which strips out food and energy. They exclude these categories precisely because they are volatile and often mean-reverting.
The Federal Reserve Bank of Atlanta on core PCE explains that the index adapts more rapidly to actual shifts in consumer spending patterns than CPI does, which is precisely why policymakers treat it as the more reliable signal when calibrating interest rate decisions.
The move in headline CPI from 3.8% in April 2026 to 4.2% in May is largely attributable to energy price pressures stemming from Middle East instability, reflecting dynamics in oil and fuel markets rather than any sign of broad demand-driven overheating.
The headline versus core CPI split in the May 2026 report carries a 1.3 percentage-point gap, with gasoline prices up 40.5% annually on an Iran-conflict supply shock driving virtually all of the divergence from the more contained 2.9% core reading.
Energy price spikes with a regional geopolitical origin have tended to unwind more quickly than investors typically expect. To see structural inflation take hold, very specific economic forces must dominate the system.
Requirements for Sustained Inflation Broad-based, persistent inflation typically requires large-scale fiscal expansion, significant disruption to supply chains, or a marked acceleration in money supply growth. At present, none of these forces are playing a dominant role.
This means the 4.2% headline number is primarily an energy story, not a broad-based re-acceleration. Recognising this distinction tells you whether the Fed’s policy path is genuinely at risk.
| Metric | May 2026 Reading | What it signals |
|---|---|---|
| Headline CPI | 4.2% YoY | Energy-driven spike |
| Core CPI (ex-food and energy) | 2.9% YoY | Underlying demand pressure moderate |
| PCE | Approx 0.4% MoM | In line with April, no acceleration |
The May PCE publication is scheduled for Thursday of this week, embedded within the Fed’s monthly Personal Income and Outlays report. Analysts estimate the reading will land at approximately 0.4% month-on-month, matching April’s pace without meaningful acceleration.
A reading near 0.4% with no meaningful upside surprise would reinforce the manageable-inflation narrative. It is highly unlikely to shift Fed policy toward renewed hawkishness.
This metric connects directly to your equity valuations. Stable or declining rate-path expectations support current price-to-earnings multiples, while a hotter-than-expected PCE would force markets to reprice those expectations meaningfully.
If PCE lands at or near consensus, it is not merely neutral news. It provides quiet confirmation that the rate environment supporting current equity valuations remains intact.
This creates an asymmetric setup for your portfolio based on three potential outcomes:
A well-constructed investment thesis is incomplete without defined falsifiability. You need to know exactly which observable triggers require a portfolio reassessment, distinguishing between risks that are already priced in and genuine new shocks.
Risks around Middle East tensions and European energy costs are among those that markets appear to have largely absorbed into current valuations. The following scenarios represent genuine structural breaks that would demand immediate attention:
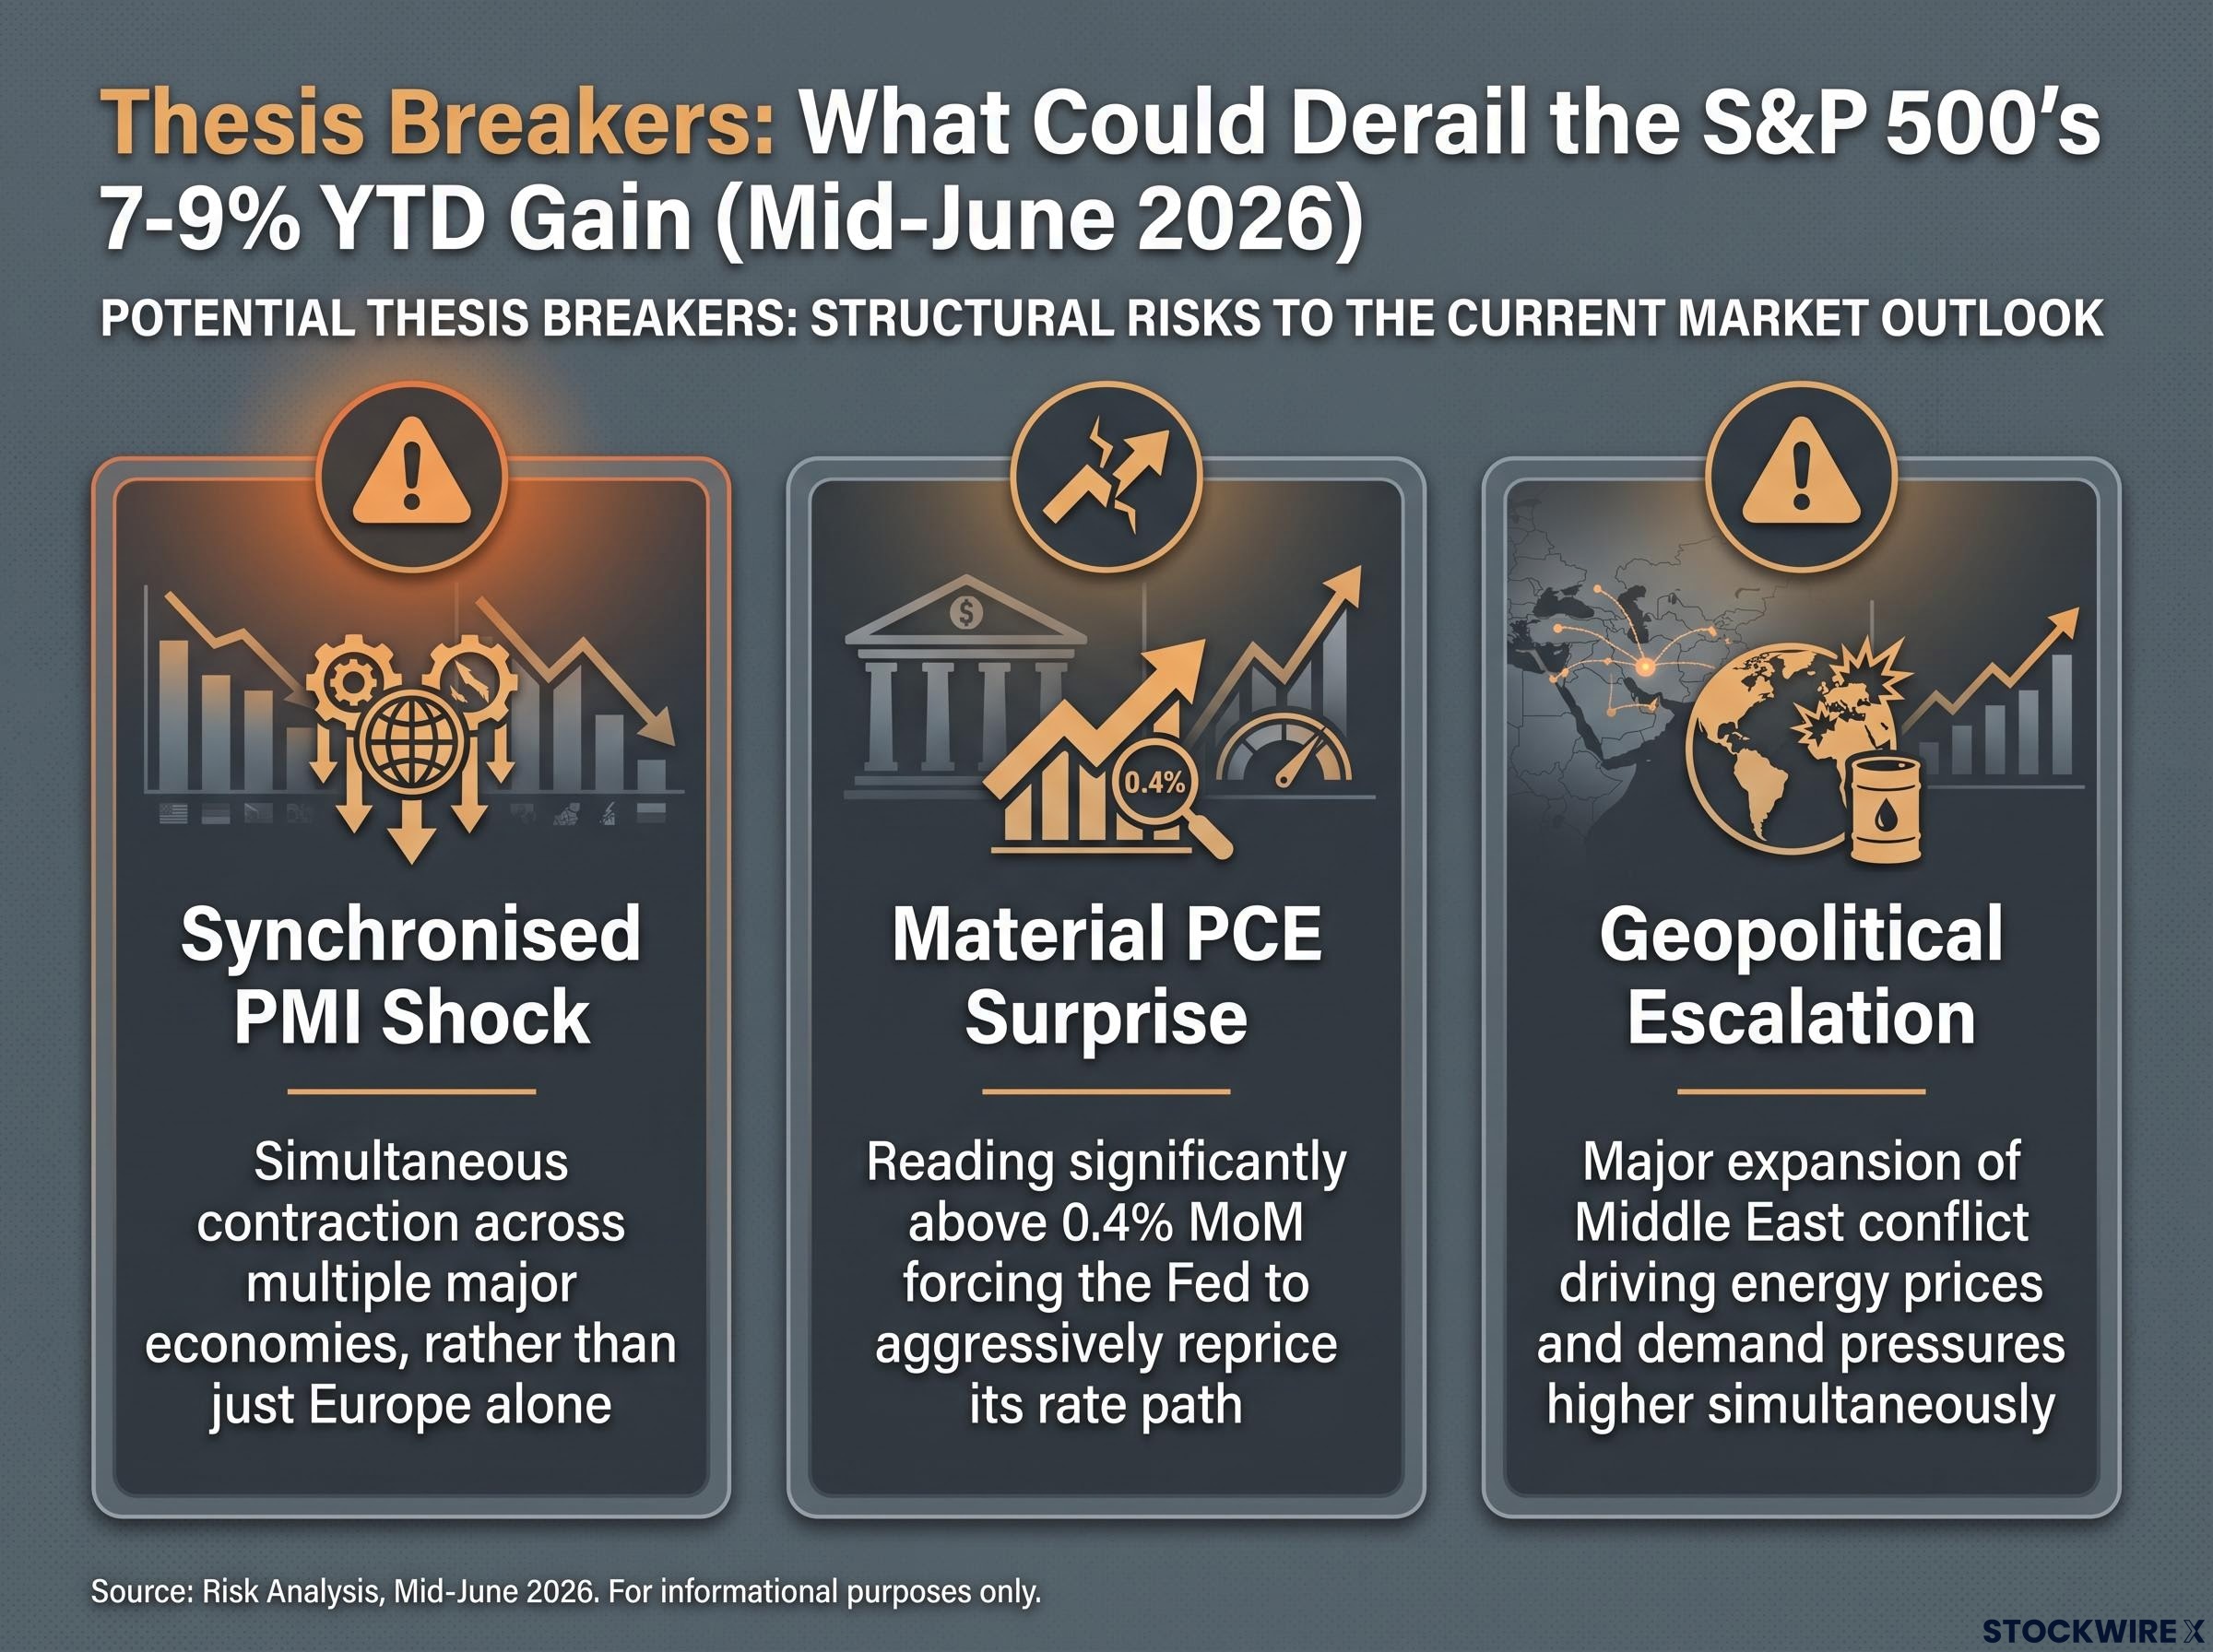
The Early Warning Signal The May U.S. manufacturing PMI showed input costs rising at the fastest pace since mid-2022, flagging supply-chain and energy pressure without signalling demand collapse.
These three conditions form your personal checklist for the coming weeks. If any of them materialise, the constructive thesis requires immediate reassessment rather than confirmation. However, none of these represent the current base case.
The data arriving this week will either confirm or complicate the baseline equity gains established by the S&P 500, which sits up 7-9% for the year. Institutional projections of high-single to low-double-digit equity gains rely entirely on these metrics avoiding catastrophe.
This market environment does not demand perfect economic outcomes. It simply requires that incoming data remains clear of genuinely damaging territory, and that is precisely the standard the 23 June 2026 Eurozone flash PMI and upcoming U.S. PCE prints need to meet.
For investors wanting a complete scenario map for the trading days ahead, our dedicated guide to this week’s PCE and PMI setup covers the Iran ceasefire framework’s direct bearing on the inflation print, the 2-year Treasury yield as a real-time signal across all outcomes, and specific sector rotation implications if PCE surprises to the upside.
You should leave this week with a clear sense of what “good enough” looks like for your positioning. Once this data cycle closes, your attention must shift to the next genuine inflection points in the macro narrative.
Keep the following forward-looking variables on your radar: The specific pass-through rate of rising manufacturing input costs to final consumer prices in Q3. Whether European service-sector demand begins stabilising as regional energy costs find a plateau. The resilience of U.S. corporate earnings forecasts against a backdrop of prolonged, elevated interest rates. Any shifts in Federal Reserve forward guidance during their post-PCE communications.
This article is for informational purposes only and should not be considered financial advice. Investors should conduct their own research and consult with financial professionals before making investment decisions. Past performance does not guarantee future results, and financial projections are subject to market conditions and various risk factors.
—
A PMI below 50 means more firms are contracting than expanding, but it does not automatically signal a recession. Research from the ECB and Bank of England shows PMI false recession signals occur in roughly 30-40% of cases across advanced economies, because growth concentrated among larger firms can keep the broader economy moving forward even as the headline index dips.
The May 2026 headline CPI spike to 4.2% year-on-year was driven almost entirely by energy prices, specifically gasoline up 40.5% annually on an Iran-conflict supply shock, not broad demand-driven overheating. Core CPI, which strips out food and energy, held at a much more contained 2.9%, and the Fed's preferred PCE metric showed no meaningful acceleration.
The Personal Consumption Expenditures (PCE) index measures inflation by tracking consumer spending patterns and adapts more rapidly to real shifts in how households allocate spending than CPI does. The Fed uses core PCE, which excludes food and energy, as its primary inflation gauge precisely because it filters out the volatile, often mean-reverting categories that can distort the headline CPI reading.
A May PCE print near the consensus estimate of approximately 0.4% month-on-month would reinforce the manageable-inflation narrative and is highly unlikely to push the Fed toward renewed hawkishness. That outcome supports current price-to-earnings multiples and confirms the rate environment underpinning the S&P 500's 7-9% year-to-date gain remains intact.
The three conditions that would force an immediate portfolio reassessment are: a synchronised PMI shock showing simultaneous contraction across multiple major economies, a PCE reading materially above 0.4% month-on-month that forces aggressive Fed rate repricing, and a major expansion of Middle East conflict that drives energy prices and demand pressures higher simultaneously. None of these represent the current base case.