
KOSPI Drops 10% as Crowded AI Trade Unwinds Across Global Markets
1 hr ago
Short sellers sharpened their positions across the ASX last week, adding to bets against Healius, IPH, and Cochlear while simultaneously covering in Telix Pharmaceuticals, Orezone Gold Corporation, and Steadfast Group. The split in conviction, captured in the Week 26 short-selling data (period ending 15 June 2026, published 22 June 2026), offers the freshest read on where professional bears think the Australian market is mispriced heading into the second half of 2026. Bears are piling into structurally challenged healthcare, childcare, and selected consumer names. They are retreating from growth equities, gold miners, and M&A targets where catalysts or deal certainty have shifted the calculus against them. What follows maps the Week 26 data across all major movers, explains what the divergence means for different sectors, and shows how to interpret the weekly versus monthly trend to avoid misreading a tactical trim as a genuine sentiment shift.
The most concentrated area of new short interest sits in healthcare and diagnostics, where three names saw sharp week-on-week increases:
The cluster reflects persistent market concern about cost inflation, Medicare rebate constraints, and post-COVID pathology volume normalisation. These are not new headwinds, but the rising short interest suggests professional investors believe the market has not priced them adequately.
The Healius short interest build in Week 26 continues a trend that accelerated sharply in May 2026, when the stock lost roughly 20% in a single session after guiding to underlying EBITDA approximately 4% below analyst consensus and Goldman Sachs downgraded its rating, with bears pressing harder rather than covering into the weakness.
The build extends beyond healthcare. G8 Education (GEM) rose to 5.58% short interest, up 1.15 ppts week-on-week, while Universal Store Holdings (UNI) climbed to 3.85%, up 0.72 ppts week-on-week and 1.29 ppts month-on-month.
Then there are the bounce-faders. JB Hi-Fi (JBH) saw shorts rise 0.52 ppts to 2.52% despite the stock rallying roughly 13% from its 3 June 2026 low. Reliance Worldwide Corporation (RWC) tells the same story more emphatically.
Reliance Worldwide short interest rose 1.03 percentage points to 3.44% in a week where the stock had already rallied roughly 17% over the prior month. Professional short sellers are questioning whether recent share price strength reflects durable recovery.
The covering activity mirrors the builds with equal coherence. Bears are stepping back precisely where catalysts, commodity prices, or deal certainty have shifted the risk-reward against them.
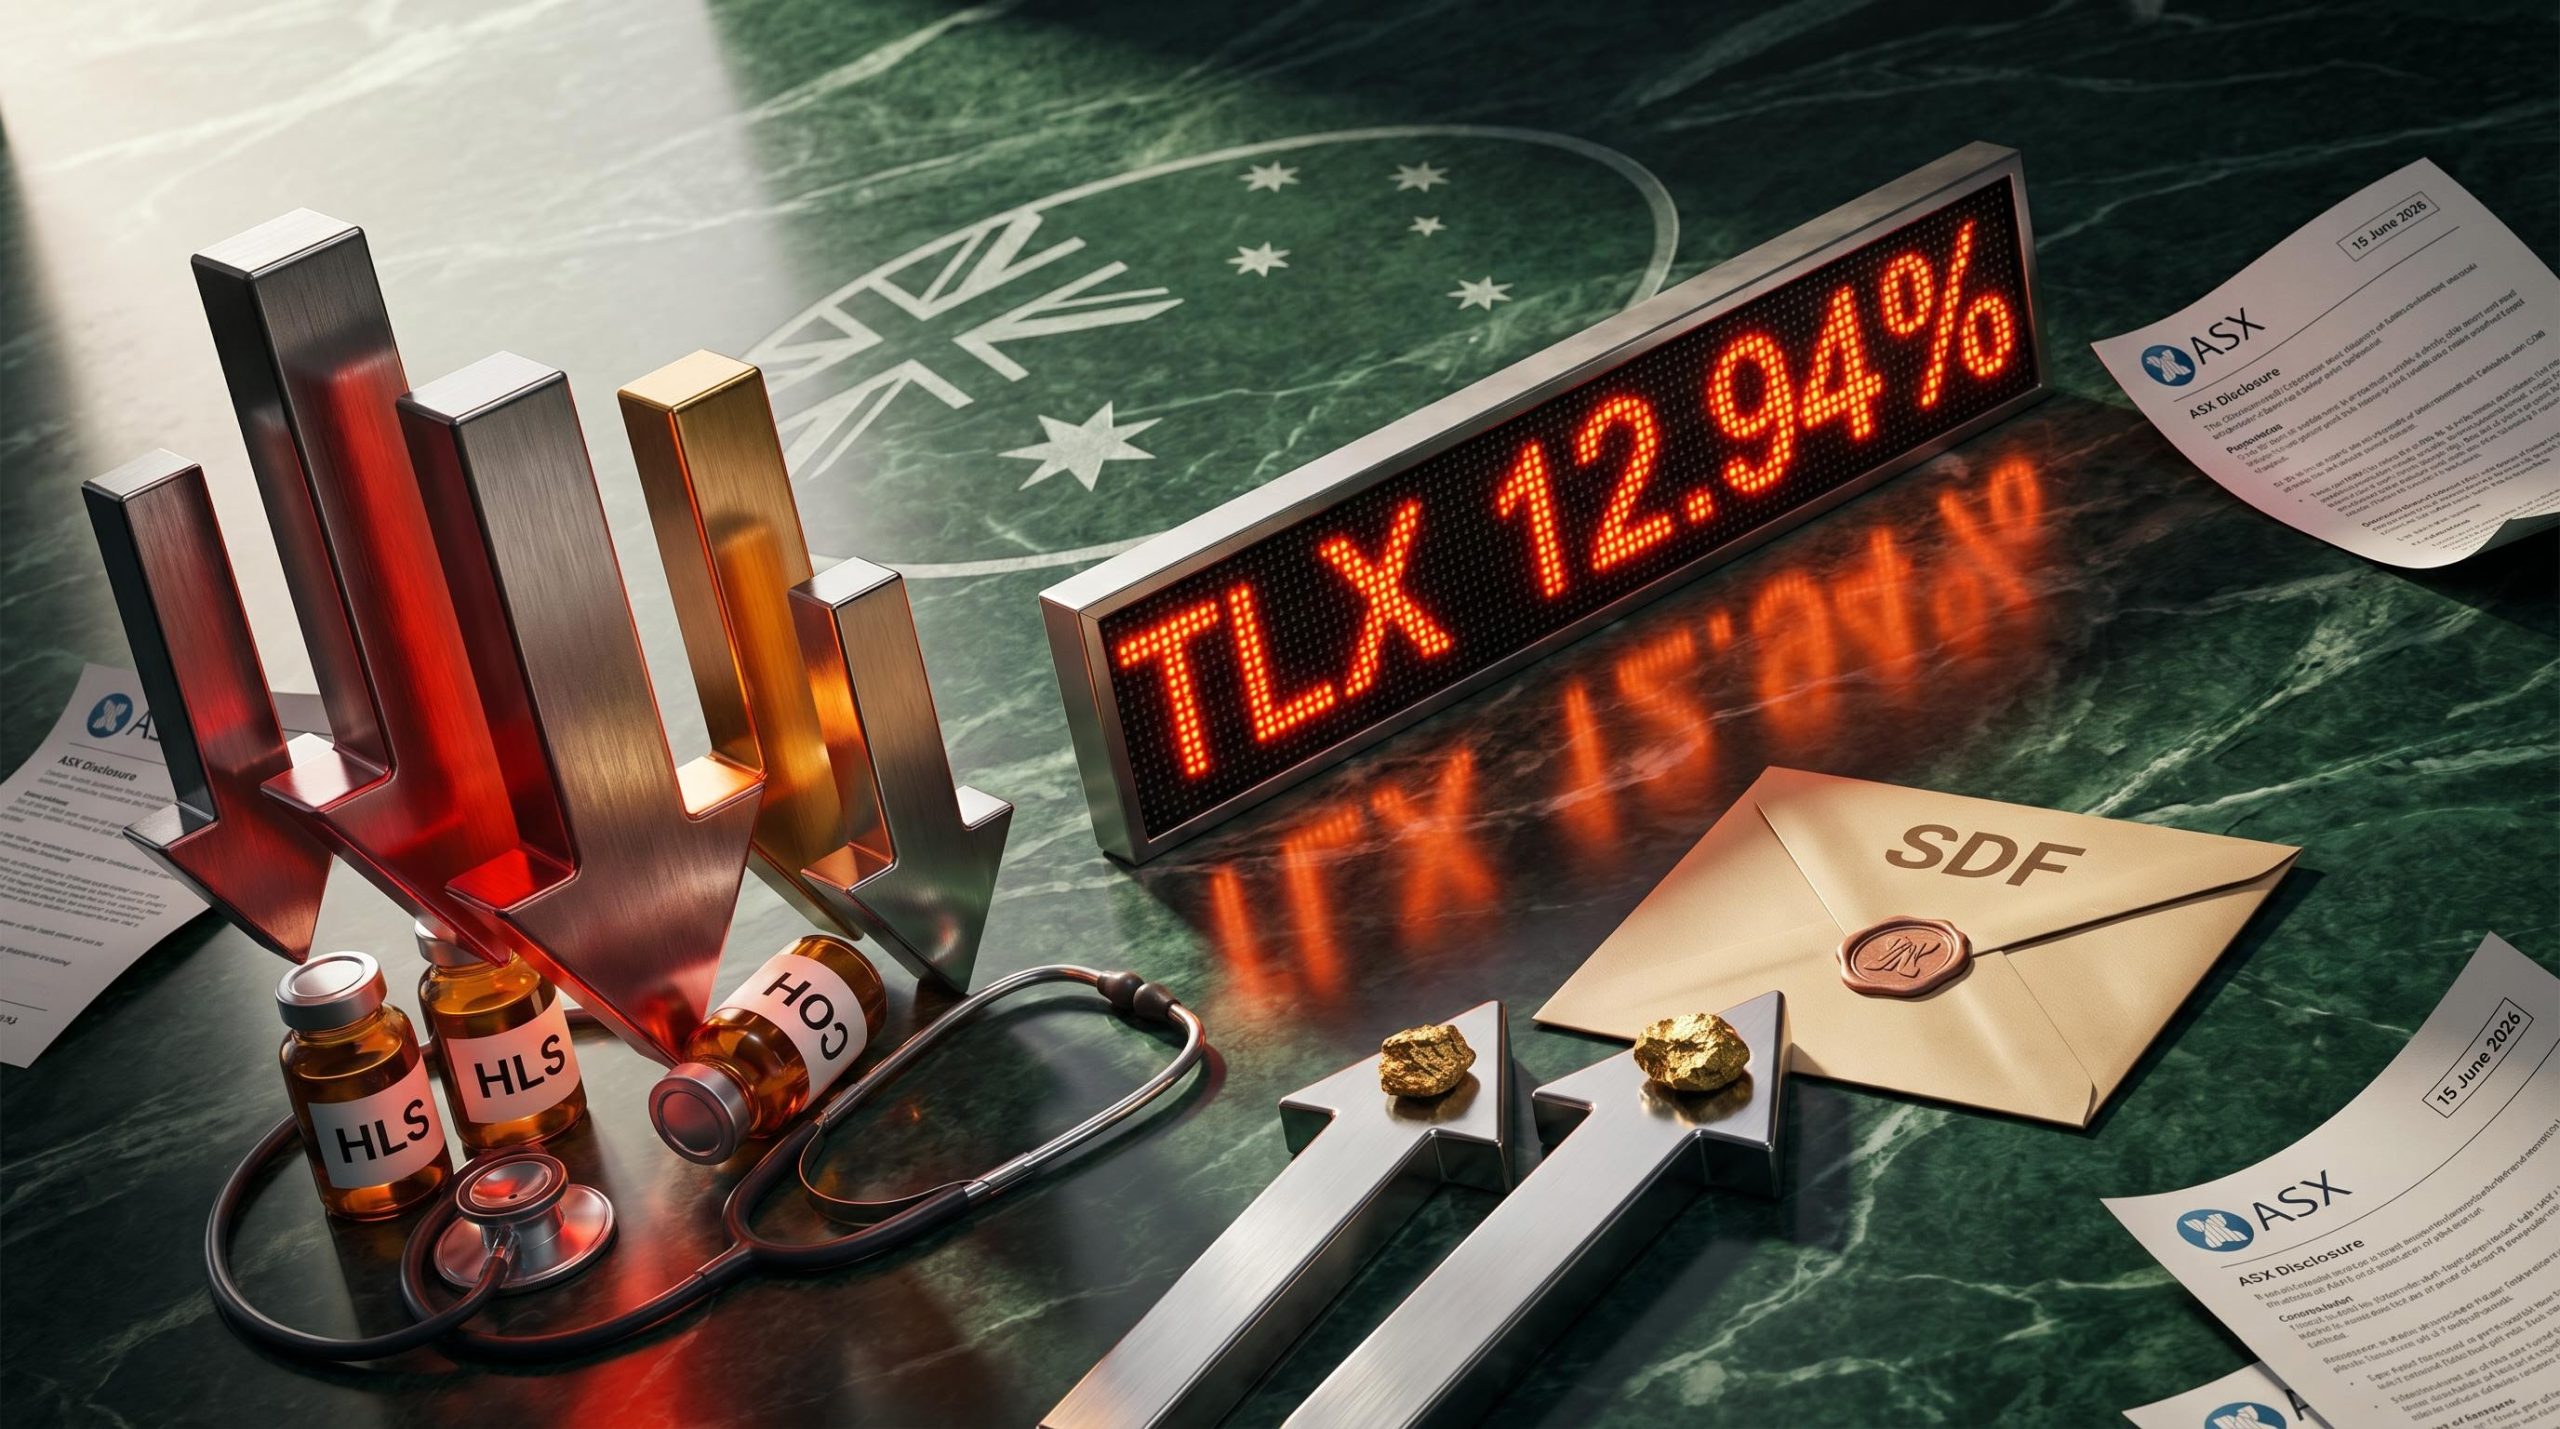
Telix Pharmaceuticals (TLX) remains the most heavily shorted stock on the ASX at 12.94%, but short interest fell 1.86 ppts week-on-week and 2.04 ppts month-on-month. NextDC (NXT) dropped to 7.47%, down 0.75 ppts week-on-week and 1.19 ppts month-on-month. Absolute short interest remains elevated in both names, but the direction of travel has shifted.
Covering across miners and corporate activity names was equally pronounced:
Resilient commodity prices eroded the bear thesis in gold and mineral sands names. In M&A situations such as Steadfast and Qube, covering is a rational risk-management response: the potential loss from a deal completing at a premium typically outweighs the remaining downside the short seller was positioned for.
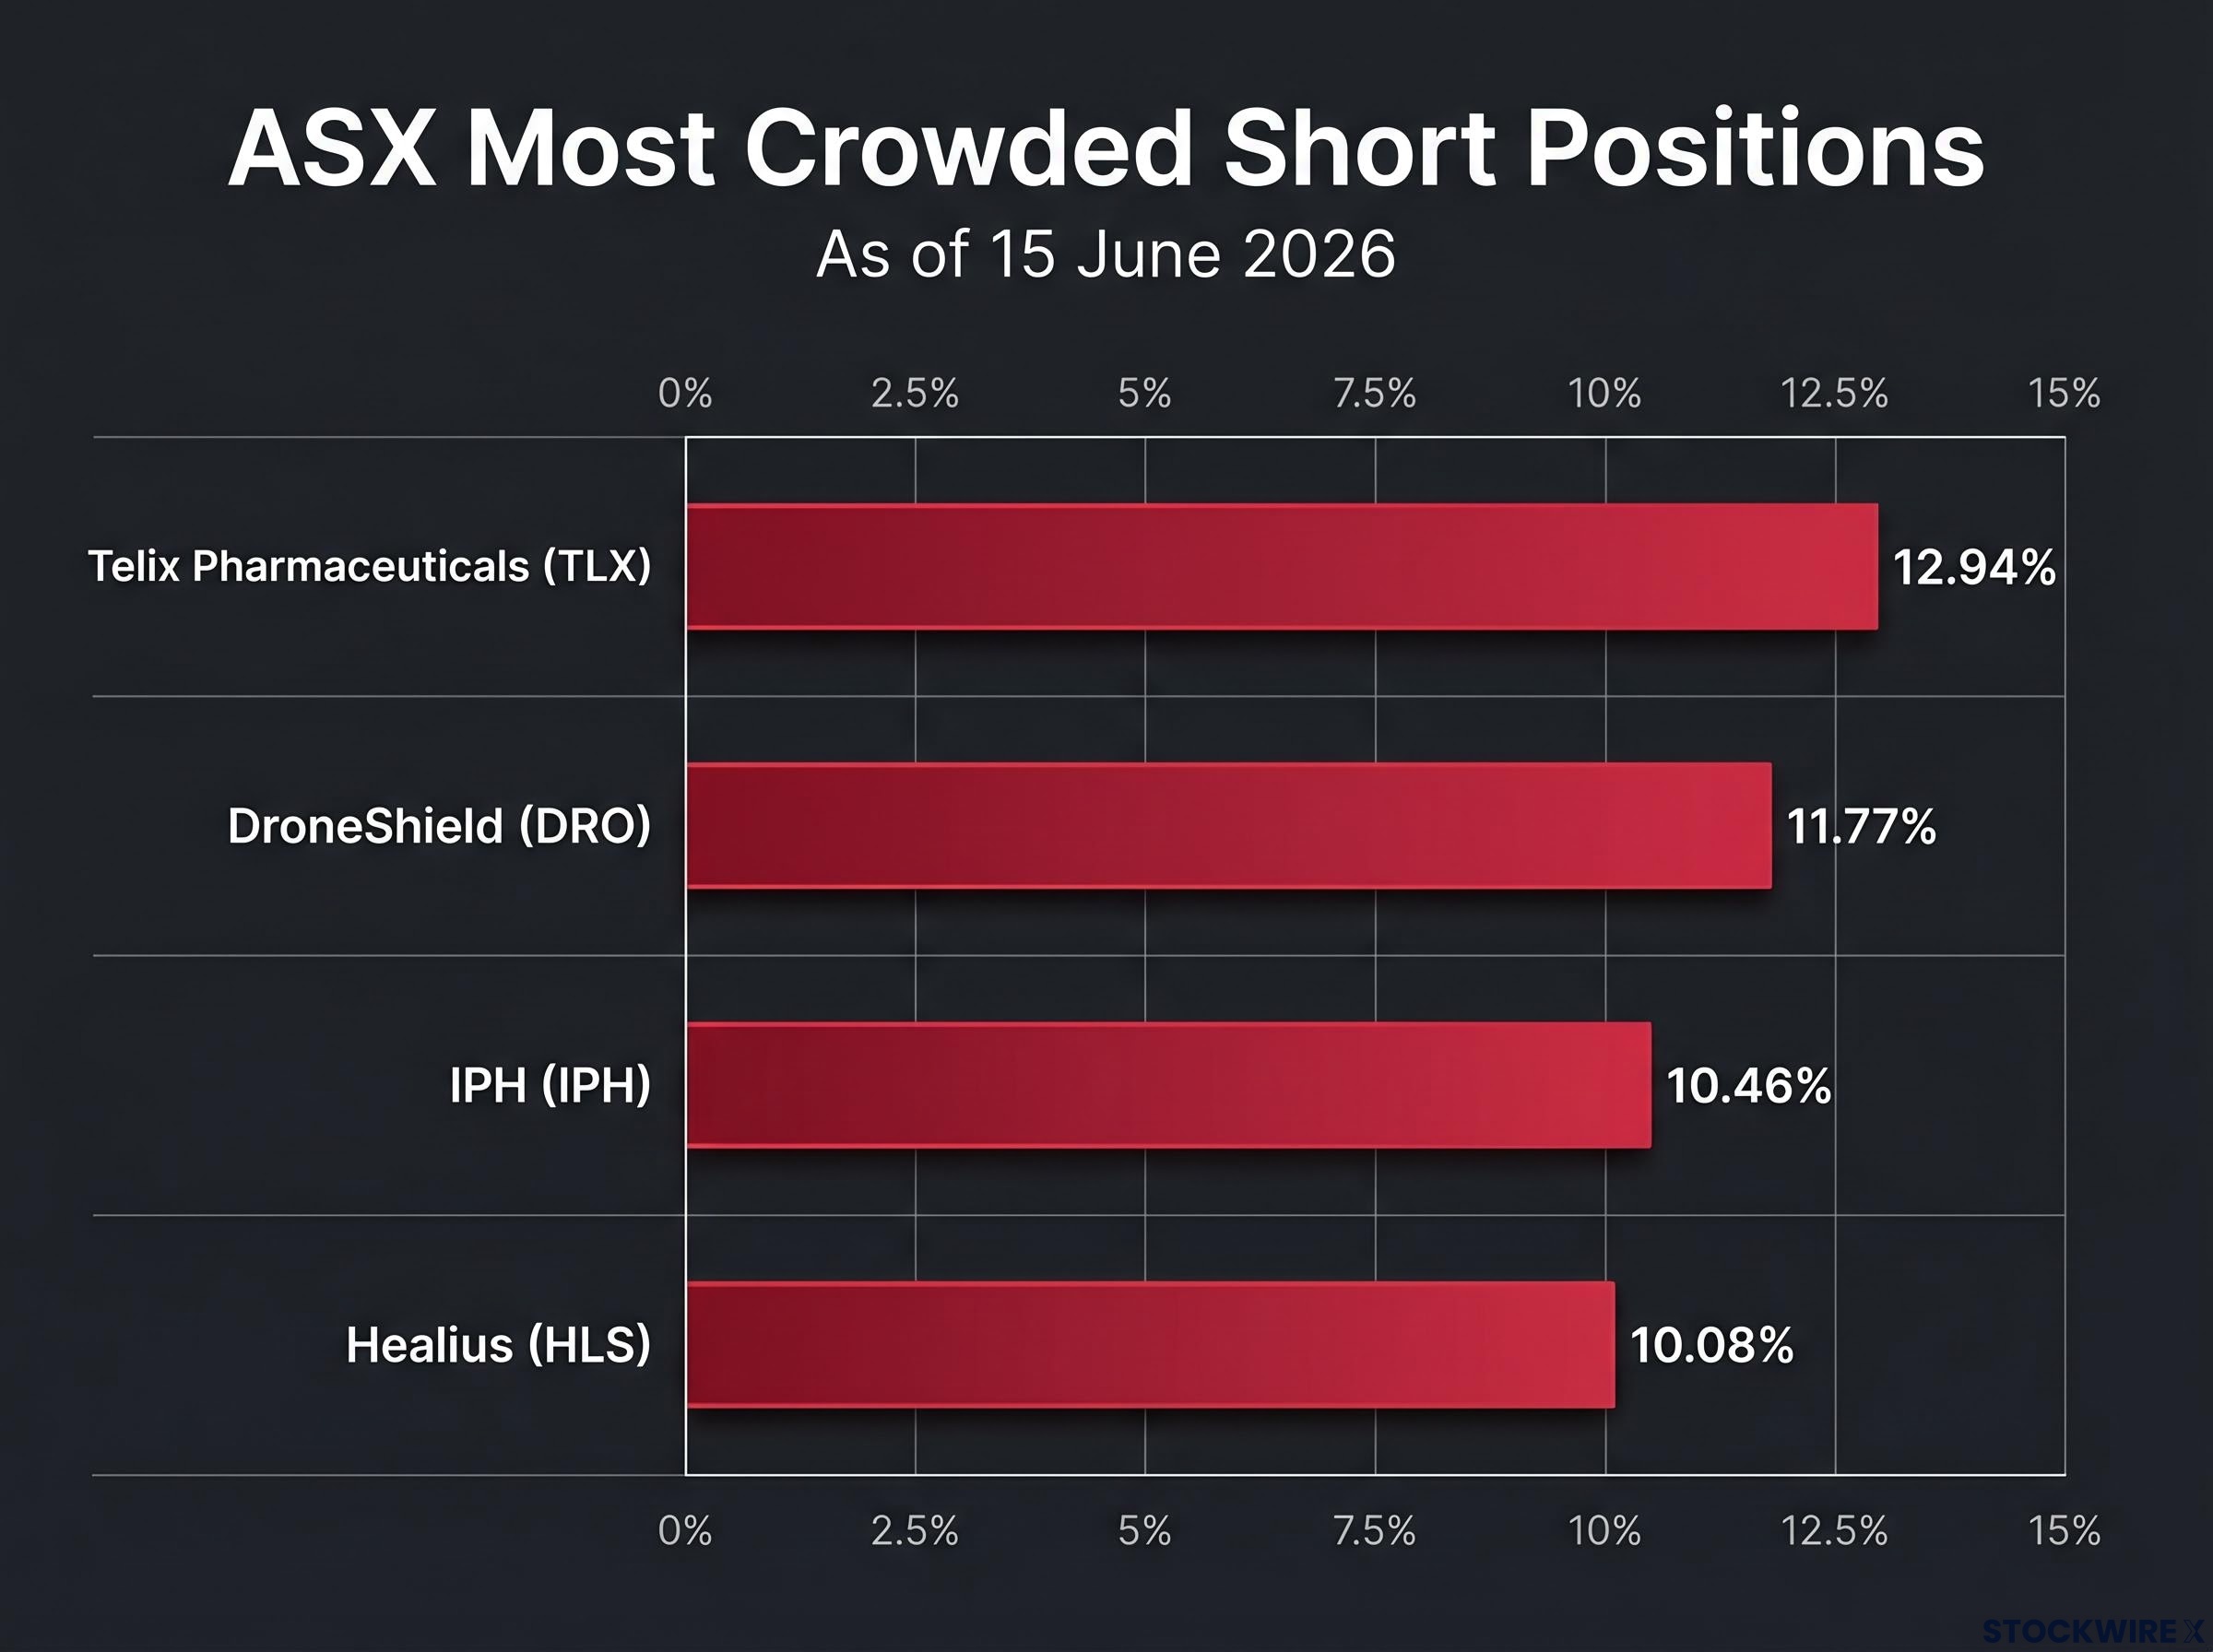
Thirteen ASX-listed stocks carried short interest above 5% as of 15 June 2026. These are the names where short-squeeze risk is most acute.
When a heavily shorted stock receives a positive catalyst, such as an earnings beat, regulatory approval, or deal announcement, short sellers must buy shares to close their positions. That forced buying can amplify price moves sharply upward, creating a short squeeze. The higher the short interest, the more fuel is available for that dynamic.
| Stock | Ticker | Short Interest (%) | WoW Change (ppts) | MoM Change (ppts) |
|---|---|---|---|---|
| Telix Pharmaceuticals | TLX | 12.94% | -1.86 | -2.04 |
| DroneShield | DRO | 11.77% | -0.57 | +0.32 |
| IPH | IPH | 10.46% | +1.70 | +1.48 |
| Healius | HLS | 10.08% | +1.59 | +0.42 |
| Elders | ELD | 8.93% | -0.59 | +1.66 |
| Generation Development Group | GDG | 8.76% | -0.60 | -0.90 |
| Australian Clinical Labs | ACL | 8.29% | +1.12 | +0.14 |
| NextDC | NXT | 7.47% | -0.75 | -1.19 |
| Iluka Resources | ILU | 6.58% | -0.78 | -1.26 |
| Deep Yellow | DYL | 6.40% | +0.67 | +0.58 |
| Vulcan Energy Resources | VUL | 5.88% | +0.72 | +0.66 |
| Cochlear | COH | 5.83% | +0.93 | +1.08 |
| G8 Education | GEM | 5.58% | +1.15 | +0.19 |
IPH stands out as an anomaly within the crowded-short cohort. Short interest surged 1.70 ppts week-on-week and 1.48 ppts month-on-month to 10.46%, despite the intellectual property services firm having reported solid half-year results in February 2026. The build reflects renewed bearish conviction rather than a leftover position from an earlier thesis.
Crowded short positions are a two-sided risk. They confirm widespread bearish conviction, but they also create the conditions for violent upward moves if the consensus proves wrong.
The short squeeze conditions that materialised for Polynovo and Guzman Y Gomez in May 2026 share a common profile with several names in the Week 26 cohort: short interest above 10%, limited daily liquidity relative to the total position size, and a credible catalyst capable of invalidating the core bearish thesis.
ASX short interest disclosures measure aggregated disclosed positions above ASIC reporting thresholds. They are subject to a four-business-day publication lag (T+4), meaning the Week 26 data reflects positions as of 15 June 2026 but was published on 22 June 2026. This is a snapshot of where professional investors stood, not where they stand today.
The ASIC short selling disclosure rules require reportable short positions to be submitted to the exchange on a T+2 basis and published with a further delay, producing the T+4 lag between position date and public availability that applies to the Week 26 figures referenced throughout this article.
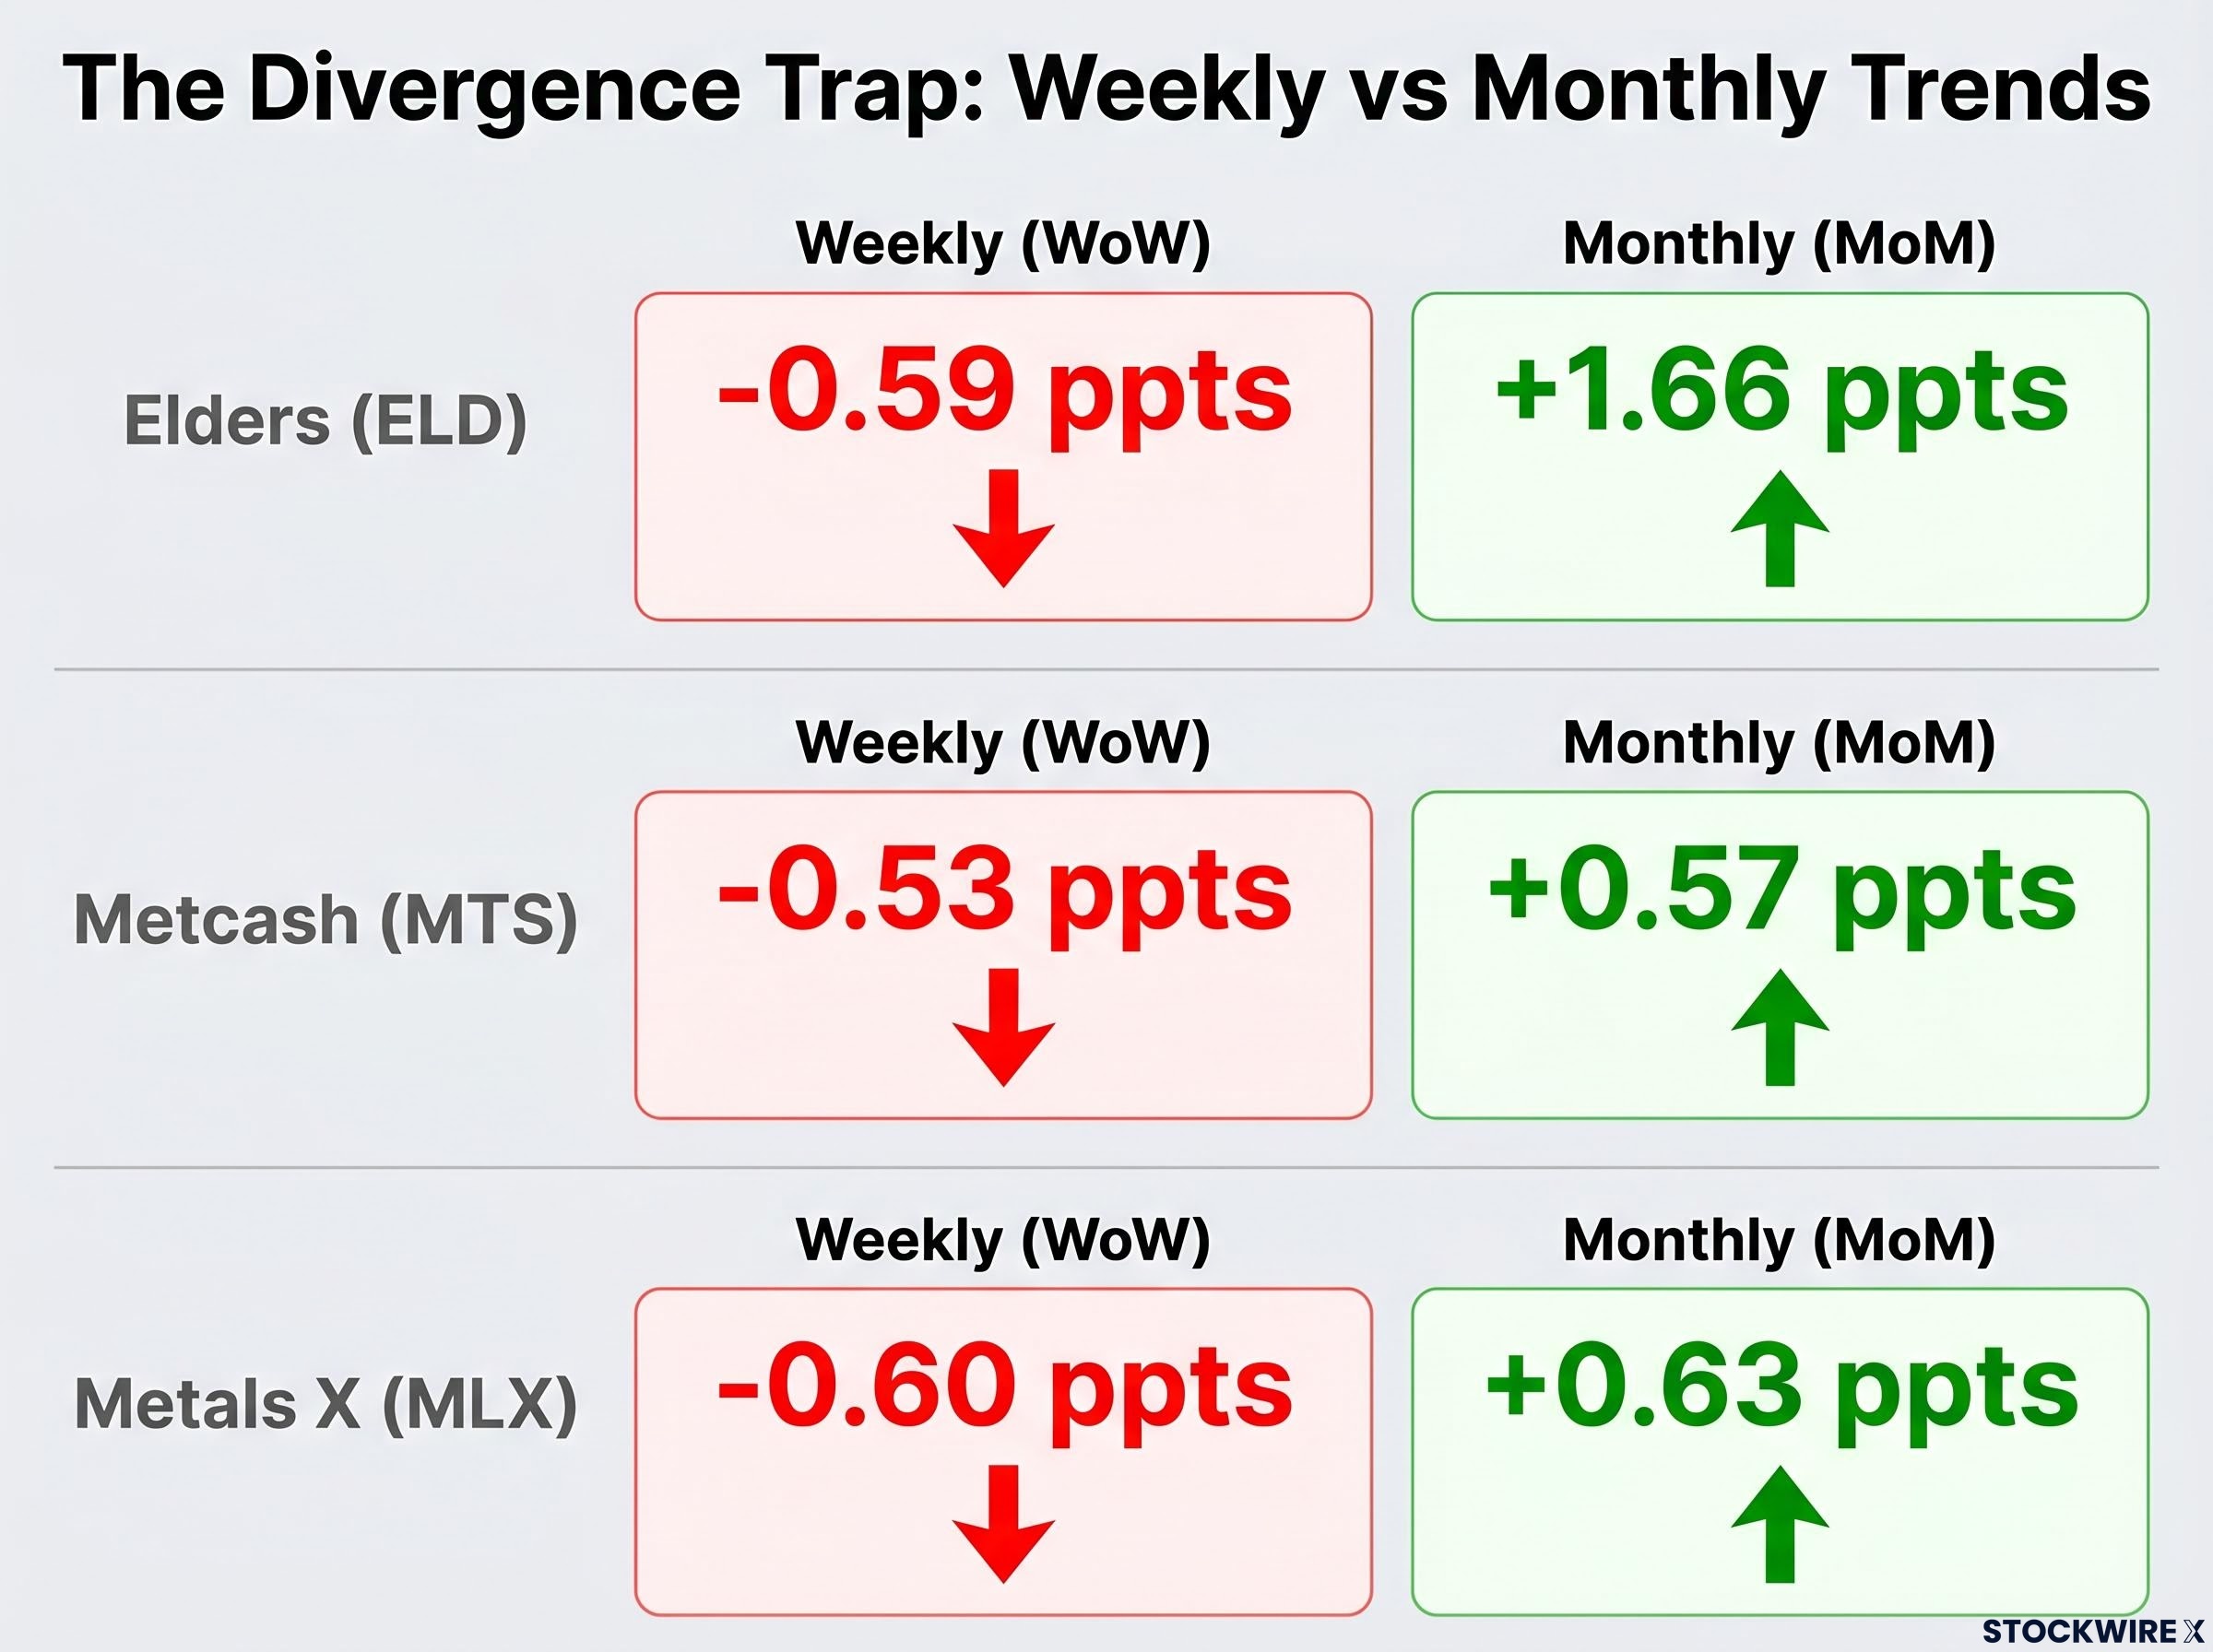
A single week’s movement can disguise the broader trend. Three names in the Week 26 data illustrate why the monthly figure matters more than the weekly one:
In each case, the weekly decline looks like a retreat. The monthly trend tells a different story: sustained bearish conviction with a single week’s tactical trim on top.
Short interest data is most useful as a sentiment overlay and risk-management input. It identifies where professional investors have placed significant capital behind a negative view. It does not determine who will ultimately be proved correct.
Zooming out from individual stocks, the sector-level map confirms that the Week 26 positioning is not a stock-by-stock story but a coherent read on where professional bears think ASX sector risks are concentrated.
Sectors attracting the most sustained short-building:
The prior week’s ASX short data showed uranium names including Lotus Resources carrying nearly 20% short interest while lithium names saw covering, a sectoral rotation that provides directional context for the Week 26 continuation of uranium and lithium positioning visible in Deep Yellow, NexGen Energy, and Vulcan Energy Resources.
Sectors seeing the most covering:
ASX Limited (ASX) is an unusual standout. Short interest reached 4.27%, up 0.65 ppts week-on-week and 2.09 ppts month-on-month, one of the most sustained monthly accumulations in the dataset for a large-cap exchange operator.
The clustering of short interest in related names often reflects a shared macro or regulatory thesis that is worth understanding even for investors who do not trade on short data directly.
The aggregate short-selling picture heading into H2 2026 carries a coherent message. Bears are most convicted on structural headwinds in healthcare and childcare, sceptical about the durability of recent discretionary consumer and industrial rallies, and retreating from commodity and deal-driven names where the risk-reward has shifted against a short position.
The Week 26 data reveals a market where professional short sellers are not uniformly negative. They are actively managing risk, building where they see structural weakness and covering where catalysts, commodity prices, or corporate activity have eroded their thesis.
The most heavily shorted names, Telix Pharmaceuticals at 12.94%, DroneShield at 11.77%, IPH at 10.46%, and Healius at 10.08%, represent both the highest consensus bearish positioning and the highest squeeze risk. Short interest is a sentiment indicator reflecting professional investor views as of 15 June 2026, not a guarantee of future price direction.
For Australian investors, the most actionable use of this data is as a risk-management overlay rather than a timing signal. It should be read alongside fundamentals, valuation, and macro views to form a complete picture.
Short selling data reveals where professional investors have placed significant capital behind a negative view. It does not tell investors when, or whether, that view will be vindicated. The Week 26 figures (period 5-15 June 2026, published 22 June 2026) capture a specific slice of the market’s positioning under ASIC reporting thresholds, subject to the T+4 publication lag. They are not the full picture.
The T+4 publication lag is a structural feature of the ASIC short-selling reporting rules, which require disclosure of all on-market short sales regardless of size, a more granular regime than equivalent US or UK frameworks, but one that still means institutional positioning is established well before retail investors can act on the published data.
The data is most useful as a starting point for further research into the named stocks, not as a standalone signal. Investors encountering any of the names highlighted in this week’s figures should treat the short interest reading as one input among many, a sentiment map that gains meaning only when layered over price action, fundamentals, and broader market context.
This article is for informational purposes only and should not be considered financial advice. Investors should conduct their own research and consult with financial professionals before making investment decisions.
Short interest data sourced from ASX/ASIC short-selling disclosures as reported by Market Index, authored by Kerry Sun (Lead Writer). Data period: 5 June to 15 June 2026 (week-on-week); 18 May to 15 June 2026 (month-on-month). Published 22 June 2026.
ASX short selling involves borrowing shares and selling them in the hope of buying them back at a lower price, with the difference representing profit. ASIC requires disclosure of all on-market short positions, which are published with a four-business-day lag, giving investors a delayed but useful read on professional sentiment.
As of 15 June 2026, the most heavily shorted ASX stocks are Telix Pharmaceuticals at 12.94%, DroneShield at 11.77%, IPH at 10.46%, and Healius at 10.08%, all of which carry elevated short-squeeze risk alongside high bearish conviction.
Bears are building positions in Healius, Australian Clinical Labs, and Cochlear due to persistent concerns about cost inflation, Medicare rebate constraints, and post-COVID pathology volume normalisation, headwinds the market is seen as not having fully priced in.
A single week's decline in short interest can be misleading; for example, Elders fell 0.59 percentage points week-on-week but rose 1.66 percentage points month-on-month, indicating a tactical trim within a sustained bearish trend rather than a genuine sentiment shift.
Short interest data is best used as a sentiment overlay and risk-management input alongside fundamentals, valuation, and macro context, not as a standalone timing signal, since the T+4 publication lag means institutional positions are established well before the data becomes publicly available.


